Who uses early childhood education
and care services? Comparing socioeconomic
selection across five western policy contexts
Amélie Petitclerc
1,2,3*, Sylvana Côté
4,5,6, Orla Doyle
1,7, Margaret Burchinal
8, Catherine Herba
5,9,10,
Henrik Daae Zachrisson
11,12, Michel Boivin
6,13, Richard E. Tremblay
14,15, Henning Tiemeier
10,16, Vincent Jaddoe
16and Hein Raat
17Abstract
Growing evidence suggests that children’s participation in early childhood education and care (ECEC), especially center-based services, is associated with positive outcomes, particularly for children over one year of age and children of low socioeconomic back-grounds. This signals an important opportunity for reducing socioeconomic disparities in young children’s development. Many western countries have adopted policies to encourage maternal employment, facilitate ECEC service use, or both, often focusing on disadvantaged families. Yet few studies to date have tested the impact of these policies for reducing socioeconomic selection into ECEC. This study integrates data from five cohorts of children living in different western, high-income countries (UK, USA, Netherlands, Canada, and Norway; total N = 21,437). We compare participation rates and socioeconomic selection into ECEC across the different policy contexts in infancy (5–9 months) and early childhood (36–41 months). Policy environments where parents had access to at least 6 months of paid maternity/parental leave had lower ECEC participation in infancy but higher participation in early childhood. Higher par-ticipation rates were also associated with universal ECEC subsidies (i.e., not targeted to low-income families). In general, low income, low maternal education and having more than one child were associated with reduced use of ECEC. Selection effects related to low income and number of children were reduced in countries with universal ECEC subsidies when out-of-pocket fees were income-adjusted or reduced for subsequent children, respectively. Most socioeconomic selection effects were reduced in Norway, the only country to invest more than 1% of its GDP into early childhood. Nevertheless, low maternal education was consistently associated with reduced use of ECEC services across all countries. Among families using services however, there were few selection effects for the type of ECEC setting (center-based vs. non-center-based), particularly in early childhood. In sum, this comparative study suggests wide variations in ECEC par-ticipation that can be linked to the policy context, and highlights key policy elements which may reduce socioeconomic disparities in ECEC use.
Keywords: Early childhood education and care, Center-based child-care,
Cross-country analysis, Socioeconomic factors, Family policies
Open Access
© The Author(s) 2017. This article is distributed under the terms of the Creative Commons Attribution 4.0 International License (http://creativecommons.org/licenses/by/4.0/), which permits unrestricted use, distribution, and reproduction in any medium, provided you give appropriate credit to the original author(s) and the source, provide a link to the Creative Commons license, and indicate if changes were made.
RESEARCH
*Correspondence: amelie.petitclerc@ northwestern.edu 3 Department of Medical Social Sciences, Feinberg School of Medicine, Northwestern University, 633 N. St Clair, Suite 1900, Chicago, IL 60611, USA Full list of author information is available at the end of the article
Background
Early childhood education and care (ECEC) services have become essential in industrial-ized countries, where a high proportion of children live with two working parents or a
single working parent (Bianchi 2011; OECD 2011). In addition, many governments
con-sider that high-quality ECEC contributes to children’s development (OECD 2007;
Plan-tenga and Remery 2009). For these reasons, as well as the related goals of supporting
maternal employment and gender equality, reducing child poverty, and reducing social exclusion among immigrants, governments have adopted various policies to facilitate
ECEC use (Adema 2012; Gambaro et al. 2014a).
However, in most countries, the demand for ECEC places exceeds the supply, and
many families cannot find or afford their preferred arrangement (OECD 2007;
Plant-enga and Remery 2009). As a result, the distribution of ECEC users may vary widely
across socioeconomic strata (OECD 2005). This socioeconomic selection into ECEC
raises important concerns about equal opportunities for children’s early development. Moreover, research suggests that children from the most disadvantaged socioeconomic
backgrounds are most likely to benefit from participating in ECEC (Côté et al. 2007,
2013; Geoffroy et al. 2007, 2010), and particularly center-based ECEC (Côté et al. 2013;
Gregg et al. 2005; Loeb et al. 2004). Thus, in order to help reduce inequalities in
chil-dren’s development, it is important to identify which policies can help minimize socio-economic selection into ECEC services.
In a recent publication, Gambaro et al. (2014b) gathered information from several
industrialized countries about their ECEC policies and the extent to which the most dis-advantaged families participated in ECEC and had access to high-quality services. By comparing findings across countries, they concluded that universal (i.e., not targeted to low-income families) and free ECEC services were most likely to foster the participa-tion of disadvantaged families. Where services were not free, they suggested that guar-anteed places, transparent, stable, and generous subsidies made available to working and non-working parents, and income-based sliding fees with very low costs for the poorest
families, would also encourage participation in ECEC (Stewart et al. 2014). This work
provided rich detail about each country’s policy context and history, and presented important data about ECEC users. However, this country-by-country approach does not directly compare the extent of inequality in ECEC use across countries or test specific hypotheses about which policies are associated with highest, and most equal use.
Study objectives
In this study, we propose a more direct empirical comparison using integrated data from several different countries. Our goal was to compare participation rates and socio-economic selection into ECEC across policy contexts and in relation to specific policy elements. We selected five longitudinal studies conducted in high-income, developed countries. All five studies contained data about ECEC attendance in infancy and early childhood, as well as family demographic and socioeconomic characteristics. These studies are the Millennium Cohort Study (MCS) in the UK; the National Institute of Child Health and Development Study of Early Childcare and Youth Development (SEC-CYD) in the USA; the Generation R Study from Rotterdam in the Netherlands; the Québec Longitudinal Study of Child Development (QLSCD) in the province of Québec,
Canada; and the Behavior Outlook Norwegian Developmental Study (BONDS) in South East Norway. We compared each study on ECEC use, and the use of center-based vs. non-center-based ECEC settings, in both infancy and early childhood, and on the extent to which participation was subject to socioeconomic selection. We also tested contrasts across studies to assess the role of specific policy elements on which they differed.
In this section, we describe the specific policy contexts in which the five studies included in this analysis took place. Next, we review the literature on the effects of child and family policies on ECEC participation and, on that basis, we form hypotheses about rates of ECEC use and the role of selection factors across the different policy settings.
Child and family policy contexts across the five studies
Several types of family policies may influence parents’ decisions about ECEC utiliza-tion, including maternity and parental leave policies, public ECEC provision or support, tax benefits for ECEC, and employment or training requirements for welfare recipients. Specific policy choices are shaped by each country’s economic, historical, and ideologi-cal context and the extent to which their societies view maternal employment, child
pov-erty and child development as public versus private responsibilities (Lamb 1998). Liberal
countries, best represented by the United States and other Anglophone countries, rep-resent one end of the spectrum, where children’s welfare and development are generally viewed as the responsibility of individual families and where the availability and
accessi-bility of ECEC services are largely driven by the market (Lamb 1998). In these countries,
government involvement typically focuses on ECEC services for lower-income,
higher-risk families (Kamerman 2000). At the other end of the spectrum are social democratic
countries, best represented by the Scandinavian countries, where children’s welfare and
development are viewed as a shared responsibility (Lamb 1998). These countries
typi-cally offer families a continuum of universal public supports, starting with long and well-paid maternity and parental leaves, followed by highly subsidized ECEC services to
which each child is entitled (Moss 2012).
The UK context at the time of the Millennium Cohort Study (MCS)
Children in the MCS were born in all countries of the UK between 2000 and 2002. At that time, all mothers were entitled to 18 weeks of paid maternity leave. Working moth-ers received the highest of a flat rate (GBP 60.20, or approximately USD 107, per week) or 90% of their average weekly earnings for the first 6 weeks and the flat rate for the fol-lowing 12 weeks, while non-working mothers received the flat rate throughout. Salaried employees with one year of continuous service were allowed to take a further 13 weeks of unpaid parental leave at any time up to when the child reached age 5 (Waldfogel
2001). There was no statutory paid paternity leave in the UK until 2003.
Starting in 1999, the New Deal for Lone Parents provided voluntary assistance to single parents who were receiving income support (welfare) and wanted to engage in employment or training. A personal advisor assisted the individual in her search and
could approve financial assistance to cover ECEC costs (Dolton and Smith 2011). In
addition, families living in the most deprived areas of the UK may have benefited from two programs (regardless of parents’ work status), Sure Start and the Neighborhood Nurseries Initiative (NNI). Sure Start aimed to integrate educational, health and welfare
services for all children between the ages 0-3, while the NNI specifically aimed to
pro-vide high-quality ECEC services for children from birth to age 4 (Smith 2007). These
initiatives were accompanied with increased use of ECEC by low-income families, but there remained important barriers in terms of access, cost, poor capacity to accommo-date atypical working hours, and insufficient supply for children under 2 years of age
(Smith 2007).
Low-income families could also benefit from a tax credit for up to 70% of the ECEC costs when using formal ECEC (i.e., provided by someone other than a family member
or a friend), if the parent (s) worked for at least 16 h a week (Brewer et al. 2005). In
addi-tion, a universal provision (i.e., not targeted to low-income families) for all 3-year-old children of 12.5 weekly hours of free educational services, for 33 weeks per year, was becoming available during this period. In 2003, 77% of 3-year-old children in England
utilized these predominantly center-based ECEC services (Brewer et al. 2005). Children
became entitled to these free services in the term after they turned 3 years old, therefore less than half of the MCS sample would have been eligible at the early childhood data collection point.
Finally, in 2003, families in the study may have been influenced by new legislation mandating employers to give serious consideration to requests made by parents of chil-dren under 6 years old for flexible work arrangements (flexible hours, shared time, work-ing from home).
The USA context at the time of the National Institute of Child Health and Development Study of Early Childcare and Youth Development (SECCYD)
Children from the SECCYD were born in 1991 in 10 sites across nine states in the United States. At that time, parental leave was available only to state employees, apart from 11 states and the District of Columbia where there were laws mandating some job-pro-tected unpaid maternity leave that also covered private sector employees. In addition, some private sector firms, particularly large or unionized firms, voluntarily offered some
unpaid parental leave (Waldfogel 1999). In 1991, 39% of workers in private medium- and
large-sized establishments had access to some maternal leave and 27% had access to some paternal leave, but approximately half of these establishments did not guarantee
job protection (Waldfogel 1999). The first Federal law (the Family and Medical Leave
Act) to guarantee job-protected unpaid leave was not enacted until 1993.
Under the Family Support Act (FSA; enacted in 1988), parents receiving welfare (Aid for Families with Dependent Children), who were predominantly single parents, were required to participate in job training, education, or employment, as soon as the child reached three years of age (and as early as one year of age in some states), in order to receive benefits. The FSA, in exchange, guaranteed ECEC for these parents, offering them subsidies that could be used for any center- or family-based settings (Kagan and
Reid 2008). For low-income working families, ECEC subsidies were available from the
states through block grants under the Childcare and Development Block Grant program, or through matching grants-in-aid, via the At-Risk Childcare Program (Title IV-A). This last program, however, was under-utilized by the states due to tight budgets (Chilman
1993). Despite governmental efforts to assist low-income families, a sizeable
families’ lack of awareness about their eligibility or to their confusion about the different
assistance programs (Phillips 1995). While the supply of ECEC was sufficient in terms of
number of places, cost remained an issue for low-income families, and almost a quarter of families using non-center-based ECEC would have preferred a place in a center
(Hof-ferth 1992). Finally, for working families with moderate to high incomes, non-refundable
tax credits for ECEC were available (Chilman 1993).
The Dutch context at the time of the Generation R Study
Children in the Generation R Study were born in Rotterdam, the Netherlands, between 2002 and 2006. Throughout this period, working mothers were entitled to 16 weeks of maternal leave (4–6 weeks before childbirth; 10–12 weeks after), paid at 100% of their salary (up to a maximum of EUR 190, or approximately USD 246 per day) for salaried employees, and at the minimum wage level for self-employed workers. Each parent could also use up to 6 months of unpaid, part-time leave until the child reached 8 years of age. Part-time work was very popular among women in the Netherlands, with 57% of them using this option in 2000. The policy context also made part-time work attractive as legislation gave workers the right to request changes to their work hours, part-time employees had the same rights as full-time employees, and the tax system allowed
trans-fers between parents (OECD 2002).
Center-based ECEC services were divided into private day-care centers, available for the children of employed parents, and publically subsidized playgroups, available for children 2–4 years old, regardless of parental employment status, typically for 2–3½ h
per day, twice a week (Akgündüz and Plantenga 2014). The cost of private day-care
ser-vices was shared between the parents and their employers. Families’ out-of-pocket con-tribution depended on their income and the number of children in ECEC, with parental
contributions decreasing for the second or further child (van Gameren and Ooms 2009).
Tax deductions for ECEC were available to families using non-subsidized private ECEC. The playgroups (also referred to as preschool education efforts) were highly subsidized by local governments (over 80%), and parents’ out-of-pocket contributions were again
income-related (OECD 2002). Early educational programs for disadvantaged children
(i.e., of low socioeconomic status, or immigrants) were mostly offered in the context
of those publically subsidized playgroups (Akgündüz and Plantenga 2014). Overall, the
supply of ECEC in the Netherlands was good, although the playgroup services were only part-time (up to only 7 h a week), so families often needed to complement with informal
child-care (mostly by family or friends; Plantenga and Remery 2009). Finally, single
par-ents who earned less than a predetermined threshold were allowed to be reimbursed for ECEC if they were looking for work or were in training.
The Québec (Canada) context at the time of the Québec Longitudinal Study of Child Development (QLSCD)
Children from the QLSCD were born in the province of Québec, Canada, between 1997 and 1998. At that time, the Canadian federal government guaranteed 17 weeks of mater-nity leave, the last 15 of which were paid, and a further 10 weeks of paid parental leave which could be shared between the parents. Payments covered 60% of the parent’s sal-ary. The funds came from the unemployment benefits program, and therefore depended
on previous employment (a minimum of 600 worked hours in the previous year) and were not available to self-employed workers or non-working parents. The Québec pro-vincial government would compensate for the first two weeks of unpaid maternity leave with a lump sum for families with an income lower than CAD 55,000 in the preceding year. In addition, fathers in Québec could use 5 days of paternity leave (the first two of which were paid) and either parent could remain in unpaid, job-protected leave for up to when the child reached 1-year old.
Since the 1988 welfare reform in Québec, single parents on welfare were considered unavailable for employment or training for as long as they had a child of preschool age (i.e., up to age 5). Subsidies were available to low-income families using regulated ECEC services. More generally, the provincial government subsidized the implementation and functioning of non-profit ECEC services. It also provided a refundable tax credit for ECEC services, which could cover 26–75% of ECEC costs, depending on family income, and increased in the year 2000.
In 1997, the Québec provincial government introduced a universal ECEC subsidy pro-gram, under which families (regardless of income) paid only CAD 5/day to attend regu-lated ECEC, either in a center or in a family-based setting. Low-income families were eligible for a further fee reduction or a fee exemption. The reduced-contribution ECEC places were made available progressively, to 4-year-old children in 1997, and expanding every year to children one year younger. Therefore, children in the QLSCD could benefit from this program at the early childhood data collection point (at 41 months, in 2001), but not when they were infants. The program was highly popular and the number of places was insufficient to meet the demand. Among children in the QLSCD who were in ECEC at 41 months, 60% benefited from this program (37% in a center; 23% in a
family-based setting; Japel et al. 2005).
The Norwegian context at the time of the Behavior Outlook Norwegian Developmental Study (BONDS)
Children from the Behavior Outlook Norwegian Developmental Study (BONDS) were born in South East Norway between 2006 and 2008. Parents of newborns were allowed a parental leave of 52 weeks, paid at 80% of their salary (some employers would supple-ment the remaining 20%), or 42 weeks paid at 100% of their salary, up to a maximum amount, if they had been employed for 6 of the past 10 months. Parents could share the leave, except for 3 weeks before the child’s birth and 6 weeks after, which were reserved
for the mother, and 4 weeks which were reserved for the father (OECD 2007).
Self-employed workers could also benefit from a similar parental leave. Mothers who were not employed or were studying at the time of the child’s birth received a non-taxable lump sum (NOK 33,584 in 2006, or approximately USD 4400). In those cases, fathers were allowed 39 weeks of parental leave at 80% of their salary or 29 weeks at 100% of their salary.
Legislation aimed to provide all children in Norway a right to ECEC from age one. The supply of ECEC services has grown in response to both legislation and
governmen-tal incentives to providers to increase capacity (Sibley et al. 2015). Almost all services
were provided in ECEC centers (fewer than 3% of children in 2010–2011 were receiving services in a family’s home), and all were regulated and heavily subsidized, even though
about half were privately owned (Ellingsaeter 2014). Out-of-pocket fees were capped at approximately NOK 2250, or USD 300, per month in 2006, and were tax deductible. They were mostly income-graded, or were reduced or waived for the lowest-income families, depending on the municipality. Fees were reduced by at least 30% for the
sec-ond child, and at least 50% for subsequent children (Ellingsaeter 2014). Parents not
opt-ing for subsidized ECEC for a child between the ages of 1 and 3 years could receive a non-taxable allowance (cash for care), which was reduced as a function of hours used in
the subsidized ECEC system (OECD 2007).
Single parents who were not working could receive an allowance (welfare) for up to 3 years after the child was born. After the child was 3 years old, they were required to be involved in education or training in order to receive the allowance for the next 2 years. The allowance was reduced as a function of income received from employment or ali-mony from the other parent. Single parents may have received an allowance to pay for a percentage (up to 70% for those with the lowest income) of private ECEC in order to work, study, or seek employment.
Child and family policies, ECEC use and socioeconomic selection
As highlighted in the previous section, the five countries have different combinations of policies that are relevant for ECEC participation. The first part of our investigation examines how ECEC participation and socioeconomic selection differ in each country vs. the average of all studied countries. Note that, in our analyses, the term “country” refers to the country’s policy context at the time of the study.
The second part focuses on the role of six policy elements shared by groups of
coun-tries (see Table 1). These include the duration of paid combined maternity and
paren-tal leave; the subsidization of universal (i.e., not targeted to low-income families) ECEC services in early childhood; the subsidization of universal center-based ECEC services in early childhood; the combination of universal subsidies and reduced out-of-pocket fees for low-income families; the combination of universal subsidies and reduced out-of-pocket fees for the second or subsequent child in a family; and mandatory employ-ment for welfare recipient single parents. The first three policy eleemploy-ments are relevant for
Table 1 Key policy elements across countries at the time of the study
A check mark (✓) indicates that the policy element was available in that country for study participants
a Universal indicates available to all children of a certain age group, regardless of family income or parental working status
b Data are from a survey sent by the OECD to country authorities in 2004 (OECD 2006)
c For the province of Quebec, expenditures were .40% of GDP
d Applicable to Early Childhood only
Policy element UK USA Neth Can Nor
At least 6 months paid maternity/parental leave ✓ ✓
Universala subsidies for at least part-time ECEC in early childhood ✓ ✓ ✓ ✓
Universala subsidies for center-based ECEC in early childhood ✓ ✓ ✓
Universala subsidies with reduced out-of-pocket costs for low-income families ✓ ✓d ✓d
Universala subsidies with reduced out-of-pocket costs for second or subsequent
child ✓ ✓
d
Mandatory employment for welfare recipient single parents in early childhood ✓ ✓ Public expenditures on ECEC (ages 0–6) in % of GDPb .50 .48 .45 .25c 1.70
ECEC participation rates, while the last three may moderate socioeconomic selection into ECEC.
In the third part of the investigation, we pay particular attention to how Norway dif-fers from the other countries. Norway is the only one of the five countries studied where
public expenditures on young children exceeded 1% of GDP (see Table 1), as
recom-mended by the Organisation for Economic Co-operation and Development (Bennett
2008). We hypothesized that this would be associated with higher rates of ECEC use in
early childhood (but not in infancy given the long paid maternity and parental leaves), and attenuated socioeconomic selection effects.
Across the five study contexts, maternity and parental leave conditions ranged from unpaid leave available to a minority of employees in the USA, to a 1-year, well-paid leave for most working mothers, with financial support to non-working mothers, in Norway. Previous comparative studies have found that mothers of young children are more likely to be employed in countries with more generous parental leave policies (Gornick et al.
1998). Although generous maternity leave decreases maternal employment shortly after
the child’s birth, it increases employment in the medium term as it helps ensure job
con-tinuity (Han et al. 2009). We hypothesized that rates of ECEC use would be related to the
length of the available paid maternity leave such that participation would be lower in the Canadian and Norwegian studies in infancy (i.e., before the end of available paid mater-nity leave), but not during early childhood.
Studies show that when governments generously subsidize ECEC on a universal basis
(i.e., regardless of family income), the use of these services increases (Baker et al. 2008;
Fitzpatrick 2010; Sibley et al. 2015). As Norway, Canada, the Netherlands, and the UK
subsidized universal ECEC services for young children (on a part-time basis for the Netherlands and the UK), we expected that participation rates in early childhood would be higher in these countries, than in the USA, where subsidies were exclusively targeted to lower-income families. In addition, we hypothesized that participation in center-based services, rather than other ECEC settings, would be higher in those countries where governments’ universal subsidies focused specifically on center-based services (i.e., Norway, the Netherlands and the UK).
Following previous studies, we considered six potential demographic and socioeco-nomic selection factors: ethnicity, maternal age, family income, maternal education,
single parenthood, and the number of children in the family (Early and Burchinal 2001;
Fram and Kim 2008; Fuller et al. 1996; Geoffroy et al. 2012; NICHD Early Child Care
Research Network 1997; Radey and Brewster 2007; Singer et al. 1998; van Gameren
and Ooms 2009; Zachrisson et al. 2013). We hypothesized that the role of these factors
would differ across policy contexts as a function of the generosity of public assistance for ECEC, in general, and for specific groups.
In all settings, the government provided a certain level of assistance with ECEC costs to lower-income families, with different strategies including tax credits or subsidies targeted to disadvantaged families or disadvantaged neighborhoods. The Netherlands, Canada, and Norway were the only countries using a combination of universal subsi-dies with reduced out-of-pocket fees for low-income families (for Canada and Norway, this was only applicable for the early childhood period). We hypothesized that this pol-icy would be associated with reduced selection effects associated with low income, as
suggested by Stewart and colleagues (Stewart et al. 2014), and as observed with a
dif-ferent Norwegian sample (Sibley et al. 2015). The Netherlands and Norway also offered
lower out-of-pocket costs for the second or subsequent child, and we anticipated that this policy would reduce selection on the basis of the number of children in the family.
In the USA and Norway, welfare recipient single parents were required to engage in employment or training once the child reached 3 years of age, in order to continue receiving benefits. Both countries also guaranteed ECEC places for children whose parent returned to work or training. Such welfare-to-work policies generally increase
employment and the use of ECEC (Bloom and Michalopoulos 2001; Han et al. 2009;
Meyers et al. 2002). We hypothesized that this policy would be associated with a higher
rate of ECEC use among single-parent families in both countries.
Methods Study participants
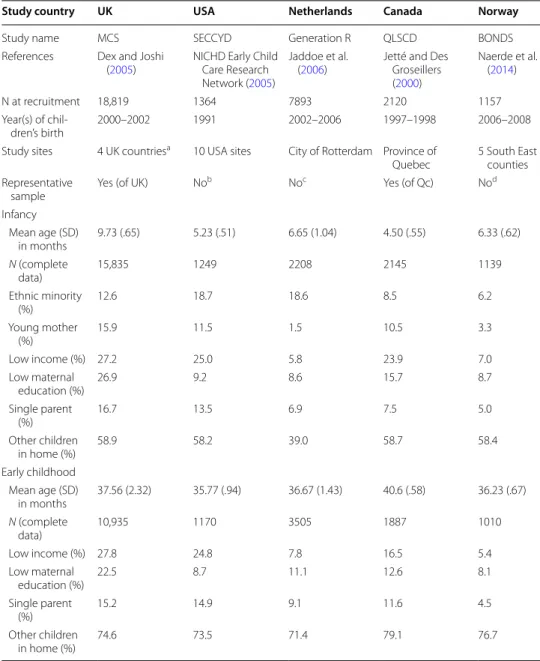
Table 2 summarizes information about the design and sample characteristics for the five
studies. More details are available in the references provided in the third row of that table.
Outcome measures
In each study, mothers were asked about current ECEC arrangements (hours per week or full-time vs. part-time, and type of ECEC) at the infancy and early childhood time points. Regular ECEC was defined as the child spending at least 9 h per week in non-parental care. Children participating in ECEC were further divided among those cared for in a center (variously defined as nursery, crèche, day-care center, or preschool) and those cared for in a non-center setting (which included care by a grandparent, another relative, a nanny, childminder, or family-based ECEC).
Measures of socioeconomic predictors
All variables used as potential predictors of ECEC use were dichotomized. Although dichotomizing variables may obscure more subtle phenomena in the ECEC selection process such as non-linear relationships, it facilitates comparisons across studies and makes the results more useful for policy makers who often design policies for families above or below a certain cutoff (e.g., poverty status). The proportion of participants in
the “disadvantaged” category of each predictor is presented in Table 2, for each study.
A correlation matrix showing associations between the 6 socioeconomic predictors, in infancy and in early childhood, is presented in electronic supplementary materials
(Additional file 1: Table S1).
Ethnicity (0 = Majority; 1 = Minority)
To explore the effect of ethnicity across countries, two groups were formed, one desig-nated as “Majority,” comprising children from Western European descent, and the other, designated as “Minority,” for children from other origins. Although immigration status might have been another important factor to consider, particularly for European coun-tries, it often overlaps with ethnic minority. To capture the importance of inequalities between African–Americans and Whites in the USA, and to use a common, relevant
indicator for all five countries, we chose ethnic minority rather than immigration status. Across the five countries studied, individuals from Western European descent constitute the majority of the population and are, on the whole, thought to be in a more advanta-geous socioeconomic situation, in addition to being less subject to racial discrimination. The proportion of children described as having “Minority” status was greatest in the studies from the USA and the Netherlands and lowest in the Norwegian study.
Table 2 Summary of study designs and sample characteristics at infancy and early child-hood time points
a The four UK countries are England, Scotland, Wales, and Northern Ireland
b Although not designed as a nationally representative sample, analyses showed that its family income and ethnicity
composition were similar to that of the USA (NICHD Early Child Care Research Network 2000)
c Families enrolled were of higher socioeconomic status than the general Rotterdam population (Jaddoe et al. 2006)
d The final sample was compared to anonymous information provided by the health clinic on all families invited, and with
national statistics, and is representative of the targeted population except for higher education among participants
Study country UK USA Netherlands Canada Norway
Study name MCS SECCYD Generation R QLSCD BONDS
References Dex and Joshi
(2005) NICHD Early Child Care Research Network (2005)
Jaddoe et al.
(2006) Jetté and Des Groseillers (2000) Naerde et al. (2014) N at recruitment 18,819 1364 7893 2120 1157 Year(s) of chil-dren’s birth 2000–2002 1991 2002–2006 1997–1998 2006–2008 Study sites 4 UK countriesa 10 USA sites City of Rotterdam Province of
Quebec 5 South East counties Representative
sample Yes (of UK) No
b Noc Yes (of Qc) Nod Infancy Mean age (SD) in months 9.73 (.65) 5.23 (.51) 6.65 (1.04) 4.50 (.55) 6.33 (.62) N (complete data) 15,835 1249 2208 2145 1139 Ethnic minority (%) 12.6 18.7 18.6 8.5 6.2 Young mother (%) 15.9 11.5 1.5 10.5 3.3 Low income (%) 27.2 25.0 5.8 23.9 7.0 Low maternal education (%) 26.9 9.2 8.6 15.7 8.7 Single parent (%) 16.7 13.5 6.9 7.5 5.0 Other children in home (%) 58.9 58.2 39.0 58.7 58.4 Early childhood Mean age (SD) in months 37.56 (2.32) 35.77 (.94) 36.67 (1.43) 40.6 (.58) 36.23 (.67) N (complete data) 10,935 1170 3505 1887 1010 Low income (%) 27.8 24.8 7.8 16.5 5.4 Low maternal education (%) 22.5 8.7 11.1 12.6 8.1 Single parent (%) 15.2 14.9 9.1 11.6 4.5 Other children in home (%) 74.6 73.5 71.4 79.1 76.7
Maternal age (0 = not young; 1 = young)
Mothers were considered young if they were 21 years or younger when the target child was born. The proportion of young mothers was greatest in the UK and lowest in the Netherlands and Norway, consistent with previous international comparisons (OECD
2012).
Low income (0 = not low income; 1 = low income)
Low income was defined individually for each study. It was measured concurrently with ECEC measures, unless otherwise indicated. In the USA study, families were consid-ered low income if their income/USA poverty threshold ratio was in the bottom 25% of the sample. In the UK study, families were considered low income if family income was in the bottom 25% of the sample. In the Canadian study, families were considered low income if they were under the low-income threshold computed by Statistics Can-ada. This threshold takes into account geographical location and number of people in the household. In the Dutch study, families were considered low income if net house-hold income was below €1200/month, which corresponds approximately to the social security level for a married or cohabiting couple in the Netherlands. For that study, the infancy measure of income was obtained prenatally. In the Norwegian study, fam-ily income was not assessed because this was considered a sensitive matter; thus, proxy measures were used. Families were considered low income if they received social ben-efits (assessed at 6 months) or if they met at least 2 of 3 indicators of poor housing (i.e., dissatisfaction with housing, living in a one bedroom or smaller home, and not owning the home [home ownership is normative in Norway]). About one-quarter of each sample was considered to have low income, apart from the Dutch and Norwegian studies where the proportion was much lower.
Low maternal education (0 = not low; 1 = low maternal education)
Mothers’ level of education was considered low if they had not completed a level of edu-cation roughly equivalent to completing High School in the USA. Maternal eduedu-cation measures were obtained concurrently with the ECEC measures, unless otherwise indi-cated. For the USA, low education was defined as having not completed High School or the General Education Diploma (GED). In the Canadian study, low education was defined as having not received the secondary school diploma, which is typically reached at age 16 or 17. For the UK, low education was defined as having less than a General Cer-tificate of Secondary Education (GCSE) with grades D–G (i.e., foundation level), or as having left school at 16 or earlier with no qualifications. In the Dutch study, low educa-tion was defined as having not completed the two phases of High School. Phase 1 gener-ally relates to the first three years of high school (from ages 12 until 14–15 years of age). Phase 2 can last 1, 2, or 3 years depending on the level of education (practical or voca-tional training, or education leading to polytechnic or university). For the Dutch study, the measure of maternal education used for the infancy models was obtained prenatally. In the Norwegian study, mothers reported their educational level at the 6 months inter-view, with low education defined as less than 12 years of education, equivalent to not having completed a high-school degree. The proportion of mothers described as having
low education was above 20% in the UK, but lower than or around 10% in the USA, the Netherlands and Norway.
Single parenthood (0 = two‑parent family; 1 = single‑parent family)
Children living with two adults who were a couple, regardless of the couple’s marital status or biological relationship with the child, were considered living in a two-parent family. Children who lived with only one adult, regardless of the parent’s sex, were con-sidered living in a single-parent family. Family structure was measured concurrently with the ECEC measures, except in Norway, where it was available at 6 months only, and in the Netherlands, where the measure used for the infancy models was obtained during pregnancy. The proportion of single parents was greatest in the studies from the UK and USA, and lowest in the study from Norway.
Other children in household (0 = no; 1 = yes)
The presence of other children living in the household (including the target child’s twin, when applicable) was assessed concurrently with the ECEC measures, except for the Netherlands, where the measure used for the infancy models was obtained at 2 months. By early childhood, approximately three-quarters of the households in each study had more than one child.
Analyses
For the purposes of the analysis, the five study samples were merged. To avoid biasing estimates toward the studies with a larger sample size, we assigned a study weight to each individual such that the sum of weights for each study would be the same. For exam-ple, each participant from the UK with valid data for the first analysis (n = 15,835) was assigned a weight of 1000/15,835, or .0632, so that the sum of UK participants’ weights equals 1000, while each participant from the USA for the same analysis (n = 1249) was assigned a weight of 1000/1249, or .8006, so that the sum of USA participants’ weights equals 1000 as well. We did not use the studies’ sampling weights (which generally account for sampling procedure, acceptance, and attrition), because not all studies were
constructed to be representative of the population (please see Table 2 for more detail
about representativeness of each sample). The analyses are “complete cases” analyses, that is, only participants with non-missing data on both the outcome and the 6 predic-tors were included. Although we recognize that this may introduce a certain level of bias, it was not feasible, given the scope of the project (integrating the data from 5 separate longitudinal studies) to use accepted methods to deal with missing data, such as multiple imputation.
Logistic regression analyses were used to predict, separately during infancy and early childhood, (1) the regular use of ECEC (i.e., at least 9 h per week) vs. no regular use of ECEC and (2) among children in regular ECEC, the use of center-based vs. any other type of ECEC. Predictors included the study country (5 categories), the six dichotomous socioeconomic and demographic variables listed above, and the interactions between study country and each socioeconomic or demographic variable.
Following the logistic regressions, we estimated planned contrasts to test the
Results
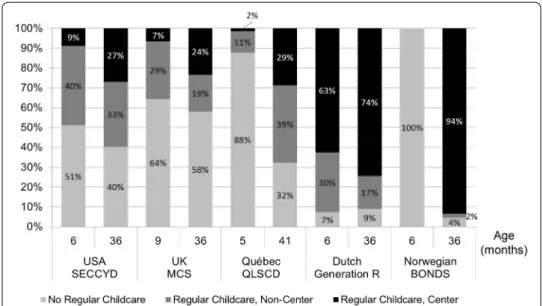
The proportion of children in ECEC (and in center- vs. non-center ECEC) is shown in
Fig. 1, by study sample and age period. These participation rates are representative of the
countries’ situations at the time, for the UK’s representative MCS sample, the Québec QLSCD sample (representative of the provincial rates), the USA SECCYD sample
(Phil-lips and Adams 2001), and the Norwegian BONDS sample (Zachrisson et al. 2013).
Par-ticipation rates observed in the Dutch Generation R sample were higher than overall Dutch rates, probably because the sample was urban and composed of families slightly
more educated than the general Dutch population (Jaddoe et al. 2006). Consistent with
previous research, the use of ECEC increased between infancy and early childhood
(Coley et al. 2014; Early and Burchinal 2001; Fuller et al. 1996), except in the
Nether-lands, where it was similarly high at both time periods. The increase was particularly dramatic in the Canadian and Norwegian studies. In every sample, center-based ECEC accounted for an increasing proportion of ECEC as the child became older.
Prediction of ECEC use
A logistic regression analysis was used to predict regular use of ECEC, from the study country, the six dichotomous socioeconomic and demographic variables, and the
coun-try × socioeconomic/demographic variable interactions. Table 3 presents the results
for the infancy model in the top panel and for the early childhood model in the bottom panel. Children from the Norwegian study were not included in the infancy model as none of them were in ECEC at this time point, and therefore the variance within the study was zero.
The first row shows the Chi square test of the country main effect and the marginal effect of being in each country compared to the average of all countries. Marginal effects are interpreted as the increase or decrease in the probability of participating in ECEC. For example, British children were 9% less likely to participate in ECEC than the average
Table 3 Results of lo gistic r egr ession f or par ticipa
tion in ECEC in infanc
y and ear ly childho od * p < .05, ** p < .01, *** p < .001. I taliciz ed mar ginal eff ec ts ar e sig nifican tly diff er en t fr om z er o a Sig nifican tly diff er en t fr om the a ver age eff ec t ( p < .05) (1) (2) (3) (4) (5) (6) (7) (8) Inf anc y (n = 21,437) Countr y E ffec ts UK USA Neth Ca n Nor Join t eff ec t of c oun tr y χ 2 (df 3) M ar ginal eff ec t of c oun tr y c ompar ed t o a ver age 4445.46*** − .09 .02 .42 − .36 n/a So cio ec onomic variables A ver age eff ec t of so cio ec onomic variable χ 2 (df 1) A ver age mar ginal eff ec t Coun tr y × so cio ec onomic In ter ac tion χ 2 (df 3) M ar ginal eff ec t separ at ely for each c oun tr y Ethnic minor ity 3.84 − .03 5.39 − .06 − .00 − .05 − .00 n/a Young mother .02 − .00 20.14*** − .07 a .01 .01 .06 a n/a Lo w income 118.18*** − .14 94.21*** − .21 a − .28 a − .05 a − .04 a n/a Lo w mat er nal education 37.39*** − .10 26.07*** − .14 a − .13 − .09 − .04 a n/a Single par ent 49.13*** .09 55.51*** .12 .27 a − .01 a − .01 a n/a O ther childr en 125.55*** − .10 234.58*** − .21 a − .15 a − .02 a − .01 a n/a Early childhood (n = 18,507) Countr y E ffec ts UK USA Neth Ca n Nor Join t eff ec t of c oun tr y χ 2 (df 4) M ar ginal eff ec t of c oun tr y c ompar ed t o a ver age 3167.17*** − .26 − .11 .17 − .03 .22 So cio ec onomic variables A ver age eff ec t of so cio ec onomic variable χ 2 (df 1) A ver age mar ginal eff ec t Coun tr y × so cio ec onomic in ter ac tion χ 2 (df 4) M ar ginal eff ec t separ at ely for each c oun tr y Ethnic minor ity 1.50 − .02 3.51 − .01 − .06 .00 .01 − .03 Young mother 6.01* − .04 10.40* − .06 .02 − .06 a − .11 a .01 Lo w income 147.22*** − .19 11.29* − .22 − .25 − .14 − .25 − .09 a Lo w mat er nal education 78.83*** − .15 1.39 − .16 − .20 − .14 − .15 − .11 Single par ent 94.75*** .11 37.48*** .11 .25 a .06 a .13 − .01 a O ther childr en 204.31*** − .12 175.61*** − .20 a − .21 a − .02 a − .17 a − .01 a
in infancy, and 26% less likely to do so in early childhood. Starting in the second row, we present the test of main effect for each socioeconomic/demographic variable (in the first column), and its average marginal effect (in the second column). These average effects were very similar across infancy and early childhood: low family income, low maternal education, and the presence of other children in the home decreased the likelihood of ECEC, while single parenthood increased it. Being part of an ethnic minority was not associated with ECEC participation at either time point. Mothers’ young age was associ-ated with slightly lower ECEC use in early childhood only.
These effects were qualified by significant country × socioeconomic/demographic var-iable interactions, as shown in column 3. To help interpret these interactions, we report the marginal effect of the socioeconomic/demographic variable separately for each country. In infancy, a greater number of selection effects, and larger ones, were found in the UK and the USA than in the Netherlands and Canada. For example, families with low income were 21 and 28% less likely to use ECEC in the UK and USA, respectively, and only 5 and 4% less likely to do so in the Netherlands and Canada, respectively. In early childhood, more and larger socioeconomic selection effects were found in the UK, the USA, and Canada than in the Netherlands and Norway. For example, families with other children in the home were between 17 and 21% less likely to use ECEC in the UK, the USA, and Canada, but only 1 or 2% less likely to do so in Norway and the Netherlands.
Prediction of center vs. non‑center ECEC use
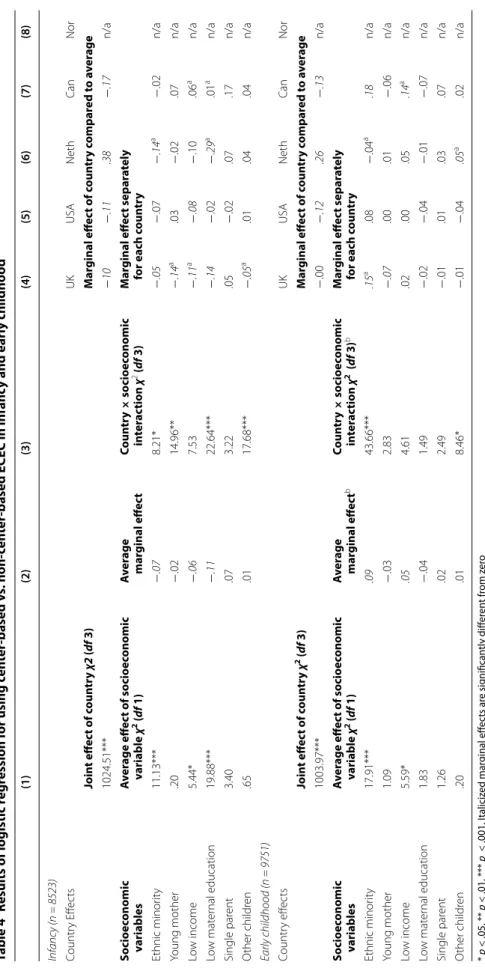
For children involved in regular ECEC (i.e., at least 9 h per week), a logistic regression analysis was used to predict participation in center-based vs. non center-based ECEC, in infancy and early childhood. Predictors were the study country, the six dichotomous socioeconomic/demographic variables, and the country × socioeconomic/demographic
variable interactions. Table 4 presents the results for the infancy model in the top panel
and for the early childhood model in the bottom panel. Again, children from the Norwe-gian study were not included in the infancy analysis as none of them were in regular ECEC at this time. In addition, they were also excluded from the early childhood analysis as almost all of them were in center-based settings (98%) at this time point, resulting in some empty cells, e.g., no Norwegian children were in non-center-based settings and
had a young mother, or lived with a single parent.1
The first row in Table 4 shows the Chi square test of the country main effect and
the marginal effect of being in each country compared to the average of all countries. Starting in the second row, we present the test of main effect for each socioeconomic/ demographic variable (in the first column), and its average marginal effect (in the sec-ond column). In general, few socioeconomic selection effects were found in predict-ing the use of center- vs. non-center-based services, and the effects often varied across countries. In infancy, more and larger socioeconomic selection effects were found in the UK and the Netherlands than in the other countries. In early childhood, much fewer selection effects were observed, and many were in the positive direction. For instance, young children from an ethnic minority were 15 to 18% more likely than children from
1 A logistic regression with the Norwegian sample only, using the other four socioeconomic predictors, showed that
Table 4 Results of lo gistic r egr ession f or using c en ter-based v s. non-cen
ter-based ECEC in infanc
y and ear ly childho od * p < .05, ** p < .01, *** p < .001. I taliciz ed mar ginal eff ec ts ar e sig nifican tly diff er en t fr om z er o a Sig nifican tly diff er en t fr om the a ver age eff ec t ( p < .05) b Ex cluding Nor w ay (1) (2) (3) (4) (5) (6) (7) (8) Inf anc y (n = 8523) Countr y E ffec ts UK USA Neth Ca n Nor Join t eff ec t of c oun tr y χ2 (df 3) M ar ginal eff ec t of c oun tr y c ompar ed t o a ver age 1024.51*** − 10 − .11 .38 − .17 n/a So cio ec onomic variables A ver age eff ec t of so cio ec onomic variable χ 2 (df 1) A ver age mar ginal eff ec t Coun tr y × so cio ec onomic in ter ac tion χ 2 (df 3) M ar ginal eff ec t separ at ely for each c oun tr y Ethnic minor ity 11.13*** − .07 8.21* − .05 − .07 − .14 a − .02 n/a Young mother .20 − .02 14.96** − .14 a .03 − .02 .07 n/a Lo w income 5.44* − .06 7.53 − .11 a − .08 − .10 .06 a n/a Lo w mat er nal education 19.88*** − .11 22.64*** − .14 − .02 − .29 a .01 a n/a Single par ent 3.40 .07 3.22 .05 − .02 .07 .17 n/a O ther childr en .65 .01 17.68*** − .05 a .01 .04 .04 n/a Early childhood (n = 9751) Countr y eff ec ts UK USA Neth Ca n Nor Join t eff ec t of c oun tr y χ 2 (df 3) M ar ginal eff ec t of c oun tr y c ompar ed t o a ver age 1003.97*** − .00 − .12 .26 − .13 n/a So cio ec onomic variables A ver age eff ec t of so cio ec onomic variable χ 2 (df 1) A ver age mar ginal eff ec t b Coun tr y × so cio ec onomic in ter ac tion χ 2 ( df 3) b M ar ginal eff ec t separ at ely for each c oun tr y Ethnic minor ity 17.91*** .09 43.66*** .15 a .08 − .04 a .18 n/a Young mother 1.09 − .03 2.83 − .07 .00 .01 − .06 n/a Lo w income 5.59* .05 4.61 .02 .00 .05 .14 a n/a Lo w mat er nal education 1.83 − .04 1.49 − .02 − .04 − .01 − .07 n/a Single par ent 1.26 .02 2.49 − .01 .01 .03 .07 n/a O ther childr en .20 .01 8.46* − .01 − .04 .05 a .02 n/a
the ethnic majority to be in center-based care than other types of settings in the UK and Canada. Children of low-income families were 5% more likely than those of other fami-lies to be in center-based care than other types of settings overall, but even more so in Canada (14%). Finally, when there were other children in the household, young children from the Netherlands were 5% more likely to be in center-based care than non-center-based ECEC.
Planned policy‑based contrasts
We next ran planned contrasts to test how specific policy elements (see Table 1) were
associated with ECEC use. Countries with at least 6 months’ paid maternity/parental leave had a 55% lower ECEC use in infancy (with 95% confidence interval ranging from
54 to 56%, χ2(1) = 6318.60, p < .001),2 but a 16% [14, 18%] higher ECEC use in early
childhood (χ2(1) = 262.64, p < .001), compared to the other countries. The public
sub-sidy of at least part-time universal ECEC in early childhood was associated with a 13%
[10, 16%] higher participation rate (χ2(1) = 76.05, p < .001). In countries with public
sub-sidies specifically for center-based universal ECEC, children who participated in ECEC
were 36% more likely [33, 38%] to be in center-based settings (χ2(1) = 756.05, p < .001)
than children using ECEC in other countries.3
The contrasts also showed that selection based on low income was reduced by 8%
[0, 16%] (χ2(1) = 3.88, p = .049) in countries with at least part-time publically
subsi-dized universal ECEC in early childhood. In countries where universal subsidies were accompanied with reduced out-of-pocket contributions for low-income families, it
was reduced by 11% [4, 17%] (χ2(1) = 8.91, p = .003) in infancy2 and by 7% [2, 13%]
(χ2(1) = 6.25, p = .012) in early childhood. Selection based on having other children
in the household was smaller in countries where universal subsidies were accompanied
with reduced fees for subsequent children, by 10% [7, 13%] in infancy2 (χ2(1) = 39.95,
p < .001) and 18% [15, 21%] in early childhood (χ2(1) = 133.62, p < .001). Mandatory employment for welfare recipient parents by age 3 years, which was in place in the USA and Norway, was not significantly associated with higher participation in ECEC for
chil-dren of single parents (χ2(1) = .70, p > .40).
Finally, we tested how ECEC participation and socioeconomic selection in Norway, which spends more than 1% GDP in services for children ages 0–6 years, differed from those in the other four countries. The ECEC participation of young children was 27%
[24, 29%] higher in Norway (χ2(1) = 448.25, p < .001) than in the other four countries, in
early childhood. Selection effects were decreased by 7% [1, 12%] for families with young
mothers (χ2(1) = 6.14, p = .01), by 12% [3, 21%] for low-income families (χ2(1) = 6.53,
p = .01), by 14% [8, 21%] for single-parent families (χ2(1) = 21.51, p < .001) and by 14%
[11, 17%] for families with other children in the household (χ2(1) = 68.18, p < .001),
but there were no differences for children of mothers with low education (χ2(1) = 1.44,
p > .20).
2 To compute this analysis with the inclusion of the Norway study, the Canadian and Norwegian samples were merged
together to avoid collinearity problems due to the absence of variation in Norway.
3 To compute this analysis with the inclusion of the Norway study, the UK and Norwegian samples were merged
Discussion
This study combined data from five large cohorts of children from five different coun-tries to compare participation rates and socioeconomic selection into ECEC across different policy contexts. We found important differences across policy contexts in par-ticipation rates and the extent to which they were affected by socioeconomic selection, in both infancy (5–9 months) and early childhood (36–41 months). Among children who participated in ECEC, we also found important differences across policy contexts in the proportion attending center-based vs. non-center-based services; however, this was less subject to socioeconomic selection. Planned country contrasts showed significant associations between specific policy elements and patterns of ECEC use. Our discussion highlights how these policy elements, as well as other aspects of individual countries’ policy contexts, may explain participation in ECEC (and center-based vs. other types of ECEC services), socioeconomic selection into ECEC, and socioeconomic selection into center-based vs. other types of ECEC services.
Participation in ECEC services
During infancy, children in Canada and Norway, whose parents could benefit from paid maternity or parental leave, were less likely than those from other countries to partici-pate in ECEC. Once they reached early childhood, however, those children were more likely to attend ECEC, supporting the idea that paid leave does not compromise parents’
attachment to the job market in the longer term (Han et al. 2009). In Norway, in addition
to the 42- to 52-week paid parental leave for working parents, a lump sum was provided to non-working mothers. Together, these policies likely explain why none of the children in the Norwegian study were in ECEC at 6 months of age.
In the early childhood period, children whose countries subsidized at least part-time universal ECEC services were more likely to attend ECEC than children in the USA, where subsidies were targeted at lower-income families only. The UK’s participation rate remained low at both time points, probably because children only became entitled to the free, part-time services in the term after they turned 3 years, which for many children would have been later than our 3-year-old assessment. Except for the Netherlands (with subsidies for private day-care centers), none of the countries studied subsidized ECEC services for children under the age of one, which may explain the general increase in service use between the infancy and early childhood periods. Among young children in ECEC, participation in center-based rather than non-center-based settings was higher in countries where universal subsidies were provided specifically for center-based services. These findings are consistent with studies showing increased participation when
univer-sal subsidies are introduced (Baker et al. 2008; Fitzpatrick 2010).
Our findings illustrate that universal subsidies do not guarantee full participation rates
(Stewart et al. 2014). The supply of ECEC places is also important. The highest
participa-tion rate in early childhood was found in Norway, where, in addiparticipa-tion to generous uni-versal subsidies, policies aimed at providing all children one year and older a place in ECEC. In contrast, in Canada (Québec), subsidized places were limited and insufficient to meet the demand. Norway also had the highest proportion of women in the work-force among the countries studied (76.0% across the study years). However, we do not think that female workforce participation alone could explain the differences in ECEC
participation, since the other four countries showed widely varying ECEC participation rates despite very similar rates of women in the workforce (ranging from an average of 68.5–69.6% across the study years; OECD database).
After Norway, the Netherlands had the highest rates of ECEC participation. In addi-tion to universal public subsidies for part-time ECEC (playgroups), the Netherlands’ system had employers contribute to the cost of ECEC for their workers’ children, and had facilitating conditions for part-time work, which was very popular among Dutch families. In combination with a short maternity leave, this policy and cultural context may explain why Dutch children have among the highest levels of ECEC participation in
infancy (Mills et al. 2014). The level of participation observed in the Dutch Generation R
sample was even higher than overall Dutch rates, probably because it was composed of families living in urban areas (Rotterdam) and who were slightly more educated than the
general Dutch population (Jaddoe et al. 2006).
To some extent, levels of participation were related to estimates of parents’ out-of-pocket cost for ECEC. For instance, the UK and the USA rank highest among the five countries studied in terms of net cost for full-time, center-based ECEC, for a family with two parents earning average wages, after taking into account the various forms of
government assistance (Bradshaw and Finch 2002; Immervoll and Barber 2006). Costs
are also high in the Netherlands, yet since a large proportion of Dutch families avail of ECEC services only part-time, more of their children are exposed to regular ECEC than would be predicted by these cost estimates alone.
Socioeconomic selection into ECEC
In line with prior studies, infants and young children were overall less likely to attend regular ECEC if their family had low income, low maternal education, and other
chil-dren in the home (Borge et al. 2004; Early and Burchinal 2001; Geoffroy et al. 2012;
Singer et al. 1998; van Gameren and Ooms 2009). These findings are consistent with the
hypothesis that parents make a simultaneous decision about entering employment and using ECEC based on their potential income and the total cost of ECEC for their chil-dren. We found that, all other socioeconomic factors being equal, children of single par-ents were often more likely to attend ECEC.
Selection on the basis of low income and having other children in the family was attenuated where universal subsidies were in place and fees were scaled as a function of income and number of children (i.e., in Norway and the Netherlands). More gener-ally, weaker selection effects were found in samples where children were more homoge-nous regarding ECEC participation (the Netherlands in infancy and early childhood, and Norway in early childhood) or non-participation (Canada and Norway in infancy). The high level of homogeneity found in Norwegian families’ patterns of ECEC use may be due to a combination of cultural and policy factors. In terms of policy factors, Norway was the only country where public expenditures for children 0–6 years old were above 1% of GDP. Included in these expenditures were a well-paid maternity and parental leave for working parents and generous assistance for single parents and parents opting out of subsidized ECEC. In addition, the Norwegian policy context provided ECEC places for most or all children aged 1 year and older (somewhat varying across municipalities), regardless of parental employment status, with fees adjusted as a function of income and
number of children, and capped at a small amount (equivalent to USD 300/month in 2006).
Despite these variations in selection effects, none of the five countries studied, with the combination of policies they had in place, were able to completely close the gap in ECEC participation between families with low and high socioeconomic status (SES; i.e., mater-nal education and family income). The only exception was in the Netherlands, where low-income children were as likely to be in ECEC as their higher-income peers, but only during infancy. The persistence of the SES gap may be explained by different factors. First, some of the ECEC subsidies (all of them in the USA) were only available to
work-ing parents (Stewart et al. 2014). Second, the availability of subsidized ECEC was often
insufficient (as in Canada and the UK), a situation that tends to favor higher-SES families
who are typically more informed and better able to secure places (Speight et al. 2010).
Third, parents with lower education have more difficulty finding work (or work that pays enough to offset the cost of ECEC), thus reducing their demand for ECEC. Finally, there may be a preference among families of lower SES for caring for their children them-selves. The results for the Norwegian sample support this notion. In Norway, the usual barriers for low-SES families were reduced to a minimum: non-working parents had access to subsidized ECEC and the costs were income-adjusted and could be completely waived for the lowest-income families. Yet, selection of families based on low income and low maternal education remained. Importantly, parents in Norway could receive an allowance to care for their children at home up until age 3 years, after which they could still benefit from the country’s generous system of social assistance (Bradshaw and Finch
2002). Our results suggest that, given these two financially viable options, lower-SES
families may choose to take care of their own children, either because their employment opportunities are few and uninteresting in comparison, or because of personal values
about child-care (Ellingsaeter 2014). Additional studies are needed to understand the
role of cultural effects (specific to families from ethnic minorities or low socioeconomic backgrounds) on child care decisions.
Time limits on welfare for single parents (1 year in the USA and three years in Norway) did not, on their own, seem to increase single parents’ use of ECEC. The positive selec-tion effect of single parenthood was clearest in the USA, possibly because the country’s tax-benefit system creates very strong incentives for single parents to take up
employ-ment (Bradshaw and Finch 2002; Immervoll and Barber 2006). This effect was not found
in Norway, possibly because work incentives were not as strong, or because the overall rate of ECEC use was already very high for 3-year-old children.
The SES-related gap in ECEC participation is cause for concern at least for Canada, the UK, the USA, and Norway, where studies have found children of lower-SES families to benefit the most from ECEC or maternal employment, in terms of their cognitive,
behavioral, language, and academic development (Côté et al. 2007, 2013; Geoffroy et al.
2007, 2010; Goldberg et al. 2008; Lucas-Thompson et al. 2010; Zachrisson and Dearing
2015). Our results would indicate that governments should concentrate on reducing the
barriers for low-income or low-educated parents who wish to use ECEC, e.g., by making subsidies accessible to unemployed parents, more transparent, and directly payable to
service providers (Stewart et al. 2014). Our findings also suggest that a small proportion
opportunity to do so; therefore, alternative ways to enhance their children’s early devel-opment must be used.
Socioeconomic selection into center‑ vs. non‑center ECEC settings
Among ECEC users, the use of center-based vs. other types of ECEC was less subject to selection (as compared to the selection into using versus not using ECEC). Selection effects were found more often in infancy than early childhood, perhaps because lower
staff-to-child ratios imply greater costs for infants in center-based ECEC (OECD 2007)
and fewer places available. High costs may discourage both private supply and public funding of services before age 1 year. Selection effects in center-based care were most important for infants in the UK and the Netherlands. In the Netherlands, results are sug-gestive of a cultural effect, with infants from ethnic minorities and parents with lower education being less likely to attend center-based ECEC than other types of care.
In early childhood, some of the selection effects were reversed, with typically under-served populations being more likely to use center-based services. Young children from an ethnic minority group (in the UK and Canada), and from low-income families (in Canada) were more likely than their peers to be in center-based care than other types of settings. This is encouraging since the clearest benefits of ECEC have been found
in center-based settings (Côté et al. 2013; NICHD Early Child Care Research Network
2000). Nevertheless, the overall rates of center-based ECEC use were low in the USA,
UK and Canada, compared to the Netherlands and Norway. Therefore, in those coun-tries, more efforts could be made to increase the absolute number of disadvantaged chil-dren attending center-based ECEC.
Limitations
The main limitation of the study is its descriptive nature. We cannot infer that the policy elements observed caused the different participation rates or selection effects. Another limitation is that, because countries constantly adopt and amend policies, our results should not be taken as a current portrait of the five countries studied. Rather, they pro-vide broader information about what policies are associated with what patterns of ECEC use. Finally, the scope of our cross-country study did not allow for the measurement of the quality of ECEC services, an important factor to consider when deciding whether it is desirable for more children to be involved in ECEC. This may be especially important regarding ECEC services for infants, for whom it is less clear that participation in ECEC services in general, and in center-based services in particular, is beneficial or desired by parents. The question of access to quality ECEC for disadvantaged children is addressed
elsewhere on a country-by-country basis (Gambaro et al. 2014b). Future work can build
on our comparative approach to draw direct comparisons on matters of quality.
Conclusions
This is, to our knowledge, the first study using integrated data from multiple countries to compare participation rates and socioeconomic selection into ECEC across policy con-texts. The five countries were all western, developed countries, but varied in their spe-cific policies for children and families. Our results show important differences in ECEC patterns of use across countries and point to policy elements that are associated with