Therapeutic Drug Monitoring of Azathioprine and 6-Mercaptopurine
Metabolites in Crohn Disease
J. Belaiche, J. P. Desager, Y. Horsmans & E. Louis
Service de gastroentérologie, CHU Sart-Tilman, Liège; Laboratoire de Pharmacothérapie, Cliniques Universitaires Saint Luc, Bruxelles; and Laboratoire de Gastroentérologie, Cliniques Universitaires Saint Luc, Bruxelles; Belgium
Background: 6-Mercaptopurine (6-MP) and its prodrug azathioprine (AZA) have proven efficacy in the treatment of Crohn disease (CD). The immunosuppressive properties of AZA/6-MP are mediated by the intracellular metabolism of MP into its active metabolites, thioguanine nucleotides (6TGN) and 6-methylmercaptopurine (6-MMP). Preliminary studies have suggested that the red blood cell concentration of 6TGN (RBC 6TGN) is a potential guide to therapy. The aims of the study were to evaluate the RBC 6TGN concentrations in adult patients with CD under long-term AZA/6-MP therapy and to correlate it with response to treatment and haematological parameters.
Methods: Twenty-eight CD patients treated for at least 3 months with AZA/6-MP were prospectively studied. Patients were separated into three main groups: group 1 (n = 19), corresponding to quiescent CD receiving AZA (dose: 2.05 ± 0.4 mg/kg/day for a mean of 28.6 ± 25 months) or 6-MP (dose: 1.4 ± 01 mg/kg/day for a mean of 7.5 ± 3.5 months) alone; group 2 (n = 6), corresponding to quiescent CD treated by AZA (dose: 2.14 ± 0.5 mg/kg/day for a mean of 29.5 ± 22 months) with oral steroids; and group 3 (n = 3), corresponding to active CD on AZA (dose: 1.94 ± 0.6 mg/kg/day for a mean of 31.3 ± 35 months) as the only treatment. An assessment was also made by merging groups 1 and 2 forming a larger group of patients (n = 25) defined by clinical remission and groups 2 and 3 forming a larger group of patients (n = 9), non-complete responders with AZA/6-MP alone. Crohn disease index activity (CDAI), blood samples for full blood count and differential white cell count and measurement of RBC 6TGN and 6-MMP concentrations were evaluated at inclusion and at 6 months (n = 17). RBC 6TGN were measured using high performance liquid chromatography (HPLC) on heparinized blood. Results: The baseline characteristics of the three groups of patients were similar. There was no significant difference among the three groups of patients regarding the dose and the duration of immunosuppressive treatment. There was no significant difference between groups according to various parameters tested.
Particularly, the median RBC 6TGN concentration at inclusion was similar in the three groups of patients (166 (105-688), 183 (90-261) and 160 (52-194) pmol/8 × 108 RBC, respectively). The majority of patients had no detectable level of 6-MMP metabolite, except for 3 patients. There was also no difference between merging groups. Furthermore, there was no significant correlation between RBC 6TGN concentrations and the various biological parameters tested except for the mean erythrocyte volume. At 6 months, all patients of group 1 remained in remission and median RBC 6TGN concentration remained stable. No side effects were observed. Conclusions: There is, contrary to preliminary studies, a broad overlap in RBC 6TGN levels as well as for haematological parameters in patients in remission or not and responders or not to AZA/6-MP therapy. This suggests, beside a variability in the metabolism of these drugs, the existence of complex mechanisms of action. Nevertheless, beside the use of RBC 6TGN determination to confirm compliance to therapy, this dosage could be useful in non-responding patients, allowing, in absence of leukopenia, to increase the dose of AZA/6-MP safely.
Keywords : Azathioprine ; Crohn disease ; 6-mercaptopurine ; metabolism ; monitoring
6-Mercaptopurine (6-MP) and its prodrug azathioprine (AZA) have proven efficacy in the treatment of Crohn disease (CD). A meta-analysis of all placebo-controlled trials of AZA/ 6-MP treatment for CD reported overall response rates of 56% and 67% for treatment of active disease and remission maintenance indications (1). These drugs have now been recognized as having a major role in the treatment of steroid dependent CD, eliminating the need for corticosteroids in about 75% of patients, with a median response time of 3-4 months (2, 3).
Furthermore, these immunosuppressants have also been shown to improve the quality of life (4). However, potential complications of treatment occur in 15% of patients (5). Moreover, 25%-35% of the patients do not respond to AZA/6-MP treatment even after several months, raising the possibility that altered drug metabolism effects efficacy. Therapeutic drug monitoring during treatment with AZA/6-MP has the potential to address these problems. The immunosuppressive properties of AZA/6-MP are considered to be mediated mainly by the intracellular metabolism into its active 6-thioguanine nucleotides (6TGN) (5). 6TGN have a long half-life resulting in slow accumulation in red blood cells (RBCs) and other body tissues and the need for prolonged treatment to reach steady-state levels. These metabolites seem thus to be appropriate candidates for such monitoring. However in CD, only a recently published paper in paediatric series of CD indicates that monitoring based on red blood cell concentration of 6TGN (RBC 6TGN) is a potential guide to therapy (6).
The aim of this study was to evaluate the RBC 6TGN concentrations in adult patients with CD on long-term therapy with AZA or 6-MP and to correlate it with response to treatment and haematological parameters. Patients and Methods
Patients
The study was performed between March 1999 and December 1999. The study design is shown in Fig. 1. Eligible patients were all patients with CD seen during this period and treated for at least 3 months by AZA/6-MP. Twenty-eight patients with CD (19 females, 9 males), mean age 37 years (range, 24-58), were included in this study. The diagnosis of CD was made using the clinical, morphological and histological criteria of Gower-Rousseau et al. (7). The reason for immunosuppressive treatment had been in all cases corticosteroid dependent CD, except in 2 patients with an early severe postoperative recurrence. The corticosteroid dependency was defined as previously reported (8), either by two successive relapses during the 2 months following steroid discontinuation, or by two successive relapses at dose tapering after successful treatment of flare-up with steroids. The activity of CD was determined at inclusion by the Crohn Disease Activity Index (CDAI). Twenty-five patients had quiescent CD (CDAI < 150) and 3 patients had active disease (CDAI: median score, 210; range, 200-395) despite immunosuppressive treatment. The patients were separated into three main groups at inclusion (Table I). Patients with quiescent CD were separated into two groups: group 1 corresponding to 19 patients treated with AZA (n = 17) or 6-MP (n = 2) as the only treatment; group 2 corresponding to 6 patients treated by AZA and methylprednisolone (mean dose: 13 mg/day ± 10). Group 3 included the 3 patients with active symptomatic CD. These 3 patients were on AZA as the only treatment. The baseline characteristics of the three groups of patients are summarized in Table II. An assessment was also made by merging groups 1 and 2, forming a larger group of patients (n = 25) defined by clinical remission, and groups 2 and 3, forming a larger group of patients (n = 9), non-complete responders with AZA or 6-MP alone (Table I).
Fig. 1. Design of the study.
Table I. Definition of the groups of patients at inclusion
Group 1 Quiescent CD with AZA/6-MP alone (complete responders) Group 2 Quiescent CD with AZA + oral steroids
Group 3 Active CD under AZA as only treatment Group 1 + 2 Patients in clinical remission
Group 2 + 3 Non-complete responders with AZA alone
count and measurement of RBC 6TGN concentrations. The total RBC 6TGN concentration measurement was based on the conversion of 6TGN to the free 6-thioguanine base, assayed by high performance liquid
chromatography (HPLC) on heparinized blood according to the method of Lennard & Singleton (9). Two quality control samples at 119 and 299 pmol/8 × 108 were analysed during each run. The intra-day coefficients of variation were 4.1% (110 ± 4.6pmol/ 8 × 10⁸ RBCs) and 4.5% (304 ± 13.7 pmol/8 × 108 RBCs), respectively, for n = 6. The interday coefficients of variation were 8% (120 ± 9.5 pmol/8 × 108 RBCs) and 6.9% (300 ± 20.8 pmol/8 × 108 RBCs), respectively, for n = 17. The sensitivity for 6TGN reached 5 pmol/8 × 108 RBCs. The '6-methymercaptopurine like' (6-MMP) metabolite was detected on the same chromatogram with a sensitivity of 1 nmol/8 × 108 RBCs.
The assessment was performed firstly by comparing RBC 6TGN concentrations and haematological parameters between groups. Secondly, according to previous published RBC 6TGN data, we tried to validate a discriminant RBC 6TGN level by comparing the response to treatment in subgroups of patients divided according to the RBC 6TGN levels (230 pmol/8 × 108 RBCs (10), 250 pmol/8 × 108 RBCs (11)).
Seventeen patients of 28 included (group 1 = 10; group 2 = 4; group 3 = 3) were re-evaluated at 6 months for disease activity and RBC 6TGN concentrations.
Statistical analysis
Comparative statistics were carried out using Student t test or Mann-Whitney U test as appropriate. Correlations between the various parameters were assessed by Spearman test. Values of P < 0.05 were considered to indicate statistical significance.
Results
The baseline characteristics of the three patient groups were similar (Table II). There was no significant difference among the three groups of patients regarding the dose and duration of immunosuppressive treatment. There was no significant difference between groups according to various parameters tested (Table III).
Particularly, the median RBC 6TGN concentrations at inclusion are similar in the three groups of patients. There was also no difference between group 1 and group 2 + 3 (166 pmol/ 8 × 10⁸ RBCs (range, 105-688) and 167 pmol/8 × 108 RBCs (range, 52-261), respectively), and between group 1 + 2 and group 3 (167 pmol/8 × 108 RBCs (range, 90-688) and 160 pmol/8 × 108 RBCs (range, 52-194), respectively). Furthermore, there was no significant correlation between RBC 6TGN concentrations and the various biological parameters tested except for the mean erythrocyte volume (MCV) which was higher in patients on AZA (Table IV).
The number of patients having a RBC 6TGN level higher than the two discriminant levels proposed in the literature were 6 and 8 for 250 and 230 pmol/8 × 108 RBCs, respectively. The proportion of patients as complete or non-complete responders on AZA/6-MP, according to these discriminant levels, are shown in Table V. No significant differences were found between patients above or below the discriminant levels. A low level of 6-MMP was noted in 2 patients of group 1 and 1 patient of group 2 (8.5, 6.0, and 4.2 nmol/8 × 108 RBCs, respectively).
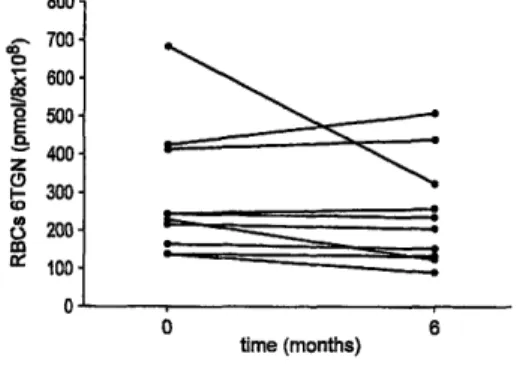
At 6 months, all patients in group 1 (n = 10) remained in remission (CDAI < 150) with no modification (except 1 patient, see below) of AZA/6-MP therapy. RBC 6TGN levels remained relatively stable except in the patient with the highest concentration at inclusion (688 pmol/8 × 108 RBCs) in whom the dose of AZA had to be decreased (Fig. 2). The median (range) coefficient of variation over this 6-month period was 4% (3.6%-40.7%). In group 2 (n = 4), 1 patient had a flare-up at 5 months. At this time the level of RBC 6TGN concentration had decreased from 235 to 103 pmol/ 8 × 10⁸ RBCs, despite the absence of treatment modification. The other patients were still in remission with the same dose of AZA and 2 of them were weaned from steroids (Table VI). The follow up of the 3 patients in group 3 is shown on Table VΠ. No side effects were observed.
Fig. 2. RBC 6TGN concentrations at inclusion and at 6 months in quiescent CD treated by AZA/6-MP alone (patients n = 10 of group 1). The RBC 6TGN levels remained relatively stable. The median (range) coefficient of variation over this 6 months period was 4% (3.6%-40.7%).
Table II. Baseline characteristics of the patients at inclusion
Variable Group 1 (n = 19) Group 2 (n = 6) Group 3 (n = 3)
Sex (M/F) 4/15 1/5 0/3
Age at entry (years) (mean ± s, range) 36.8 ± 10.4 (24-58) 43.6 ± 8.5 (37-58) 32 ± 3.5 (30-36) Duration of disease (years) (mean ± s, range) 10.2 ± 5.9 (1-23) 12.6 ± 7.7 (2-22) 10.6 ± 2 (9-13) Duration of remission (months) (median, range) 10 (2-84) 7.5 (3-24) NA Disease site (no. of patients)
Ileum 2
Ileocolon 10 1 2
Colon 7 5 1
Azathioprine*
Duration (months) (mean ± s, range) 28.6 ± 25 (3-84) 29.5 ± 22 (3-60) 31.3 ± 35 (5-72) Dose (mg/kg/day) (mean ± s, range) 2.05 ± 0.4 (1.35-2.8) 2.14 ± 0.5 (1.5-3) 1.94 ± 0.6 (1.88-2) 6-MP†
Duration (months) (mean ± s, range) 7.5 ± 3.5 (5-10) Dose (mg/kg/day) (mean ± s, range) 1.4 ± 0.1 (1.35-1.5) NA = not applicable.
* n =17 † n = 2
Table III. Biological profiles of the patients at inclusion
Variable Group 1 (n = 19) Group 2 (n = 6) Group 3 (n = 3)
RBC 6TGN (pmol/8 × 108 RBCs) (median, range) 166 (105-688) 183 (90-261) 160 (52-194) MCV (µ3) (mean ± s, range) 93 ± 8 (74-104) 96 ± 3.5 (90-100) 83 ± 7 (77-91) Leukocyte count (× 103/ml) (mean ± s, range) 6.4 ± 1.81 (3.34-9.17) 9.6 ± 2.7 (5.9-10.3) 5.9 ± 0.8 (5.1-6.7) Neutrophils count (× 103/ml) (mean ± s, range) 4.6 ± 1.1 (2.2-7.7) 7.1 ± 1.5 (5.1-8.6) 4.3 ± 1.1 (3.0-5.2) Relative neutrophilia (%) (mean ± s, range) 67 ± 15 (15-84) 74 ±b7.5 (66-84) 71.5 ± 15 (59-78) Lymphocyte count (×103 /ml) (mean ± s, range) 10.8 ± 4.5 (6-22) 15.6 ± 5 (10-22) 9 ± 3.5 (5-11) Relative lymphocytosis (%) (mean ± s, range) 17.8 ± 7.7 (6.2-33.8) 16 ± 5.6 (9.0-21) 15.9 ± 6.9 (8.7-22.5) Study variables
Table IV. Correlations (r) between RBC 6TGN concentrations, treatment and haematological parameters at inclusion
Variable r P
AZA/6-MP dose (mg/kg/day) 0.020 0.917
AZA/6-MP duration 0.060 0.758
Leukocyte count 0.243 0.241
Relative neutrophilia 0.168 0.42
Lymphocyte count -0.029 0.889
Relative lymphocytosis -0.332 0.104
MCV 0.375 0.048
Table V. Proportion of patient responders and non-complete responders according to the two RBC 6TGN discriminant levels proposed in the literature (10, 11)
Patients RBC 6TGN > 250 pmol/8 × 108 RBCs RBC 6TGN < 250 pmol/8 × 108 RBCs RBC 6TGN > 230 pmol/8 × 108 RBCs RBC 6TGN < 230 pmol/8 × 108 RBCs Complete responders (group 1 = 19) 5/6 14/22 6/8 13/20 Non-complete responders (group 2 + 3 = 9) 1/6 8/22 2/8 7/20
Table VI. Follow up at 6 months for patients of group 2 Patient RBC 6TGN at inclusion
(pmol/8 × 108)
RBC 6TGN at 6 months (pmol/8 × 108)
Comments
MB 261 190 Steroid withdrawal at 3 months
JPL 235 NA* Flare-up at 5 months treated by anti-TNF
LP 200 224 Steroid withdrawal at 2 months
ND 100 139 Quiescent CD with same dose of steroid
* Not available (RBC 6TGN at time of flare-up (5 months): 103 pmol/8 × 108).
Table VII. Follow up at 6 months for patients of group 3 Patient RBC 6TGN (pmol/8 × 108 RBCs) at inclusion RBC 6TGN (pmol/8 × 108 RBCs) at 6 months Comments
HT 52 200 AZA increased from 1.8 to 2.5 mg/kg/day and
ciprofloxacin added at inclusion. In remission 2 months later with AZA alone
NP 160 95 AZA increased from 2.5 to 3 mg/kg/day and oral
budesonide added at inclusion. In remission 6 months later with AZA alone
JF 194 235 AZA increased from 1.6 to 2 mg/kg/day and
methylprednisolone added at inclusion. In remission 6 months later with AZA alone
Discussion
We evaluated in the present study the monitoring of long-term treatment with AZA/6-MP by RBC 6TGN concentrations in patients with CD. The data showed a broad overlap in RBC 6TGN concentrations as well as haematological parameters in patients in remission or not and responders or not to AZA/6-MP. Accordingly, in this relatively small population, we could not confirm the previously proposed discriminant RBC 6TGN levels between responders and non-responders to AZA/6-MP.
AZA/6-MP are immunosuppressive drugs that are effective in the treatment of inflammatory bowel disease. These drugs have now been recognized as major drugs in the treatment of steroid dependent and chronic active CD. A recently published meta-analysis of the therapeutic trials of AZA in CD showed a significant efficacy both in active disease and in maintenance of remission (1). In these two situations, the efficacy correlated with the cumulative dose administered, depending on the dose and duration of the treatment. When using an
appropriate dose, which is at least 2 mg/kg/day for AZA and 1.5 mg/kg/day for 6-MP, and waiting enough time for judgement of efficacy (at least 3-4 months), 60%-70% of patients show a significant clinical response while 25%-35% of patients do not respond even after several months. In a recent pilot study of 18 non-responders after
a mean time of 11 months at a mean dose of 2 mg/kg/day, the increase of AZA to 2.5-3 mg/kg/day brought up a significant clinical response in 78% of the patients (12). In that study, the increase in AZA dosage was decided empirically, simply checking that it was not associated with major leukopenia. A previous study with 6-MP in refractory CD had showed that the clinical response correlated with the development of a relative leukopenia and neutropenia (below 5000 leukocytes/ ml) (13). However, in another well-conducted recent prospective study, this correlation was not confirmed (14). Furthermore, the concentration of 6-MP itself seems to be of no value in monitoring the treatment, probably because this substance is inactive and has a very short half-life (1-2 h) in plasma (15). The considerable variability in optimal dosage of 6-MP is probably related to the large variability in its metabolization by the three major pathways. After rapid non-enzymatic conversion of AZA to 6-MP, three enzymes compete to metabolize MP: xanthine oxidase, which converts MP to the inactive metabolite 6-thiouracic; thiopurine methyltransferase (TPMT), which converts 6-MP to 6-MMP (unclear metabolic activity); and hypoxanthine phosphoribosyl transferase followed by inosine monophosphate dehydrogenase and guanosine monophosphate synthetase, which convert 6-MP to the active metabolites 6TGN. Thus, RBC 6TGN
concentration appears to be a potential candidate for the monitoring of therapeutic efficacy of AZA/ 6-MP. Pharmacological studies showing a prolonged half-life and a slow accumulation of 6TGN in the erythrocyte have been challenged by a recent study demonstrating that a steady state of RBC 6TGN concentration was obtained after only 2 weeks, even following classical oral treatment (14).
The RBC 6TGN concentration monitoring in patients treated with AZA/6-MP has been used in leukaemia and transplantation (16-19). In the treatment of children with acute lymphoblastic leukaemia treated with 6-MP, the RBC 6TGN concentration associated with efficacy was greater than 275 pmol/8 × 108 RBCs (16) while significant leukopenia was induced at concentration higher than 1000 pmol/8 × 108 RBCs (17). Therefore, the therapeutic window for RBC 6TGN in leukaemia seems to be 275-1000 pmol/8 × 108 RBCs, while in transplantation lower levels (100-200 pmol/ 8 × 10⁸ RBCs) are proposed but have not been clearly associated with a better response to treatment (19).
In CD very few data have been published. The RBC 6TGN target levels remain controversial. A study by Cuffari et al. performed in adolescent CD with steroid dependent or steroid refractory CD and treated with 6-MP for more than 4 months showed a negative correlation between disease activity and RBC 6TGN levels (6). In a further work published as an abstract, a RBC 6TGN greater than 250 pmol/8 × 108 RBCs was proposed as a target level (11). Such a discriminant level was also suggested by an another team in a recently published work (10). The first study (6), has been criticized for its non-complete prospective design and the absence of clear definition of steroid dependent and refractory patients (20). In contrast, our study is fully prospective and was performed on well-defined subgroups of patients. In this condition our results do not confirm a significant correlation between RBC 6TGN and response to AZA/6-MP. Indeed, median RBC 6TGN levels were similar, around 160 pmol/8 × 108 RBCs, in patients in remission with AZA/6-MP alone and in patients still needing steroids to control their disease or patients with active disease despite AZA/6-MP. This absence of correlation as well as a relatively low RBC 6TGN level in responders to AZA/6-MP was also observed by Sandborn et al. in patients with steroid dependent disease (14). In this study a steady level of RBC 6TGN, around 160 pmol/8 × 108 RBCs, was already obtained after 2 weeks of treatment and remained stable for another 16 weeks. We also found that the level of RBC 6TGN remained stable even over 6 months, in patients in which the oral dose of
AZA/6TGN was not changed. In a few patients, however, RBC 6TGN levels may vary significantly despite the absence of change in drug dosage. Interestingly, in 1 of our patients in remission under AZA and steroids RBC 6TGN levels decreased from 235 to 103 pmol/ 8 × 10⁸ RBCs while AZA dosage remained unchanged. However, we can not exclude a lack of compliance therapy. Concomitantly, this patient experienced a relapse suggesting that in an individual patient a target level could be determined for efficacy. As shown earlier, however, this level seems particular to a given patient and can not be applied to the others. Obviously, in a larger population, as recently published, a statistically significant discriminant level may appear for the whole group (10). However, this must not occult the fact that many patients are responders to the treatment with lower RBC 6 TGN levels and that this 'discriminant level' is probably not very relevant from a clinical point of view, and has not to be considered as a universal target.
In our study, no significant correlation was found either between response to therapy and various haematological parameters. Particularly, as with Sandborn et al. (14), we could not confirm the association between response to AZA/ 6-MP and relative leukopenia. Analysing the various biological parameters together, the only significant correlation was between RBC 6TGN and MCV. This indicates that the MCV may to some extent reflect the accumulation of active metabolites in the erythrocyte (21).
No side effect of AZA/6-MP was observed in our patients over 6 months. This may be explained by the fact that all patients were already at inclusion under long-term therapy; the majority of patients with potential side effects
having already stopped the treatment prior to the study, which was thus not specifically designed for the
investigation of side effects. As far as toxicity is concerned, Cuffari et al. proposed an association with high level of 6-MMP metabolite (6). The majority of our patients had no 6-MMP detected level and the only 3 patients in which it was detected had relatively low levels compared to Cuffari et al.'s patients. It must be noted that the sensitivity of our test was lower than the one of Lennard & Singleton (9). Therefore, some lower levels in the range 0.1-1 nmol/8 × 108 RBCs may have been missed. However, according to Cuffari et al. (6), these levels do not seen to correlate with significant side effects. The relatively low concentration of RBC 6TGN and the absence of 6-MPP in patients non-responding to AZA (group 3) allowed us to increase the dosage of AZA with safety. Indeed, in these patients the increase of a mean of 0.5 mg/kg/day was not associated with any
haematological complication over a 6-month period. Quite surprisingly, although, in 2 patients this increase in AZA dosage was followed by an increased RBC 6TGN concentration, in the 3rd patient a significant decrease was observed.
In conclusion, this work shows, contrary to preliminary studies, a broad overlap of RBC 6TGN levels as well as haematological parameters in patients in remission or not and responders or not to AZA/6-MP therapy. This suggests, beside a variability in the metabolism of these drugs, the existence of complex mechanisms of action. Nevertheless, beside the use of RBC 6TGN to confirm compliance to therapy, this dosage could be useful in non-responding patients, allowing, in the absence of leukopenia, to increase the dose of AZA/6-MP with safety. The specific utility of this dosage beside direct evaluation of methylation capacity (either genetic or biological) should be assessed in prospective studies.
Acknowledgments
E. Louis is Research Associate at the FNRS of Belgium. This work was supported by a grant from GlaxoWellcome.
References
1. Pearson DC, May GR, Fick GH, Sutherland LR. Azathioprine and 6-mercaptopurine in Crohn's disease. A meta-analysis. Ann Intern Med 1995;123:132-42.
2. Ewe K, Press AG, Singe CC, Singe CC, Stufler M, Ueberschaer B, et al. Azathioprine combined with prednisolone or monotherapy with prednisolone in active Crohn's disease. Gastroenterology 1993;105:367-72.
3. Korelitz BI, Adler DJ, Mendelsohn RA, Sacknoff AL. Long-term experience with 6-mercaptopurine in the treatment of Crohn's disease. Am J Gastroenterol 1993;88:1198-205.
4. Blondel-Kucharki F, Chircop C, Marquis P, Colombel JF, Gendre JP, et le GETAID. Qualité de vie au cours de la maladie de Crohn. Etude prospective longitudinale de 231 patients [abstract]. Gastroenterol Clin Biol 1999;23:A85.
5. Sandborn WJ. Azathioprine: state of art in inflammatory bowel disease. Scand J Gastroenterol 1998;33 Suppl 225:92-9.
6. Cuffari C, Théort Y, Latour S, Seidman G. 6-Mercaptopurine metabolism in Crohn's disease: correlation with efficacy and toxicity. Gut 1996;39:401-6.
7. Gower-Rousseau C, Salomez JL, Dupas JL, Marti R, Nuttens MC, Votte A, et al. Incidence of inflammatory bowel disease in northern France (1988-1990). Gut 1994;35:1433-8.
8. Franchimont D, Louis E, Croes F, Belaiche J. Clinical pattern of corticosteroid dependent Crohn's disease. Eur J Gastroenterol Hepatol 1998;10:821-5.
9. Lennard L, Singleton HJ. High-performance liquid chromatographic assay of the methyl and nucleotide metabolites of 6-mercaptopurine: quantitation of red blood cell 6-thioguanine nucleotide, 6-thioinosinic acid and 6-methylmercaptopurine metabolites in a single sample. J Chromatogr B Biomed Appl 1992;583:83-90.
10. Dubinsky MC, Lamothe S, Yang HY, Targan SR, Sinnett D, Théort Y, et al. Pharmacogenomics and metabolite measurement for 6-mercaptopurine therapy in inflammatory bowel disease. Gastroenterology 2000;118:705-13.
11. Cuffari C, Picco M, Hunt S, Bayless T. Azathioprine metabolite levels predict clinical responsiveness to therapy in IBD [abstract]. Gastroenterology 1999;116:G3020.
12. Barbe L, Marteau Ph, Lémann M, Bouhnik Y, Allez M, Coffin B, et al. Dose raising of azathioprine beyond 2.5 mg/kg/day in Crohn's disease patients who fail to improve with a standard dose [abstract]. Gastroenterology 1998;114:G3794.
Gastroenterol 1994;89:362-6.
14. Sandborn WJ, Tremaine WJ, Wolf DC, Targan SR, Sninski CA, Sutherland RS, et al. Lack of effect of intravenous administration on time to respond to azathioprine for steroid-treated Crohn's disease. Gastroenterology 1999;117:527-35.
15. Cattan S, Lémann M, Thuillier F, Bengoufa D, Rabian C, Ngo Y, et al. Dosage de la 6-mercaptopurine et étude des sous-populations lymphocytaires sanguines au cours du traitement par l'azathioprine dans la maladie de Crohn. Gastroenterol Clin Biol 1998;22:160-7. 16. Lillemans JS, Lennard L. Mercaptopurine metabolism and risk of relapse in childhood lymphoblastic leukemia. Lancet 1994;343:1188-90.
17. Lennard L, Lilleyman JS. Variable mercaptopurine metabolism and treatment outcome in childhood lymphoblastic leukemia. J Clin Oncol 1989;7:1816-23.
18. Bergan S, Rugstad HE, Bentdal O, Sodal G, Hartmann A, Leivestad T, et al. Monitored high-dose azathioprine treatment reduce acute rejection episodes after renal transplantation. Transplantation 1998;66:334-9.
19. Schutz E, Gummert J, Amstrong VW, Mohr FW, Oellerich M. Azathioprine pharmacogenetics: the relationship between 6-thioguanine nucleotides and thiopurine methyltransferase in patients after heart and kidney transplantation. Eur J Clin Chem Clin Biochem 1996;34:199-205.
20. Sandborn WJ. 6-MP metabolite levels: a potential guide to Crohn's disease therapy. Gastroenterology 1997;113:690-2.
21. Decaux G, Propert F, Horsmans Y, Desager JP. Relationship between red cell mean corpuscular volume and 6-thioguanine nucleotides in patients treated with azathioprine. J Lab Clin Med 2000;135:256-62.


![Rôles et mécanismes d'action du récepteur AT[indice inférieur 2] de l'angiotensine II d'un modèle cellulaire neuronal au tissu prostatique humain l'importance du contexte](data:image/gif;base64,R0lGODlhAQABAIAAAP///wAAACH5BAEAAAAALAAAAAABAAEAAAICRAEAOw==)