International Publications
Key Workplace Documents
2017
Working Time Patterns for Sustainable Work
Eurofound
Follow this and additional works at:
http://digitalcommons.ilr.cornell.edu/intl
Thank you for downloading an article from DigitalCommons@ILR.
Support this valuable resource today!
This Article is brought to you for free and open access by the Key Workplace Documents at DigitalCommons@ILR. It has been accepted for inclusion in International Publications by an authorized administrator of DigitalCommons@ILR. For more information, please [email protected].
[Excerpt] Working time is a recurrent topic of study because the nature of work, its content, the conditions
under which it is performed and the labour market itself keep changing. These changes have an impact on
working time duration and the way working time is organised. One of the manifest results is the erosion of a
clear demarcation between working time and non-working time – the work and private sphere.
The European Working Conditions Survey (EWCS) is among the sources that have clearly established the
link between working time patterns and the health and wellbeing of workers. Eurofound’s research on job
quality shows that working time quality is one of the crucial contributing elements.
]This report examines working time patterns in more detail. It provides an overview of the recent evolution of
working time duration and organisation in the EU and highlights the most important trends and differences
between Member States. Through an in-depth analysis of data from the sixth EWCS (2015), it also examines,
from a gender and life course perspective, the links between working time patterns, work–life balance and
working time preferences on the one hand and workers’ health and well-being, on the other. Finally, it
explores the implications of working time patterns for the longterm sustainability of work.
Keywords
European Union, working time, sustainable work, work-life balance
CommentsSuggested Citation
European Foundation for the Improvement of Living and Working Conditions. (2017). Working time patterns
for sustainable work. Luxembourg: Publications Office of the European Union.
Working time patterns for
sustainable work
sustainable work
European Foundation for the Improvement of Living and Working Conditions
Europe Direct is a service to help you find answers to your questions about the European Union. Freephone number*: 00 800 6 7 8 9 10 11
*Certain mobile telephone operators do not allow access to 00 800 numbers or these calls may be billed.
Printed in Luxembourg
Cover image: © Shutterstock/Elena Rostunova
Authors: Dominique Anxo (Linnaeus University), Jean-Yves Boulin (Université Paris-Dauphine), Jorge Cabrita and Greet Vermeylen (Eurofound), with contributions from Štěpánka Lehmann and René Lehmann (RILSA) and Agnès Parent-Thirion (Eurofound)
Research manager: Jorge Cabrita
Eurofound project: Working time patterns and sustainable work (150014)
Luxembourg: Publications Office of the European Union
Print: ISBN: 978-92-897-1601-7 doi:10.2806/585645 TJ-01-17-771-EN-C
Web: ISBN: 978-92-897-1600-0 doi:10.2806/736407 TJ-01-17-771-EN-N
© European Foundation for the Improvement of Living and Working Conditions, 2017
For rights of translation or reproduction, applications should be made to the Director, European Foundation for the Improvement of Living and Working Conditions, Wyattville Road, Loughlinstown, Dublin D18 KP65, Ireland. The European Foundation for the Improvement of Living and Working Conditions (Eurofound) is a tripartite European Union Agency, whose role is to provide knowledge in the area of social, employment and work-related policies. Eurofound was established in 1975 by Council Regulation (EEC) No. 1365/75 to contribute to the planning and design of better living and working conditions in Europe.
European Foundation for the Improvement of Living and Working Conditions Telephone: (+353 1) 204 31 00
Email: [email protected]
Executive summary 1
Introduction 3
1 Data and methodology 5
Data sources 5
EWCS methodology and clustering of countries 5
Stylised household life course typology 6
Data limitations and estimation techniques 7
2 Evolution of working time in the EU 9
Working time length 9
Working time distribution 16
Atypical working hours 30
Working time setting 36
Right to a daily rest period 38
3 Work–life balance across the life course 39
Crucial role of working time patterns 39
Evidence from the sixth EWCS 40
Work–life balance: A logistic approach 40
4 Working time preferences of employees 45
Actual versus preferred usual working time 45
Working time preferences of employees: An econometric approach 49
5 Working time patterns and workers’ well-being 53
Subjective well-being 53
Well-being at work 54
6 Working time patterns and workers’ health 55
Brief review of the literature 55
Evidence from the sixth EWCS 56
7 Working time patterns for sustainable work 61
Working time patterns and able-to-work life expectancy 62
Working time measures conducive to sustainable work 64
8 Conclusions and policy pointers 69
Abbreviations used in the report
BG Bulgaria HR Croatia PT Portugal
CY Cyprus HU Hungary RO Romania
CZ Czech Republic IE Ireland SE Sweden
DE Germany IT Italy SI Slovenia
DK Denmark LU Luxembourg SK Slovakia
EE Estonia LT Lithuania UK United Kingdom
EL Greece LV Latvia
ES Spain MT Malta
CHD chronic heart disease
EU-LFS European Union Labour Force Survey
EWCS European Working Conditions Survey
ICT information and communication technologies
OLS ordinary least squares
Introduction
Working time is a recurrent topic of study because the nature of work, its content, the conditions under which it is performed and the labour market itself keep changing. These changes have an impact on working time duration and the way working time is organised. One of the manifest results is the erosion of a clear demarcation between working time and non-working time – the work and private sphere.
The European Working Conditions Survey (EWCS) is among the sources that have clearly established the link between working time patterns and the health and well-being of workers. Eurofound’s research on job quality shows that working time quality is one of the crucial contributing elements.
This report examines working time patterns in more detail. It provides an overview of the recent evolution of working time duration and organisation in the EU and highlights the most important trends and differences between Member States. Through an in-depth analysis of data from the sixth EWCS (2015), it also examines, from a gender and life course perspective, the links between working time patterns, work–life balance and working time preferences on the one hand and workers’ health and well-being, on the other. Finally, it explores the implications of working time patterns for the long-term sustainability of work.
Policy context
New methods of production and new forms of work organisation have resulted in a much more flexible organisation of working time. At the same time, societal changes such as ageing, the growing diversity of life trajectories, varying employment paths and the trend towards a shorter working life have all created challenges for welfare states and social protection systems. It is therefore not surprising that one of the major objectives of the European Employment Strategy is to raise overall employment rates, in particular for women and older workers. However, for workers to be able to work and to continue to work, achieving a good fit between working time and non-working time through the adaptation of duration and organisation of working time is essential.
It is against this background that, as part of the European Pillar of Social Rights, the European
Commission launched the Initiative to support work–life balance for working parents and carers. This seeks to enable parents and individuals with caring
responsibilities to better balance their work and family lives, and to encourage the fair sharing of caring
legislative proposal to modernise the EU legal
framework on family-related leaves and flexible working arrangements.
Key findings
The analysis of EWCS data confirms that the gender gap in weekly working time remains important, with men in the EU28 working on average 39.2 hours and women 32.7 hours. The gender gap in paid working time is greatest in western Continental Europe, Ireland and the UK.
The vast majority of respondents to the sixth EWCS, independent of gender and employment status, stated that their working hours fit ‘well’ or ‘very well’ with their private life obligations. However, men appear to be less satisfied with their work–life balance than women. This can be attributed to the fact that men have longer working hours and therefore relatively more difficulties in adapting working time to family life or other social commitments. At the same time, it is assumed that many women have opted for occupations, sectors and working hours that make it easier to combine work with family commitments.
The duration of working time was found to have a negative impact on the extent of work–life balance, with both men and women indicating that long working hours reduced their possibility to combine work and other social commitments. Working time arrangements that favour fixed and regular working hours, good working conditions, high predictability of working time, the possibility to take time off and/or job autonomy all increase the likelihood of achieving a balanced work– life situation.
The negative impact of work on work–life balance tends to be concentrated during the early phase of parenting – when respondents have young pre-school children. Although this period coincides with a reduction in working time for employed mothers and an increase in working time for working fathers, both sexes express a preference for working shorter hours during the parenting phase.
While overall most individuals seem to be satisfied with their current working time, the majority of the 42% expressing a preference for a change in their working time say they would like to reduce their current working time. Working time preferences do not differ drastically between sexes: if anything, a slightly higher proportion of men reported a preference to reduce their working time while a slightly higher share of women would like to increase their working time.
While there are no differences between men and women regarding the necessity to work during their free time to meet work demands, women more often than men reported that their job prevented them from giving the time they wished to their family. In particular, both men and women working in education, as well as self-employed people, are more likely to report that they work during their leisure time.
In terms of the link between working time and health and well-being, the results show that having control over working time and fixed or regular working time have a positive impact on workers’ well-being. Dissatisfaction with working conditions, atypical working hours, long working hours, high work intensity and working during free time were shown to be detrimental to a good work–life balance.
Sustainability of work – measured by the reported ability to work up to 60 or later – is shown to be negatively affected by a number of factors, such as low satisfaction with working conditions, exposure to physical risks, poor work–life balance and atypical working time patterns (shift, night or weekend work). Conversely, work sustainability can be positively influenced by adjustments in working time patterns available to workers which are aimed at enhancing employee-friendly flexibility or specifically designed for workers with care responsibilities.
Policy pointers
£ Working time policies must adopt a life course perspective. Individuals’ needs and preferences in terms of working time vary throughout life. Working time policies should acknowledge this variation over the life course and provide more support and/or flexibility during those periods where tensions of work–life balance are highest.
£ Policies should continue to promote a more equal distribution of paid and unpaid work between men and women. The gender gap in weekly working hours is mirrored by differences in time spent on unpaid work and care responsibilities. A stronger involvement of men, and fathers in particular, in the domestic sphere could be encouraged through better incentives for men to take family-related leave or to be compensated for reduced working hours during the parenting phase of life.
£ Policies should be transformative. Policy initiatives such as the recent one by the European
Commission, which contain proposals to modernise the legal framework on family-related leaves and flexible working time arrangements, are in line with the needs expressed by men (particularly the preference to work fewer hours during the parenting phase of life). They therefore have great potential to be well received and are likely to be transformative by promoting a more equal distribution of paid and unpaid work between men and women.
£ Universal and individual rights should be complemented by collective agreements at sectoral, branch or company level. Regulation of maximum weekly working hours, rest periods, leave, family-related leave and protection during atypical work should take into account the
specificities of the sector or branch of activity, while supporting the adaptation of working time to individuals’ changing needs and preferences across the various life stages.
£ Working time policies must address factors having a negative impact on the sustainability of work. Good health, satisfaction with working conditions and flexible work–life balance arrangements are strong predictors for willingness and ability to stay in employment longer. Policies should therefore encourage working time patterns that prevent negative impacts on workers’ health and well-being, for example, by deterring long working hours for extensive periods of time. They should promote greater job and working time autonomy, and favour better work–life balance.
£ Good practice examples need to be identified and promoted. Differences between the country clusters examined in this report point to the fact that policymakers should look for guidance in those clusters performing better in terms of achieving a good work–life balance and greater sustainability of work.
Eurofound since it was founded in 1975. It is a recurrent topic due to the fact that the nature of work, its content, the conditions under which it is performed and the labour market itself keep changing. While research has shown that over the past couple of decades in Europe work has become less physically demanding, there is no doubt that intellectual demands have increased. Technological developments are increasingly blurring the distinctions between objective and subjective work, and between the professional and the private or family sphere.
New methods of production as well as new forms of work organisation have resulted in the development of a much more flexible organisation of working time. Standardised work organisation and working time patterns have gradually given way to more complex and diversified structures. The intensification of competition has required organisations to restructure and to adapt their working time according to new needs and requirements. As a consequence, new working time arrangements – such as flexitime – have been developed and implemented.
These new forms of working time arrangements give workers some freedom to adjust their working time within certain limits and promote working time autonomy. As a consequence, the control of working hours has been replaced in many cases by performance monitoring. Individuals are required to achieve certain goals and certain objectives, independent of the time required and effectively taken to do so.
Other societal changes that are relevant to the ongoing debate on working time are:
£ population ageing;
£ diversity of life trajectories;
£ uneven employment paths;
£ general tendency towards a shorter working life.
These changes have all created challenges for the welfare state and social protection systems. It is therefore not surprising that one of the major objectives of the European Employment Strategy since the beginning of this century has been to raise overall employment rates across the European Union. The achievement of this goal is critically dependent on the further integration of women into employment in general – and full-time employment in particular – as well as raising the employment rate of older workers. Some of the most important policy instruments to achieve higher employment rates have focused on enhancing the opportunities for both women and men to combine employment with other commitments over
paid flexible parental leave systems, reversible working time options (for example, transitions between part-time and full-part-time hours) and the right to training leave. These policy approaches can contribute to achieving a time and income allocation across the life course that is conducive to an increase in the overall employment rate. This, in turn, supports the long-term sustainability of work and the financial stability of social protection systems.
It is against this background that, as part of the European Pillar of Social Rights, the European
Commission launched the Initiative to support work–life balance for working parents and carers in April 2017. The initiative’s main objective is to enable parents and individuals with caring responsibilities to achieve a better balance between their work and family lives and to encourage more equal sharing of caring
responsibilities between women and men. The initiative includes a legislative proposal to modernise the EU legal framework on family-related leaves and flexible working arrangements (European Commission, 2017). Another common policy response to the challenge of stepping up employment rates has been to encourage the postponement of retirement, not only through financial incentives but also by introducing preventive measures, such as lifelong learning and adapting working conditions and working time at the end of the career (for example, progressive retirement).
Over the last half century, modern economies have experienced not only a shortening of working hours but also a marked trend towards a diversification and individualisation of working time patterns. In spite of these common trends, there are large differences across Europe regarding work organisation, working time duration and distribution, the extent of atypical work and work–life balance possibilities.
This report first provides an overview of the recent evolution of working time duration and organisation in the EU, highlighting the most important trends and pointing to differences between Member States. It then examines, in a life course perspective, the links between working time patterns, work–life balance, working time preferences, and health and well-being. It also looks at the implications of working time patterns for the long-term sustainability of work. The link between working time quality and workers’ health and well-being was highlighted in the overview report presenting a first analysis of data from the sixth European Working Conditions Survey (Eurofound, 2016a). Working time quality is one of seven job quality indices which Eurofound has developed to capture the multidimensional nature of job quality.
Building on this research, the report is structured as follows. After presenting the data sources and the methodology used (Chapter 1), the report describes the evolution of working time duration and arrangements, including the prevalence of atypical work, in EU Member States from a life course and gender perspective (Chapter 2). Chapter 3 identifies the state of work–life balance in Europe, in particular the extent to which current working time arrangements and working conditions make it possible to combine paid work with other commitments and activities over the life course. Chapter 4 provides an analysis of working time
preferences and examines whether workers are satisfied with their current working time or whether they would like to reduce or lengthen it. Chapters 5 and 6 analyse the relationships between prevailing working time
patterns, on the one hand, and well-being and health, on the other. Chapter 7 endeavours to assess the extent to which prevailing working conditions and working time patterns in EU Member States are sustainable in the long run. Do they favour the continuous labour force participation of men and women over the life course, enhance individuals’ well-being and support the lengthening of working life? The chapter also includes a section presenting selected examples of measures and initiatives, carried out by governments and/or social partners, which contribute to improving the sustainability of work through changing the way working time is regulated and organised in practice. The final chapter provides concluding remarks and policy pointers.
Data sources
The two main data sources for this report are:
£ European Union Labour Force Survey (EU-LFS) –
a large sample survey of people aged 15 years and over living in private households that covers all the EU28 Member States;
£ European Working Conditions Survey (EWCS) –
a sample-based survey of workers covering a comprehensive spectrum of working conditions related themes and topics, carried out by Eurofound every five years, since 1990.
The EU-LFS data are mainly used in Chapter 3 as they provide a more comprehensive picture of the evolution of some of the main aspects of working time duration and organisation, including atypical working time arrangements, than the EWCS. The EWCS is the main data source for most of the remaining chapters, with the exception of the section in Chapter 7 on measures related to working time patterns for sustainable work, which is based on information submitted by the national members of Eurofound’s Network of European Correspondents in 2015–2016 through a common questionnaire.
EWCS methodology and
clustering of countries
The sixth EWCS provided data for 35 European countries in 2015: 28 EU Member States, the five EU candidate countries (Albania, Montenegro, the Former Yugoslav Republic of Macedonia, Serbia, and Turkey) plus Norway and Switzerland. In the present study, the analysis is
imposition of some restrictions such as the introduction of an upper limit on usual weekly working hours (maximum of 120 hours a week, corresponding to
around 17 hours per day on a 7 day basis1), the sample
contained 34,457 valid observations.
Although the number of observations at country level is at least 1,000, it was not possible – due to the very small sample size – to perform disaggregated regression analyses at country level. Against this background, it was decided to cluster countries (see Table 1) mainly according to broad geographical areas but also taking into account the type of industrial relations, the welfare state system, the regulation of working time and the prevailing gender contract (based on full-time equivalent female employment rates and incidence of dual-earner households; see Table B1, Table B2 and
Figure B1 in the Annex).2
It should be emphasised that the main objective of the clustering approach is not to develop a new typology that could challenge established models of welfare state capitalism but to construct country groupings reflecting the issues at stake and serving the purposes of this study.
The Northern countries cluster represents a relatively homogeneous group of countries with generous and inclusive welfare state systems, high female
employment rates, high incidence of dual-earner households, and a relatively centralised and coordinated industrial relation system – and where working time is mainly regulated through collective agreements.
1 Less than 0.01% of the respondents in the sample reported that their usual weekly working time was equal to or exceeded 120 hours a week. 2 An annex to the present report containing supplemental statistical data is published separately at the webpage for this report:
https://www.eurofound.europa.eu/publications/report/2017/working-life-patterns-for-sustainable-work
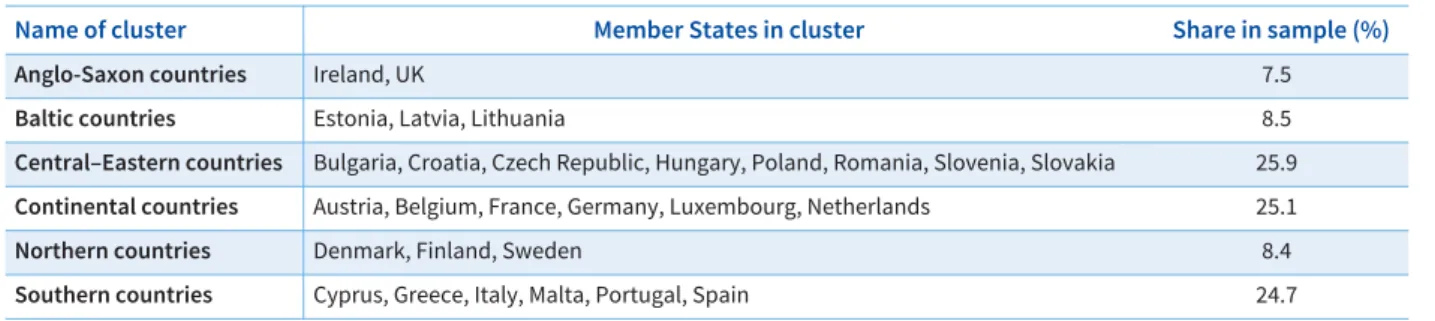
Table 1: Breakdown by country clusters in total sample
Name of cluster Member States in cluster Share in sample (%)
Anglo-Saxon countries Ireland, UK 7.5
Baltic countries Estonia, Latvia, Lithuania 8.5
Central–Eastern countries Bulgaria, Croatia, Czech Republic, Hungary, Poland, Romania, Slovenia, Slovakia 25.9
Continental countries Austria, Belgium, France, Germany, Luxembourg, Netherlands 25.1
Northern countries Denmark, Finland, Sweden 8.4
Southern countries Cyprus, Greece, Italy, Malta, Portugal, Spain 24.7
As a group on the opposite end of the spectrum, the Southern countries are characterised by relatively limited social protection systems, a traditional gender division of labour with relatively low female labour force participation (with the exception of Portugal whose female employment rate is above the EU average, see Tables B1 and B2a in the Annex) and a working time regime characterised by a relatively low incidence of female part-timers.
The Anglo-Saxon countries remain the archetype of a liberal market oriented regime with residual welfare state systems, a relatively decentralised regulation of working time (at the company level) and a gender polarised working time regime: a high incidence of long working hours for men and a high incidence of marginal part-time work for women.
Even though the Central–Eastern and Baltic countries clusters are less homogeneous along these dimensions compared with the other clusters, they share some common traits. They are all former communist
countries, and have relatively high female employment rates with a relatively high share of dual-earner households and a prevalence of full-time jobs for both men and women.
The last cluster, Continental countries, encompasses the same set of countries as Esping-Andersen’s classification of a continental type of welfare state capitalism (Esping-Andersen, 1990).
To test the robustness of this clustering, some sensitivity analyses were conducted by estimating separate equations for each of the country clusters. The results of the analysis show a relatively low
heterogeneity in terms of working time duration and arrangements among employees within clusters, thus validating the clustering choice. The results of the estimations are available on request from Eurofound.
Stylised household life course
typology
There are sound reasons to believe that the time spent on paid work, the type and incidence of various forms of working time arrangements, as well as working time preferences and needs, vary across the life course. To reflect this lifecycle component of working time, this report uses a variant of the family lifecycle approach (Eurofound, 2006a, 2012a; Anxo et al, 2011).
While the traditional family lifecycle approach implies a uniform sequence of household formations, the sequencing of life stages appears to be more diversified in contemporary societies. This typology does not assume that everyone moves through a uniform sequence of household types across their life course. Rather a range of household types is selected, reflecting widely experienced transitions and phases over the life course, as a basis for comparative analysis (Table 2).
Table 2: Stylised household life course typology and shares in EWCS 2015
Household type Share
Single and childless young people
I. Single people (18–35 years), living with their parents or relatives 2.0%
II. Single people (under 46 years), living on their own, without children 9.1%
Childless couple
III. Younger cohabiting couples (woman under 46 years), without children 9.0%
Couple with resident children
(The age of the youngest child is used to indicate the nature of parental responsibilities across the life course, from the time-intensive pre-school period through to the different needs and demands of children as they grow up and become more independent)
IV. Cohabiting couples with young children (age of children <7) 13.2%
V. Cohabiting couples with young children (age of children 7–12) 7.2%
VI. Cohabiting couples with teenage children (age of children 13–18) 16.2%
Older couples without children living at home
VII. Midlife ‘empty nest’ couples without resident children (woman aged 46–59) 9.6% VIII. Older cohabiting couples without resident children (woman aged 60 or older) 4.1%
Older singles
IX. Single people (aged 50 or older), without resident children 7.9%
Note: Households not classified (22.0%) includes single mothers and fathers, and other types of household categories such as couples with resident children older than 18 years, siblings living together and so on.
In order to also take into account contemporary family styles, no distinction is made between married or unmarried couples. For the purpose of this report, it is only relevant whether couples are cohabiting or not. One consequence of the choice regarding the stylised life course is that important – and in some countries growing – household categories are excluded (for example, lone parents). However, the typology covers 78% of all households found in the sample of EU Member States at a given point of time – 2015. The stylised household typology makes it possible to perform a cross-country comparison of working time arrangements for women and men in different life stages as a means of illustrating the impact of the societal context on the prevailing gender division of paid labour over the life course for employees and self-employed.
Although the approach is not longitudinal, the analysis might serve as a device to identify country differences in the time devoted to work across different life stages in the EWCS sample. This approach also makes it possible to identify at which phases in the life course long working hours, atypical work (night, shift and weekend work), discrepancies between actual and preferred working time, and/or the possibility to combine paid work with other activities are more limited or prevalent. However, the usual drawbacks associated with
cross-sectional analysis need to be borne in mind in the interpretation of the results: in particular, the difficulties of disentangling age, cohort and period effects or in identifying causal effects regarding the impacts, for example, of working time arrangements or atypical work on an individual’s well-being and health. To assess accurately the impact of working time arrangements on well-being or the impact of long working hours or night work on health requires longitudinal microdata covering a long period of time and including a rich set of socioeconomic variables. In addition, the cross-sectional nature of the data means it is not possible to identify potential causal effects and for these reasons the results of all the statistical analysis must be interpreted with care.
Data limitations and estimation
techniques
It is important to be aware that the EWCS is not a representative sample of the whole active population but rather of economically active individuals
(employees and the self-employed at work). The EWCS sample is restricted to working men and women, and so disregards individuals outside the labour force such as housewives, early retirees, and individuals on long-term sickness or with work-impairing disabilities.
For some countries with, for instance, low employment rates (in particular for women but also for older workers), this may create some potential selection bias regarding both working time and the prevailing gender contract and the gender division of labour. That means that some cross-country and gender differences in, for example, the duration of working time can be ascribed, at least partly, to the sample selection processes. At the individual level, more labour market oriented women and men could, for example, be less inclined to have children or have a higher tendency to outsource some household activities, affecting in this way working time
and the gender division of labour.3Obviously, these
potential sample selection biases must be borne in mind when interpreting the results of the estimations. Working hours and working time arrangements in the EWCS, but also work–life balance, health status and well-being are self-reported, a characteristic of most individual level surveys. To the extent that individuals may over- or under-estimate (for example, their actual working hours), this could produce measurement errors and bias in the estimation of the marginal effects. Such issues are also present when data are collected by other means, such as employer-level surveys or personnel records such as time use studies. Since there is no presumption as to the size or direction of the bias produced by self-reporting, it is difficult to assess the impact of this potential measurement error on the results. Again, the results of the statistical analysis must be handled with care.
As described above, a country clustering exercise was carried out to overcome the difficulty of running regressions at country level due to the small sample sizes. Although the robustness of the clustering was validated by some sensitivity tests, there are some differences between the countries within each cluster that it is important to bear in mind in the interpretation of the results. Whenever relevant and possible, these differences are highlighted in the report.
In addition to a standard descriptive and comparative analysis of the core dependent variables (working time distribution, atypical work, working time preferences, work–life balance, well-being, job satisfaction, health and safety risks, work-related sickness absenteeism and working life expectancy), and in order to control for potential structural differences and compositional effects across countries, a set of regressions using standard econometric techniques have been estimated. Since the core dependent variables are either
continuous (for example, index of atypical work) or dichotomous (work–life balance indicators) or multinomial, that is, including more than one discrete choice (working time preferences and working time distribution), standard econometric methods such as ordinary least squares (OLS), and standard and
multinomial logit have been used. Since the estimated coefficients have no natural interpretation in the logit and multinomial logit regressions, the marginal effects evaluated at sample means have been reported. Finally, it is important to acknowledge that caring responsibilities for dependent relatives (parents or spouses) are an extremely important factor in individuals’ choices, restrictions and preferences in terms of working time. However, these are difficult to include in the stylised household life course typology because, while the EWCS allows the different life stages in terms of parenting to be covered very well, it does not – by design – cover adequately the situation of those who need to take care of their parents, spouses or other relatives.
This chapter looks at the most important features of working time duration and organisation in the EU on the basis of EU-LFS and EWCS data. The EU-LFS data are mainly used to depict the main trends at EU level because the EU-LFS provides annual data. The EWCS data are used for those aspects that are not provided by the EU-LFS, such as days of work per week, how working time is set or rest periods between working days. The EWCS data are also used to go deeper into aspects such as working time distribution by household type.
Working time length
Days of work per week
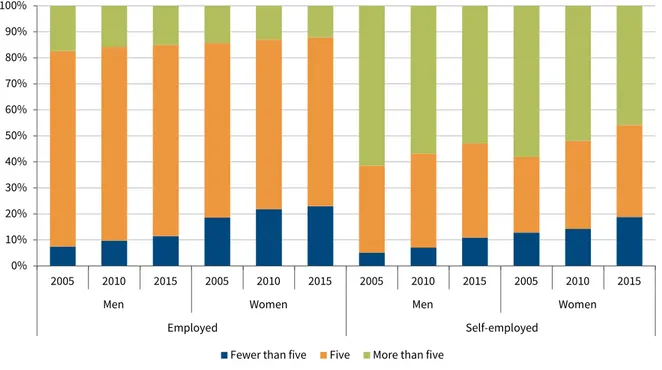
According to the EWCS, five days of work per week is the norm in the EU, being reported by nearly two-thirds of employees in 2015. The share of workers working fewer than five days has been increasing since 2005 (from 12%
in 2005 to 16% in 2015; 7% to 11% for men and 18% to 22% for women, respectively), whereas the share of those declaring that they work more than five days per week fell from 23% in 2005 to 20% in 2015 (26% to 22% for men and 20% to 16% for women).
There is a striking difference in this respect between employees and self-employed (Figure 1). The vast majority of employees in the EU (more than 70% of men and 65% of women) reported working five days a week in 2015, whereas over half of the self-employed worked more than five days per week.
There are also important differences across the EU Member States (Figure 2). The largest shares of workers reporting working more than five days per week in 2015 were in Croatia and Greece, while the largest shares of workers reporting working fewer than five days per week were in Ireland, the Netherlands and the UK.
Figure 1: Percentage of usual number of working days per week by sex and employment status, EU28, 2005–2015 0% 10% 20% 30% 40% 50% 60% 70% 80% 90% 100% 2005 2010 2015 2005 2010 2015 2005 2010 2015 2005 2010 2015
Men Women Men Women
Employed Self-employed
Fewer than five Five More than five
Usual working hours according to the
EU-LFS
The average usual weekly working hours in the EU have been decreasing for many years and this downward trend continued for the EU as a whole between 2005 and 2015. EU-LFS data depicts this decreasing trend for men and women, both employees and the
self-employed. The decrease was steeper for male employees (0.8 hours less in 2015 than in 2005) than for female employees (0.1 hours less in 2015 than in 2005). Overall, the decline was greater among the
self-employed (2.6 hours less in 2015 than 10 years earlier; 2.7 hours less for men and 1.7 hours less for women) than for employees (0.6 hours less in 2015 than in 2005).
Although the tendency is towards a reduction in the gender gap, the differences between men and women
persist. In 2015, the usual weekly working hours for male employees (39.1 hours) was almost 6 hours longer than for their female counterparts. The self-employed continued to report much longer working weeks (42.5 hours) than employees (36.3 hours). The difference between men and women among the self-employed is much larger: the average figure of 45.1 hours for self-employed men corresponds to 36.9 hours for their female counterparts.
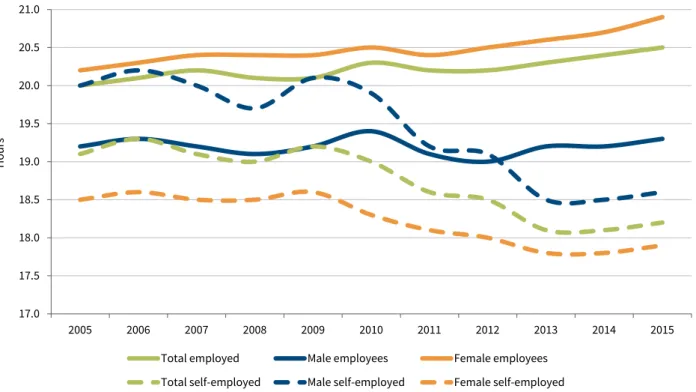
Figure 3 shows the evolution of usual weekly hours in
their main job for full-time workers.4The decrease was
minimal for male employees (from 41.3 hours in 2005 to 41.0 hours in 2015) and virtually none for female employees (39.3 hours in both 2005 and 2015). The downward trend is far more accentuated among the full-time self-employed who reported, on average, working 1.8 hours less in 2015 (47.5 hours) than in 2005 (49.3 hours).
Figure 2: Percentage of usual number of working days per week by country, 2015
0% 10% 20% 30% 40% 50% 60% 70% 80% 90% 100%
Fewer than five Five More than five
Source: EWCS 2015
4 According to Eurostat, ‘The distinction between full-time and part-time work is generally based on a spontaneous response by the respondent. The main exceptions are the Netherlands and Iceland where a 35 hour threshold is applied, Sweden where a threshold is applied to the self-employed, and Norway where people working between 32 and 36 hours are asked whether this is a full- or part-time position’ (Eurostat, 2017).
The main trend for part-time workers is different for employees and self-employed (Figure 4). While the latter registered a decrease in the average usual working hours between 2005 and 2015, the former
registered an increase, which was larger for women. Another particularity of part-time female employees is that they tend to work slightly longer than their male counterparts, whereas self-employed part-time workers
Figure 3: Full-time workers – average number of usual weekly hours of work in main job by sex and employment status, EU28, 2005–2015
35 37 39 41 43 45 47 49 51 2005 2006 2007 2008 2009 2010 2011 2012 2013 2014 2015 Ho u rs
Total employed Male employees Female employees Total self-employed Male self-employed Female self-employed
Source: EU-LFS
Figure 4: Part-time workers – average number of usual weekly hours of work in main job by sex and professional status, EU28, 2005–2015
17.0 17.5 18.0 18.5 19.0 19.5 20.0 20.5 21.0 2005 2006 2007 2008 2009 2010 2011 2012 2013 2014 2015 Ho u rs
Total employed Male employees Female employees Total self-employed Male self-employed Female self-employed
have the classic pattern of men working longer than women (Figure 4). One noteworthy detail is the fact that, according to EU-LFS data, male part-time employees have, since 2013, worked on average more hours than their self-employed counterparts.
Usual working hours according to
EWCS data
According to EWCS data, the average weekly working time in the EU28 in 2015 amounted to 36 hours. Again, the gender gap in weekly working time remains important, with employed men in the EU28 working on average 39.2 hours and women 32.7 hours per week (Table 3).
The cross-country disparities in weekly working time are also large, with the average weekly working time ranging from 41.3 hours in Greece to 31.4 hours in the Netherlands (see Table B3 in the Annex). The disparity
by employment status is also significant: the average hourly gap between employees and self-employed people is 4.2 hours a week.
The average weekly working time at the aggregate level conceals large structural differences regarding sex, employment status and distribution of employment by sector of activity.
Weekly working time among employees
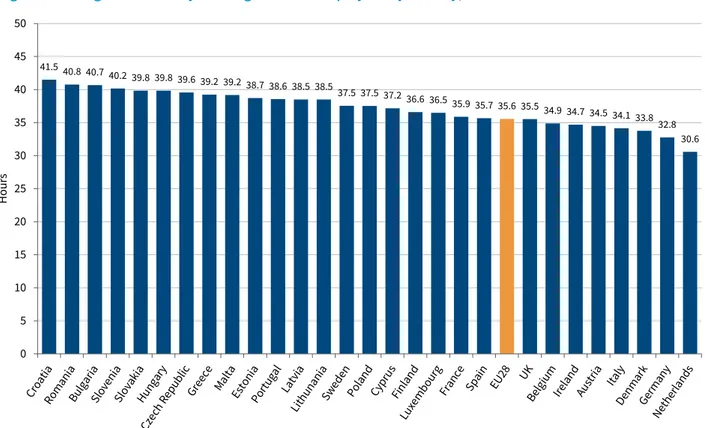
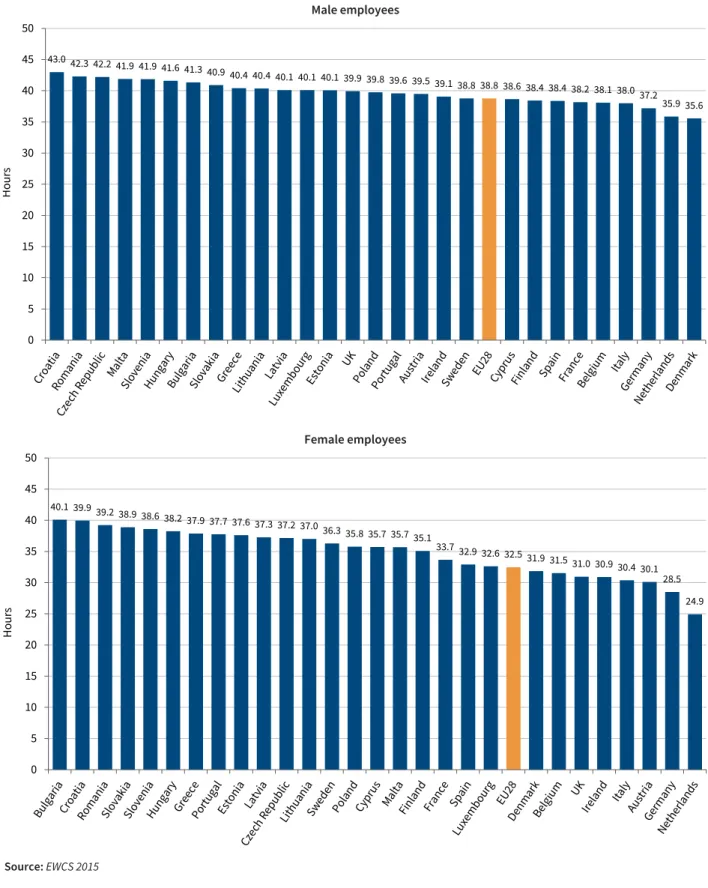
According to EWCS data, the average weekly working time among employees varied considerably within the EU in 2015 (Figure 5). Indeed, the working hours gap between Member States amounts to almost 11 hours a week. The longest weekly working time is found in Central–Eastern Member States and the shortest in Denmark, Germany and the Netherlands. At the aggregate level, the average weekly working time conceals large compositional effects and large disparities by sex, employment status and sector. Figure 6 shows the average working time for women and men separately according to EWCS data. In all countries, male employees work on average longer hours than their female counterparts. However, the extent of the gender time gap differs across European countries, the highest gender gaps being found in the Netherlands (11 hours), the UK (8.9 hours), Austria (9.4 hours) and Germany (8.7 hours). The lowest gaps are found in Bulgaria (1.2 hours), Portugal (1.9 hours), Slovakia (2.0 hours) and Estonia (2.5 hours).
Table 3: Average weekly working hours by sex and employment status, EU28, 2015
Men Women All
Employees 38.8 32.5 35.6
Self-employed 42.4 35.8 39.9
All employed 39.2 32.7 36.0
Source: EWCS 2015 (authors’ calculations)
Figure 5: Average usual weekly working hours for employees by country, 2015
41.5 40.8 40.7 40.2 39.8 39.8 39.6 39.2 39.238.7 38.6 38.5 38.5 37.5 37.5 37.2 36.6 36.5 35.9 35.7 35.6 35.5 34.9 34.7 34.5 34.133.8 32.8 30.6 0 5 10 15 20 25 30 35 40 45 50 Ho u rs
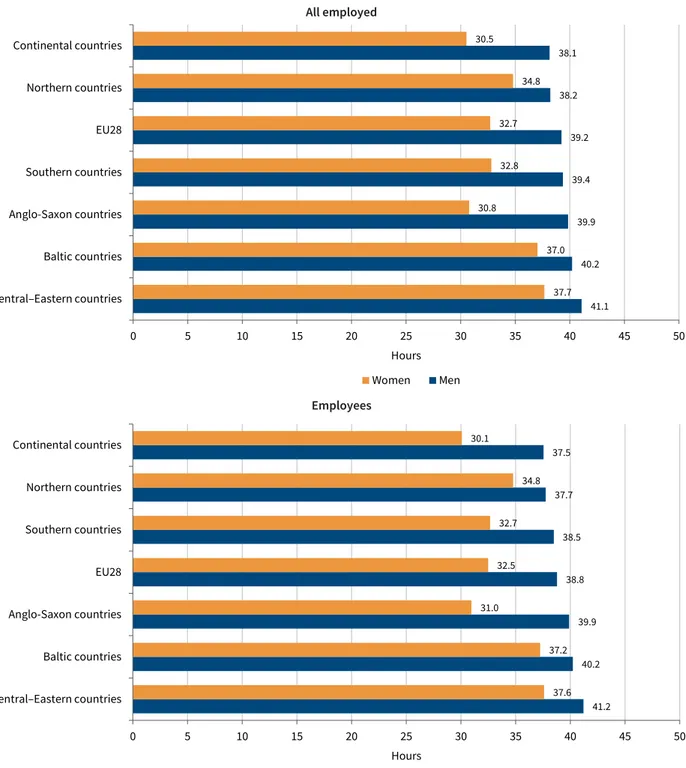
Figure 7 shows the average usual weekly working time in the six country clusters. The longest average weekly working time is found in Central–Eastern countries, followed by the Baltic countries: these two country clusters display the longest weekly working hours independently of sex and employment status. It is also important to note that the Baltic countries show the
highest share of full-time dual-earner households, followed by the Northern countries and the Central– Eastern countries (see Figure B1 in the Annex). While male employees in the Anglo-Saxon countries have a long average weekly working time, female employees have the shortest, reflecting a higher gender polarisation of working time. The gender polarisation of
Figure 6: Average weekly working hours by sex and country, 2015
43.0 42.3 42.2 41.9 41.941.6 41.3 40.9 40.4 40.4 40.1 40.1 40.1 39.9 39.8 39.6 39.539.1 38.8 38.8 38.6 38.4 38.4 38.2 38.1 38.0 37.2 35.9 35.6 0 5 10 15 20 25 30 35 40 45 50 Ho u rs Source: EWCS 2015 Male employees 40.1 39.9 39.2 38.9 38.6 38.237.9 37.7 37.6 37.3 37.2 37.0 36.3 35.8 35.7 35.735.1 33.7 32.9 32.6 32.5 31.9 31.5 31.0 30.930.4 30.1 28.5 24.9 0 5 10 15 20 25 30 35 40 45 50 Ho u rs Female employees
working time is much less pronounced in the
Central–Eastern, Baltic and Northern country clusters.
Weekly working time among
self-employed
Around 15% of the employed people in the EWCS sample are self-employed: the majority of these are male (61%) and have no employees (71%). With just a few exceptions (Bulgaria, Croatia, Hungary and Portugal), the average weekly working time of a self-employed person is significantly longer than that of
an employee. For the EU28 as a whole, the average hourly gap between employees and self-employed people amounts to around 4.3 hours. The highest hourly gap between employees and self-employed people is found in Belgium (12.1 hours), followed by Ireland (9.5 hours), Spain (8.2 hours) and France (7.5 hours). Besides traditional factors such as market constraints and/or differences regarding work commitments and attitudes, as well as preferences in time allocation, the observed disparities in working time between
employment status might be ascribed to the fact that
Figure 7: Average weekly working hours of men and women by country cluster, 2015
41.1 40.2 39.9 39.4 39.2 38.2 38.1 37.7 37.0 30.8 32.8 32.7 34.8 30.5 0 5 10 15 20 25 30 35 40 45 50 Central–Eastern countries Baltic countries Anglo-Saxon countries Southern countries EU28 Northern countries Continental countries Hours Women Men
Source: EWCS 2015 (authors’ calculations)
All employed 41.2 40.2 39.9 38.8 38.5 37.7 37.5 37.6 37.2 31.0 32.5 32.7 34.8 30.1 0 5 10 15 20 25 30 35 40 45 50 Central–Eastern countries Baltic countries Anglo-Saxon countries EU28 Southern countries Northern countries Continental countries Hours Women Men Employees
the self-employed are not subject to the provisions – either at country or at EU level – of the EU Working Time
Directive.5Against this background, part of the
observed difference in average weekly working time in Europe might be ascribed to cross-country differences in the extent of self-employment (varying from 5.7% and
7.3% in Denmark and Sweden, respectively, to 36.7% and 26.2% in Greece and Italy, respectively).
The average weekly working hours of the self-employed in 2015 varied markedly between EU Member States and between country clusters (Figure 8). The self-employed in the Central–Eastern cluster work the longest and
5 In the transport sector, there are statutory working time limits even for the self-employed (for example, pilots).
Figure 8: Average weekly working hours of the self-employed by country and country cluster, 2015
47.0 45.5 45.1 44.2 44.1 43.9 43.4 43.3 43.242.5 42.5 41.5 40.9 40.2 39.9 39.9 39.8 39.839.2 39.0 38.3 38.1 37.5 37.5 37.2 37.0 36.135.2 33.8 0 5 10 15 20 25 30 35 40 45 50 Ho u rs
Source: EWCS 2015 (authors’ calculations)
EU Member States 43.6 43.2 42.5 42.4 41.9 40.8 39.7 35.8 41.1 35.2 35.8 36.3 35.6 29.4 0 5 10 15 20 25 30 35 40 45 50 Continental countries Central–Eastern countries Southern countries EU28 Northern countries Baltic countries Anglo-Saxon countries Hours Women Men Country clusters
have the smallest gender gap. The gender gap in weekly working time among self-employed people is
particularly pronounced in the Anglo-Saxon country cluster (around 10 hours), mirroring the situation for employees characterised by the strong gender
polarisation of working time.6
The different types or groups within self-employed individuals might also be relevant to working time patterns. These different types of self-employment have been studied by Eurofound and are the theme of an extensive report similarly based on the EWCS 2015 (Eurofound, 2017).
Working time distribution
Incidence of part-time work
One of the most important developments in the EU at the end of the 20th century and the beginning of the 21st century has been the gradual increase in importance of part-time work. According to the Directive on part-time work (97/81/EC), a ‘part-time worker’ is:
an employee whose normal hours of work, calculated on a weekly basis or on average over a period of employment of up to one year, are less than the normal hours of work of a comparable full-time worker.
(Directive 97/81/EC)
The figures from EU-LFS show that part-time work as a percentage of total employment increased in the EU28
from 17.7% in 2005 to 20.5% in 2015.7While part-time
work as a share of employment increased similarly for both women (from 31% in 2005 to 33% in 2015) and men (from 7% in 2005 to 10% in 2015), the average working hours of ‘part-timers’ increased in the same period for women (from 20.2 hours in 2005 to 20.9 hours in 2015), while for men they remained more or less the
same (19.2 hours in 2005 and 19.3 hours in 2015).8
The trends and incidence of part-time work vary considerably across EU Member States. Average part-time hours are longer in Belgium, France, Luxembourg, Hungary, Poland, Romania and Sweden (all above 22 hours per week in 2015) and slightly shorter in Bulgaria, Denmark, Finland, Germany, Ireland, the Netherlands, Portugal, Slovakia, Spain and the UK (below 20 hours per week). Hungary, Latvia, Poland and Portugal seem to be taking a different direction in the sense that both the share of part-time work (in Latvia since 2010 and in Portugal since 2012) and the average working hours of part-timers are decreasing.
There are a variety of reasons why individuals take up part-time work. EU-LFS data list the following reasons:
£ ‘could not find a full-time job’ (35% of men and 25%
of women working part time in 2015);
£ ‘own illness or disability’ (6% of men and 4% of
women working part time in 2015);
£ ‘other family or personal responsibilities’ (11% of
men and 16% of women);
£ ‘looking after children or incapacitated adults’ (4%
of men and 26% of women);
£ ‘in education or training’ (17% of men and 7% of
women);
£ ‘other’.
A distinctive element is the considerable difference between men and women: for women, ‘looking after children or incapacitated adults’ and ‘other family or personal responsibilities’ have most importance, whereas being ‘in education or training’ and ‘could not find a full-time job’ are more important for men. While working part time can be seen as a tool to improve an individual’s work–life balance, in fact the EU-LFS data show that the share of those working part time because they ‘could not find a full-time job’ (also designated as involuntary part-time) has increased in the past decade for both men and women in the EU28 (Figure 9). This may have important detrimental repercussions on an individual’s career progression and earnings – and therefore pension value.
6 Note that the duration of working time also differed among the self-employed in 2015. Female self-employed had a shorter working time than their male counterparts (35.8 hours for women compared with 42.4 hours for men) (Figure 8). The same is true for the usual working time for self-employed with employees (46.5 hours) versus the self-employed without employees (36.9 hours).
7 In the EU-LFS, the full-time/part-time distinction in the main job is made on the basis of a spontaneous answer given by the respondent in all countries, except for Iceland, the Netherlands and Norway, where part-time is determined on the basis of whether the usual hours worked are fewer than 35, while full-time on the basis of whether the usual hours worked are 35 or more, and in Sweden where this criterion is applied to self-employed people as well. 8 According to the EU-LFS, part-time as a percentage of total employment in the EU15 increased from 16% in 1995 to nearly 24% in 2015 (from 5% to 11%
In addition, the EWCS data show that ‘short part-time’ (defined as up to 20 hours of work per week) is slowly becoming more important than ‘long part-time’ (between 21 and 34 hours of work per week). While short part-time could be an opportunity for some to re-enter the labour market or to adjust the balance between family responsibilities and work, working very short working hours is associated with lower earnings and with a reported preference for working longer hours. This suggests that this type of schedule might not necessarily be the preferred option for some of those practising it. Indeed, according to EWCS data, those working very short working hours are more likely to suffer from job insecurity and less likely to report good career prospects. On the other hand, they are more likely to report a better work–life balance, as well as finding it easier to take time off to attend to family and personal issues (Eurofound, 2016a, p. 56). According to EWCS data, the countries with the greatest growth in the share of short part-time work are:
£ Germany (from 10% in 2005 to 22% in 2015);
£ Austria (from 10% in 2005 to 18% in 2015);
£ Spain (from 8% in 2005 to 16% in 2015);
£ Poland (from 9% in 2005 to 14% in 2015);
£ Denmark (from 12% in 2005 to 16% in 2015).
Very long weekly and daily working hours
The reduction in the average usual working hours in the EU28 is also partially explained by the reduction in the share of individuals working beyond the weekly maximum of 48 hours stipulated in the Working Time Directive. This reduction, seen among both men and women according to EWCS data, is particularly
noticeable for the self-employed, to whom the directive does not apply; the proportion of the self-employed
working 48 hours or more per week dropped from nearly 50% in 2005 to less than 40% in 2015.
This development can be considered both significant and positive because not only are long hours associated with depression, anxiety, sleep disorders and coronary heart disease (see, for example, Bannai and Tamakoshi, 2014; Kivimäki et al, 2015), but they also make achieving a better work–life balance more difficult (see Chapters 4 and 7 for more details on this). The overview report of the sixth EWCS confirmed that ‘workers reporting long working hours are more likely to have problems with work–life balance and health than workers with standard working hours’ (Eurofound, 2016a, p. 56). The EWCS also asks workers how many times a month they work 10 hours or more a day. The general trend for both self-employed and employees (men and women) is that the share of those reporting working long days is decreasing, as well as the frequency with which people work more than 10 hours a day. Men reported working 10 hours or more a day, on average, four times per month in 2005 (1.9 times for women), compared to 3.1 times in 2015 (1.5 times for women).
Overall, the majority of workers in 2015 (more than 70% of employees and 50% of self-employed) stated they never work 10 hours or more a day. About 16% of employees and 18% of self-employed stated they work 10 hours or more a day one to four times a month, while 14% of employees and 32% of the self-employed said they do it five or more times in a month. The proportion of those stating that they work 10 hours or more a day 20 times a month or more is very low among employees (3.8% among men and 1.4% among women) – in contrast, it is worryingly high among the self-employed: 10% of female employed and 18.5% of male self-employed.
Figure 10 shows the proportion of employees in each Member State according to the number of times they reported working 10 hours a day or more over the period of a month. There is a north–south gradient: the further north countries are, the more likely it is that people declare they normally work 10 hours a day at least once a month. The largest variation is among those reporting that they normally work 10 hours or more per day between one and four times a month: from 7% to 8% in Bulgaria, Italy and Portugal to 30% or more in the Nordic countries. One explanation for this variation is the possibility that some employees have to work more hours on certain days in order to obtain more continuous free time. A high proportion of those employees who replied that they worked 10 hours or more a day between one and four times per month in countries such as Sweden (56%), Finland (48%) and Denmark (44%) reported that they can adapt their
Figure 9: Involuntary part-time employment as share of total part-time employment (%)
0 5 10 15 20 25 30 35 40 Women Men Source: EU-LFS 2006–2015
working hours within certain limits (through, for
example, flexitime).9
Working time distribution among
employees
Since the average weekly working time conceals large differences in the distribution of working time, working time was divided into five categories to take account of various forms of part-time work (short and part-time), various definitions of full-time work and very long
working hours (48 hours a week10or more) – see
Figure 11.
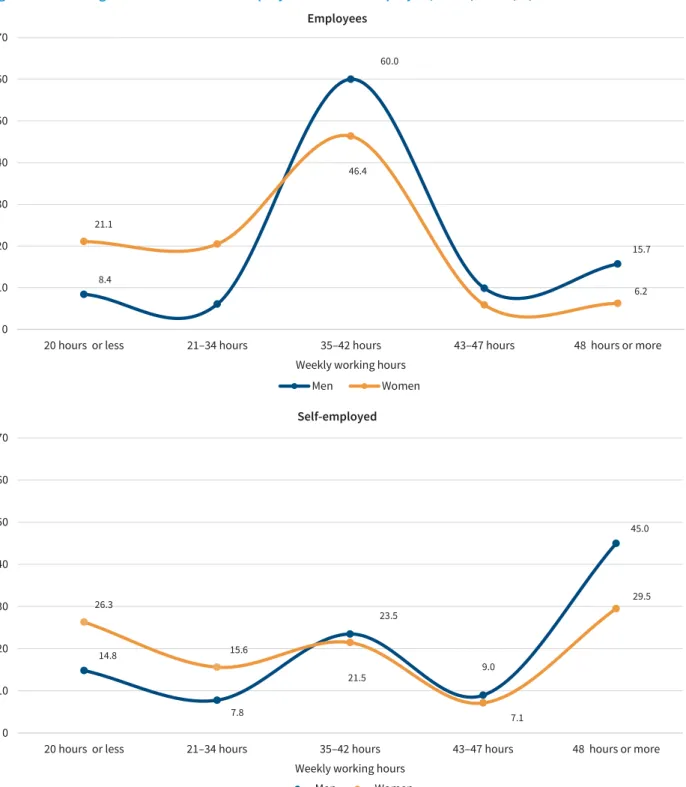
A significant proportion of male and female employees in the EU28 are concentrated around the 40 hours’ norm (60% and 46%, respectively). As also expected, the
dispersion of working time is higher among women than among men. Around 21% of female employees work on average fewer than 21 hours per week compared with only 8.4% of male employees. The share of employees working very long hours (48 hours or more) is notably high, with a significantly higher incidence of long working hours among male employees (15.7% compared with 6.2% among female employees) (Figure 11, upper panel).
In terms of country clusters, the concentration around the 40 hours’ norm (that is, 35–42 hours per week) is more pronounced in the Baltic countries and much less pronounced in the Anglo-Saxon countries, with a difference of about 26 percentage points between these two extremes (Figure 11, lower panel).
9 Flexitime is defined as the organisation of working hours in which employees can choose their starting and finishing hours within certain limits. 10 The choice of a 48 hours’ upper limit is related to the Working Time Directive, which requires EU Member States to guarantee employees the right of a
limit of weekly working hours, which must not exceed 48 hours on average including any overtime.
Figure 10: Employees working more than 10 hours a day by country, 2015 (%)
0 10 20 30 40 50 60 70 80 90 100
Never 1–4 times a month 5–9 times a month 10–19 times a month 20 times a month or more
There are large differences in the distribution of working time for male and female employees in the six country clusters (Figure 12). In the Central–Eastern and Baltic countries, the working time distribution of dependent male and female employees is rather similar – probably due to the resilience of a full-time working culture and a legacy from the communist era – with a high
concentration of men and women around the 40 hours’
norm (67% for both men and women in the Baltic countries, and 54% and 60% for men and women, respectively, in Central–Eastern countries). These clusters are different from the other clusters mainly in relation to the lower gender gap in weekly working time, the low incidence of female part-timers, and the relatively high share of both men and women working extremely long hours (48 hours or more).
Figure 11: Working time distribution for employees by sex (EU28) and country cluster, 2015 (%)
8.4 60.0 15.7 21.1 46.4 6.2 0 10 20 30 40 50 60 70
20 hours or less 21–34 hours 35–42 hours 43–47 hours 48 hours or more
Weekly working hours
Men Women
Source: EWCS 2015 (authors’ calculations)
Sex 9.5 66.9 18.7 16.7 41.0 14.4 11.4 7.6 14.6 10.6 0 5 10 15 20 25 30 35 40 45 50 55 60 65 70
20 hours or less 21–34 hours 35–42 hours 43–47 hours 48 hours or more
Weekly working hours
Baltic countries Continental countries
Central–Eastern countries Anglo-Saxon countries Northern countries Southern countries
Around 26% of male employees and 12% of female employees work at least 48 hours per week in the Central–Eastern countries, the corresponding figures for the Baltic countries being around 15% and 9%
(Figure 12). The finding that gender-specific differences in working hours are very small in both the Central–Eastern and the Baltic countries is remarkable, especially in view of the fact that the average female employment rate – particularly in the Baltic countries – is above 70% and given the relatively higher incidence of full-time dual-earner households (see Figure B1 in the Annex).
In the Northern countries cluster, the concentration of employees around the 40 hours’ norm is less
pronounced than in the Baltic countries: around 59% of men and 58% of women in the former compared with around 67% in the latter. Among female employees, the incidence of very long working hours is particularly low in the Continental and Northern countries, at 3.2% and 5%, respectively; the same is true for male employees with an incidence of 9.9% and 10.2 % respectively (Figure 12, lower panel). The proportion of employees working long hours is highest in the Central–Eastern
Figure 12: Working time distribution for employees in the country clusters by sex, 2015 (%)
11.8 66.8 9.2 25.7 40.5 3.2 59.7 12.2 25.6 35.7 6.5 13.2 57.9 5.0 20.3 49.2 6.4 0 5 10 15 20 25 30 35 40 45 50 55 60 65 70 75
20 hours or less 21–34 hours 35–42 hours 43–47 hours 48 hours or more
Weekly working hours
Baltic countries Continental countries Central–Eastern countries
Anglo-Saxon countries Northern countries Southern countries
11.3
Source: EWCS 2015 (authors’ calculations)
Female employees 6.6 67.1 8.7 67.3 9.9 54.0 26.0 7.9 46.2 22.1 9.6 59.4 10.2 60.8 14.9 -10 -5 0 5 10 15 20 25 30 35 40 45 50 55 60 65 70
20 hours or less 21–34 hours 35–42 hours 43–47 hours 48 hours or more
Weekly working hours
Baltic countries Continental countries Central–Eastern countries
Anglo-Saxon countries Northern countries Southern countries
countries (12.2% for female and 26.0% for male employees). Focusing now on the lower tail of the working time distribution, the share of women working short part-time is lowest in the Northern, Baltic and Central–Eastern clusters.
In the Anglo-Saxon countries cluster, the working time distribution appears to be less concentrated around the 40 hours’ norm and displays, in a cross-country
comparative perspective, a larger dispersion of working time. Furthermore, the gender disparities in working
time distribution and the gender polarisation of working time is clearly more pronounced, with nearly 26% of women working short part-time compared with 7.9% for men (Figure 12). The gender gap in the share of people working 35–42 hours is almost 11 percentage points (46.2% for men versus 35.7% for women). Also remarkable is the high incidence of men working very long hours (22.1%), which may in part be due to the weak and decentralised regulation of working time and the possibility for employees in the UK to partially opt out of the Working Time Directive.
Figure 13: Working time distribution of employees and self-employed, EU28, 2015 (%)
8.4 60.0 15.7 21.1 46.4 6.2 0 10 20 30 40 50 60 70
20 hours or less 21–34 hours 35–42 hours 43–47 hours 48 hours or more
Weekly working hours
Men Women
Source: EWCS 2015 (authors’ calculations)
Employees 14.8 7.8 23.5 9.0 45.0 26.3 15.6 21.5 7.1 29.5 0 10 20 30 40 50 60 70
20 hours or less 21–34 hours 35–42 hours 43–47 hours 48 hours or more
Weekly working hours
Men Women
Gender disparities in working time distribution appear even more pronounced in the Continental and Southern clusters. Female and male employees exhibit different working time patterns, with women overrepresented in the lower tail of the working time distribution. In these two country clusters, between 40% and 50% of female employees work part time while more than two-thirds of male employees work full time. The gender pattern of these two clusters is quite similar to the Anglo-Saxon one, apart from the incidence of long working hours which is significantly lower than in the other country clusters.
Working time distribution among the
self-employed
The distribution of working time of self-employed people differs dramatically from that of employees, in particular at the two ends of the distribution (Figure 13). While the working time of employees in the EU28 is clearly concentrated around the 40 hours’ norm, this applies to less than a quarter of self-employed people. The share of short part-timers and long working hours among the self-employed is significantly larger than among employees, implying a larger dispersion and polarisation of working time among self-employed people.
The incidence of long working hours is particularly high in the Central–Eastern country cluster, with almost half of self-employed people working at or above the 48
hours limit imposed by the Working Time Directive (Figure 14). The comparison between self-employed people and employees is a good illustration of the difference between regulation of working time by law or collective agreements and market-based regulation.
Working time patterns across the life
course
In general, the extent of labour market attachment varies significantly across the life course and in particular during the parenting phase. Previous empirical evidence has shown that the impact of young children living in the home, for example, on the supply of female labour varies significantly across countries (Anxo et al, 2007, 2011). In some countries, the presence of young children affects female labour force
participation through a definitive or temporary withdrawal from the labour market; in other countries, the impact of having young children essentially takes the form of a permanent or a temporary reduction in working time. Furthermore, in some countries such as in Italy, it may also be the case that the decision to cohabit or to marry affects female labour supply negatively (Anxo et al, 2011). In other words, there is a risk that the impact of changes in household composition over the life course on labour supply is underestimated in the EWCS sample of employed individuals, since these impacts are only observed at the extensive margin or, put another way, on the working time of employed people.
Figure 14: Working time distribution of self-employed by country cluster, 2015 (%)
28.3 19.9 19.9 41.1 48.4 21.7 27.1 15.7 34.2 34.1 18.4 39.3 0 5 10 15 20 25 30 35 40 45 50 55
20 hours or less 21–34 hours 35–42 hours 43–47 hours 48 hours or more
Weekly working hours
Baltic countries Continental countries Central–Eastern countries
Anglo-Saxon countries Northern countries Southern countries
Bearing these caveats in mind, this section now examines the working time profiles across the stylised life course of male and female employees. Figures 15 to 18 show the average weekly working time in the EU28 and for the six country clusters across the nine life stages.
The gender gap in working time profiles is important for the EU as a whole, with women working fewer hours than their male counterparts in each life stage (Figure 15). Female employees also exhibit a higher degree of variability in working time across their life course. Men’s working time, in contrast, appears to be less affected by the respective life stages, although Figures 15 to 18 indicate a slight tendency towards longer working time during the parenting phase. However, in the early stage of the life course, when individuals have few family/caring commitments, the gender gap is surprisingly large, amounting to 5 hours for single people living with their parents and 3.5 hours for young single people living on their own.
For the EU as a whole, women’s working time attains a peak during the phase of union formation (young cohabitating women without children), with the corresponding peak for men happening later on – when they have children aged between 7 and 12. Not
surprisingly, the largest gender gap in working hours occurs during the parenting phase. While on the whole, the reduction in working time for employed mothers is most important during the early phase of childhood, working time remains more or less consistently at a lower level as long as children are living in the
household. In contrast, the parenting phase for fathers is marked by a slight but continuous increase in working time. Independently of gender, working time starts declining again during the ‘empty nest’ phase of life and reaches a minimum level among older cohabiting couples without children in the home.
The working time profiles of employees differ significantly across the six country clusters
(Figures 16 to 18). Compared with cohabiting women without children, cohabiting women with pre-school children (under 7 years old) work 10 hours less per week in the Anglo-Saxon countries and 5 hours less per week in the Continental countries. With the exception of the Central–Eastern and Northern clusters, the gender gap in working time widens during this life stage.
Figure 15: Average weekly working hours for employees across the life course, by sex, EU28, 2015
36.6 39.8 41.3 30.4 30.9 35.5 31.7 32.3 27.0 0 5 10 15 20 25 30 35 40 45 50
I II III IV V VI VII VIII IX
Ho
u
rs
Life course stage
Men Women
Parenting phase
Note: I Single people (18–35 years), living with their parents or relatives; II Single people (under 46 years), without children; III Younger cohabiting couples (woman under 46 years), without children; IV Cohabiting couples with youngest children under 7 years; V Cohabiting couple with young children between 7 and 12 years; VI Cohabiting couple with teenage children between 13 and 18 years; VII Midlife ‘empty nest’ couples without resident children; VIII Older cohabiting couples without resident children; IX Single people (aged 50 years or older), without resident children.
The reduction in working time among mothers of young children (that is, 7–12 years) compared with
cohabitating women without children is significantly more marked in the Anglo-Saxon cluster (around 11
hours) and the Continental cluster (around 6 hours) (Figure 16), where part-time work among mothers tends to be more widespread.
Figure 16: Average weekly working hours across the life course for employees in the Anglo-Saxon and Continental clusters by sex, EU28, 2015
36.9 40.0 43.8 30.3 26.5 38.0 28.2 28.0 0 5 10 15 20 25 30 35 40 45 50
I II III IV V VI VII VIII IX
Ho
u
rs
Life course stage
Men Women
Parenting phase
Note: For a guide to life course stages, see the note to Figure 15. Source: EWCS 2015 (authors’ calculations)
32.7 39.1 39.9 28.3 32.7 34.4 29.5 28.8 23.1 0 5 10 15 20 25 30 35 40 45 50
I II III IV V VI VII VIII IX
Ho
u
rs
Life course stage
Men Women
Parenting phase
Anglo-Saxon countries