1
Development of passive flux samplers based on adsorption to estimate
greenhouse gas emissions from agricultural sources
Araceli D. Lariosabc, Stéphane Godboutb, Satinder Kaur Brara*, Joahnn H. Palaciosb, Dan Zeganb, Antonio Avalos-Ramírezad, Fabiola Sandoval-Salasac
a
Institut National de la Recherche Scientifique (INRS), Centre Eau, Terre & Environnement. 490, rue de la Couronne, Quebec (QC), G1K 9A9, Canada.
b
Institut de Recherche et de Développement en Agroenvironnement (IRDA). 2700 rue Einstein, Quebec (QC), GIP 3W8, Canada.
c
Instituto Tecnológico Superior de Perote. Km 2.5. Carretera Perote- México. Perote, 91270, México.
d
Centre National en Électrochimie et en Technologies Environnementales (CNETE). 2263, av. du Collège, Shawinigan (QC), G9N 6V8, Canada.
* Correspondence:
Dr. Satinder Kaur Brar, Professor,
Telephone: + 418 654 3116; Fax: + 418 654 2600, E-mail: [email protected]
2 Abstract
Passive flux samplers (PFSs) packed with adsorbents are used to estimate gaseous emissions. A key condition of their use is maintaining a linear relationship between internal and external air velocities. The performance of PFSs designs depends on the characteristics of the adsorption bed and on the sampler design. The parameters required to enable PFSs to estimate greenhouse (GHG) emissions from agricultural sources were studied. The effect of the particle size of the adsorbent used as collector medium was analyzed theoretically using the Ergun equation. Three orifice plates with 0.5, 0.7 and 1 mm bore diameter were evaluated in order to determine the most appropriate diameter to control air flow through a new passive flux sampler (PFS) prototype while maintaining adequate linearity between internal and external air velocity. The effect of the adsorbent bed thickness (19, 50, 100 and 200 mm) on the internal-external air velocity relationship in the PFS was evaluated. The best performance was obtained using the 0.7 mm orifice plate and an adsorbent bed thickness of 50 mm. Spherical adsorbents with high adsorption capacity are recommended in order to decrease the adsorbent bed thickness and improve sampling performance. A series of experiments showed that the estimated mass flow obtained by the developed PFS was close to the confidence interval of values obtained by direct detection. Thus, the developed PFScan be used as a tool for the estimating of GHG emissions from agricultural sources.
Keywords: greenhouse gases; emissions; passive flux samplers; adsorbents; internal-external
3
Nomenclature Symbols
L Adsorbent bed thickness (m or mm)
ρ Air density (kg m-3)
Qin Airflow rate through the passive flux sampler (ml min-1) vo Air velocity in the orifice plate (m s-1)
Aorifice Area of the orifice plate (m2)
Ɛ Bed porosity
D Diameter of the pipe (mm)
C Discharge coefficient dependent on Reynolds number
CD Drag coefficient
FD Drag force on the passive flux sampler (N) µ Dynamic viscosity of the fluid (kg m-1 s-1)
Y Expansion factor
Vex External velocity (m s-1)
K Internal- external velocity ratio or sampler proportionality constant
Vo Internal velocity (m s-1)
F Mass flux (g m-2 s-1)
m Mass of the target gas collected in the passive flux sampler (g)
Co Orifice plate constant d Orifice plate diameter (mm)
Dp Particle diameter (m)
∆P Pressure drop (Pa)
ΔPo Pressure drop across the orifice plate (Pa)
ΔPD Pressure drop downstream of the passive flux sampler (Pa)
Ap Projected area of the passive flux sampler with respect to the air flow
direction (m2)
r Radius of the internal orifice (m)
β Ratio between orifice and tube diameter (d/D)
Δt Sampling time (s)
vs Superficial velocity or velocity in the empty tube (m s-1)
Abbreviations
NH3 Ammonia
GHG Greenhouse gas N2O Nitrous oxide
CH4 Methane
PFS Passive flux sampler PFSs Passive flux samplers PVC Polyvinyl chloride
4 1. Introduction
Estimating greenhouse gas (GHG) emissions from agricultural sources encounters several obstacles. For example, there are substantial spatial and temporal variations among sources, and most of the methodologies available require complex and expensive equipment making it difficult to sample a significant number of farms (Larios et al., 2016; Wang et al., 2016). In order to estimate emissions accurately, it is necessary to use precise, reproducible, robust and economic methods (Berndt & Tomkins, 2013; FAO, 2014). In this context, passive flux sampling has been recommended as a robust technique for measuring gaseous emissions because it needs few operational requirements and needs low capital investment (Godbout, Phillips, & Sneath, 2006; Mosquera, 2003; Scholtens, Hol, Wagemans, & Phillips, 2003). This technique has been applied to estimate NH3 emissions by using sampler made with glass tubes coated with oxalic
acid which allowed absorption of the target gas (Leuning, Freney, Denmead, & Simpson, 1985; Schjoerring, Sommer, & Ferm, 1992). For GHG emissions, the use of passive flux samplers (PFSs) has high potential, but studies on their application are rare. The PFSs normally used for estimating emissions consist of a packed tube containing an adsorbent as a collector medium. This is based on two principles: 1) the aerodynamic behavior which requires that the air velocity inside the PFS is proportional to the velocity of the air surrounding the sampler, and 2) the adsorption capacity of the collector medium to capture the gas sample. The adsorption capacity generally depends on the air flow rate passing through the sampler, the gas concentration in the inlet air, and the mass of the adsorbent used (Godbout et al., 2006; Larios et al., 2017). In previous research, several adsorbents used to capture N2O and CH4 were evaluated. For example,
Godbout et al. (2006) found that zeolite 5A in powder form was found the best adsorbent to collect N2O compared to activated carbon Carboxen 1018 and Carboxen 1021. Results for the
5
collection of CH4 on these three molecular sieves showed low adsorption capacity and rapid
saturation of the bed. Some PFSs prototypes were developed but limitations related to the air flow through PFSs, the adsorbent mass contained in the PFSs and manufacturing costs were identified (Gaudet et al., 2005; Godbout et al., 2006; Palacios, 2010).
Depending on the adsorption capacity of the adsorbent and sampling requirements, PFSs may require long adsorbent beds to enable representative sampling times. Adsorbent beds with smaller particle size have a higher surface area relative to equivalent to the mass of adsorbents with a larger particle size (Zielinski & Kettle, 2013). However, long adsorbent beds and small particle size may generate substantial energy losses in the air flow (Wilkes, 2006) because the adsorbent bed reduces the air velocity inside the PFSs (Liu, Afacan, & Masliyah, 1994), and this consequently affects the internal (Vo), the external velocity (Vex) and the ratio between the two
velocities, known as the K-factor (Scholtens et al., 2003). Thus, the pressure drop (∆P) of the air flow through a packed bed must be experimentally or theoretically evaluated. The Ergun equation is frequently used to predict ∆P. This equation expresses that ∆P is given by the sum of viscous and kinetic energy loss as a function of fluid and bed characteristics (Niven, 2002; Xu & Jiang, 2008).
However, the value of the K-factor value changes as a function of sampling design. This includes the diameter of the orifice plate placed inside the PFS, the orifice plate diameter/diameter of the pipe (d/D) ratio (β) and the adsorbent bed thickness (L). In this case, the K-factor needs to be determined experimentally. In this context, the objective of this work was to study and define the parameters determining the development of PFSs based on adsorption to estimate GHG emissions from agricultural sources. The GHG used in this study as a reference was N2O and
6
adsorption capacity for N2O as compared to other adsorbents (Godbout et al., 2006; Groen,
Pérez-Ramírez, & Zhu, 2002; Peng et al., 2009; Saha, Bao, Jia, & Deng, 2010). The best performance of a PFS as a function of the adsorbent particle size, the bore diameter of the orifice plate placed in the PFS, β ratio and the adsorbent bed thickness were determined. The characteristics of PFSs used to estimate GHG emissions from agricultural sources are discussed.
2. Materials and Methods
2.1. Adsorbent material
Zeolite 5A (DelSORB, Delta adsorbents Inc. Roselle, IL, USA) was used as an adsorbent medium in passive flux sampler prototypes. The characterization of the adsorbent comprised the evaluation of surface area, the pore volume, and the pore diameter was reported previously (Larios et al., 2016). The particle size for spherical and powder zeolite was taken from the specifications given by the product manufacturer as follows: 1.6 to 2.5 mm for spherical form and from 18.5 to 25 µm for powder form.
2.2. Theoretical evaluation of pressure drop in PFS
The Ergun equation was used to evaluate the effect of adsorbent particle size on the pressure drop (∆P) produced when the air flows through a PFS packed with powder or spherical zeolite 5A. The Ergun equation includes two terms as shown in Eq. (1). The first term represents the viscous energy losses, and the second represents the kinetic energy losses.
∆𝑃 =
150𝜇𝑣𝑠𝐿 𝐷𝑝2 (1−𝜀)2 𝜀3+
1.75𝐿𝜌𝑣𝑠2 𝐷𝑝 1−𝜀 𝜀3 Eq. (1)where ∆P is the pressure drop (Pa), µ dynamic viscosity of the fluid (kg m-1 s-1), vs superficial
velocity or velocity in the empty tube (m s-1), L adsorbent bed thickness (m), Dp particle diameter (m), Ɛ bed porosity and ρ fluid density (kg m-3).
7
Air velocity through an adsorbent bed with an estimated cross-sectional area of 0.016 m2 was calculated by using typical air flow rates values at which PFSs are exposed (from 10 to 150 ml min-1 and ∆P calculated by Eq. (1) considering the conditions described in Table 1.
2.3 Aerodynamic evaluation of a PFS
2.3.1 Effect of the orifice plate diameter on PFS performance
A PFS prototype was constructed on PVC using 19 mm-diameter tubes with a length of 200 mm as shown in Fig. 1. In this experiment, the PVC tube was left empty in order to analyze the effect of the orifice plate diameter on performance of PFSs. An orifice plate was installed at the end of the PFS by means of a polybutylene straight connector (McMaster-Carr, Aurora, OH, USA) to regulate the air flow rate. Three diameters of the orifice plate were tested (0.5, 0.7 and 1 mm). The effect of the orifice plate on the aerodynamic behavior of the PFS design was evaluated by carrying out tests in a wind tunnel and “in line” tests to calculate the internal-external velocity ratio. In the first method, the PFS was placed inside a wind tunnel constructed from two 203 mm diameter and 1.53 m long galvanized mild steel ducts. A square made with galvanized sheets was installed inside the tunnel to streamline the air flow. The wind speed (Vex) in the tunnel was
varied from 1 to 7 m s-1 by a radial ventilator (RVK, Motors and Ventilators Inc., QC, Canada). The ΔP from the air flow through the PFS was measured using a digital differential pressure sensor (Sensirion AG, model ASP1400, Stäfa, Switzerland) and the sensiView software version 2.32 (Sensirion AG, Stäfa, Switzerland). The tests were performed by using compressed air. The air flow rate through the PFS (Qin) was measured using a mass flow meter model FMA-A2303
(Omega Engineering Inc., Norwalk, CT, USA). The value of Qin was varied in order to produce
ΔP in the range from 0.2 to 24 Pa. ΔP was measured with the same digital differential pressure sensor used in wind tunnel tests as described previously. The power relationship between Qin and
8
ΔP was analysed in order to obtain the regression equation used to calculate the air flow rate
through the PFS when it is exposed to different air velocities, as the relationship between flow and pressure involves a square root. Next, Qin was calculated in order to correspond to the ΔP
interval obtained from the tunnel tests at different air velocities. Thus, Qin values were used to
estimate the air velocity in the orifice plate (vo) (vo = Qin/Aorifice). The sampler proportionality
constant (K factor) was then calculated from the internal-external velocity ratio. Equations 2 to 5 were used for this analysis (Leuning et al., 1985).
∆𝑃𝐷 = ∆𝑃𝑜 Eq. (2) where 2 2 1 ex D P D D C v A F P = = ρ ∆ Eq. (3) and 2 2 2 4 2 1 2 1 1 o O o O v C v YC B P = − ρ = ρ ∆ Eq. (4) Thus, ex ex O D o v Kv C C v = = Eq. (5) and t K r m F ∆ = 2 π Eq. (6)
In Eqs. 2 to 5, ΔPD is the pressure drop downstream of the PFS (Pa), FD is the drag force on the
PFS (N), CD is the drag coefficient, ρ is the air density (kg m-3),
V
ex is the external air velocity(m s-1), ΔPo is the pressure drop across the orifice plate (Pa), B is the ratio between orifice and
tube diameter (di/d). Y is the expansion factor, which is unity when pressure is close to atmospheric pressure, C is the discharge coefficient dependent on Reynolds number,
v
o is the air9
velocity through the orifice (m s-1), Co is the orifice constant and K is the sampler constant. K is
used in Eq. (6), which enables the mass flux of the gas emitted by a source to be estimated. F is the mass flux (g m-2 s-1), m is the mass of the target gas collected in the PFS (g), r is the radius of the internal orifice (m) and Δt is sampling time (s).
2.3.2 Effect of the adsorbent bed thickness on the PFS performance
The effect of the thickness of the adsorbent bed on PFS performance was studied using the PFS prototype made with PVC tube (Fig. 1). In this case, an orifice plate with a 0.7 mm opening diameter was used. The length of PVC tube was adjustable to allow varying adsorbent bed length. Four adsorbent bed thicknesses of 19, 50, 100 and 200 mm of spherical zeolite 5A were evaluated. The effect of the adsorbent bed thicknesses on the aerodynamic behavior of the PFS was evaluated as explained in section 2.3.1.
2.3.3 Development and evaluation of a new PFS prototype design
Taking into account previous results, a new PFS prototype was made using three consecutive cartridges fabricated from stainless steel tubes as shown in (Fig. 2). The dimensions of the central cartridge were 1.6 mm internal diameter, 2.2 mm external diameter, and 108 mm length. Two additional cartridges of 1.2 mm internal diameter, 1.6 external diameters and 82.5 mm in length were placed at each end. The tubes were connected by push-connectors of polysulfone plastic (Watts Water Technologies Inc., North Andover, MA, USA). The PFS prototype was packed with 13.6 g of zeolite 5A in the central cartridge, which was used to adsorb N2O, and
with 6 g of silica gel in the first cartridge in order to adsorb water from the air inlet. The third cartridge was left empty. The adsorbent material in each tube was retained by means of a stainless steel wire cloth disc and a stainless steel internal ring placed in a bore at 3 mm from each end of the tubes. The tubes were connected by lightweight push-to-connect fitting for
10
copper tube straight connectors made of polysulfone plastic (Watts Water Technologies Inc., North Andover, MA, USA). Additionally, a glass filled Nylon connector reducer (McMaster-Carr, Aurora, OH, USA) was installed at the entrance of the sampler. A similar reducer was installed at the other end to connect the sampler to an orifice plate of 0.71 mm (McMaster-Carr, Aurora, OH, USA) by means of a polybutylene straight connector. The aerodynamic behavior of this new PFS was evaluated as explained in section 2.3.1.
2.4 Statistical analysis
An ANOVA test was applied to evaluate the difference in pressure drop, air flow rate and internal and external velocity ratio as a function of the orifice plates bore diameter and adsorbent bed thickness. A multiple linear regression analysis was applied to analyze the linear relation among the adsorbent bed thickness, external and internal air velocity. R statistical software version 3.1.3 for Windows was used to perform these analyses. Also, Microsoft Excel software was used to plot and analyze the relationship between the pressure drop, air flow rate, internal and external velocities in each series of experiments.
3. Results and Discussion
3.1 Effect of particle size on the pressure drop of the air flowing through the adsorbent bed The effect of the adsorbent particle size on the ∆P of the air flowing through an adsorbent bed of 0.108 m is presented in Table 2. The ∆P produced by zeolite in powder form was considerably higher than the spherical form. Thus, zeolite 5A, in powder form, produced higher resistance to air flow for all the air velocities tested in the wind tunnel. Results show that the kinetic energy losses are lower than the viscous energy losses (calculated from the Ergun equation). This indicates that the air flow regime inside the sampler was laminar and the ∆P of the air flowing
11
through the adsorbent bed was mainly produced by the friction of air with the surface of adsorbent particles. Thus, thesecond term in the Ergun equation can be considered as negligible. Although adsorbents with smaller particle size have larger surface area relative to the equivalent mass of adsorbents with a larger particle size (Zielinski & Kettle, 2013), the adsorbents with spherical form were used as collector medium in order to decrease the ∆P of the air flowing through the PFS.
3.2Aerodynamic performance of PFSs
3.2.1 Effect of the orifice plate bore diameter on the air flow behavior in PFSs
As explained earlier, the use of an orifice plate regulates the amount of air flowing through the sampler. Thus, results from the evaluation of three bore diameters (0.5, 0.7 and 1 mm) are presented in Fig. 3. This figure shows the relationship between the air flow rate (Qin) and the ∆P.
Results show that for similar ∆P0.5 (from 0.3 to 22 Pa), the air flow rate through the PFS increased when increasing the orifice plate diameter. For example, the air flow was significantly restricted with the orifice plate of 0.5 mm as compared to the orifice plate of 0.7 and 1mm. This is because when the airflow moves through the orifice plate, a ∆P is produced as a function of the air velocity, the transversal area to the air flow rate and the β ratio (d/D), such as exposed by Reader-Harris (2015). For smaller β and orifice plate diameters, the air flow will be significantly restricted. β ratios for each of the orifice plates varied from 0.04 to 0.09 (Table 3) and were less than the typical β ratio found in pipelines. Also, Table 3 shows the Reynolds number and the flow regime obtained from the evaluation of each of the orifice plates. It shows that the flow regime was laminar in the case of a bore diameter of 0.5 mm while the flow regime was changing from laminar to turbulent for the other two bore diameters. This was because, at lower external air velocity, viscous forces (air flow resistance) are greater than kinetic forces (fluid
12
velocity) allowing a laminar flow regime to be established in the sampler. By contrast, the increase in external air velocity led to a change of the flow regime which moved from laminar to turbulent flow.
The relationship between the air flow rate and external air velocity is shown in Fig. 4. It shows that the inlet air flow rate was a function of the orifice plate size. With a bore diameter of 0.5 mm, the air flow rate was almost entirely restricted when the PFS was exposed to external air velocities less than 2 m s-1. This effect decreased with bore diameter. Statistical analysis indicated a significant difference of the inlet air flow rate through the PFS as a function of the bore diameter (α < 0.05). The results suggest that a bore diameter of 0.5 mm enabled lower Qin to be reached in the PFS, but this condition limits the sampler to adequately collecting gas only at low air flow rates.
3.2.2 Effect of the orifice plate bore diameter on the performance of PFSs
Table 4 shows that the orifice plate of 0.5 mm produces the lower internal-external air velocity ratio (0.17) and a low linear proportionality (R2 = 0.86) was obtained. Thus, the principle of the proportionality, that is required for the proper functioning of a PFS, was not reachedwhen this orifice was used. The results showed that orifice plates of 0.7 and 1 mm had better aerodynamic performance since the internal-external air velocity relationship presented a higher linear correlation coefficient (R2 = 0.97). Although the linear correlation coefficient values were relatively high in all the cases (ranging from 0.86 to 0.97), the power regression equation better described the internal-external air velocity relationship with higher correlation coefficient values (0.99). This was attributed to the characteristics of the flow regime developed within a PFS which changed as a function of air velocity. Regression equations indicated that the internal air
13
velocity decreased as a function of the orifice size due to the higher frictional losses produced when the orifice plate diameter was decreased. It was shown that orifice plates of 0.7 and 1 mm presented a good aerodynamic performance for the PFS, but the orifice of 0.7 mm was preferred because it reduced the air flow rate providing a longer sampling time.
3.2.3 Effect of the adsorbent bed thickness on the performance of PFSs
The effect of the adsorbent bed thickness on the air flow rate through the prototype PFS was evaluated. Fig. 5 shows ∆P as a function of Qin and bed thickness. Results indicated that for the
range of bed thickness tested, the ∆P was not affected by this parameter (α = 0.05). This suggests that the resistance to air flow rate was mainly produced by the orifice plate and not by the adsorbent bed. The effect of the adsorbent bed on internal-external velocity ratio is shown in Table 5. The internal air velocity decreased with respect to the adsorbent bed thickness according to Darcy’s law, which indicates that the air velocity through the bed of solid particles is inversely proportional to the thickness of the bed (Richardson, Harker, & Backhurst, 2002). Results indicated that the internal air velocity was not directly proportional to the adsorbent bed thickness. For example, the velocities for bed thicknesses of 19 and 50 mm did not show significant differences (α < 0.05), being similar to that for thicknesses of 100 and 200 mm. The linear regression analysis indicated that the internal-external velocity ratio was of around 0.8 and 0.7 when the bed thickness was in the range from 19 to 50 mm and from 100 to 200 mm, respectively (Table 5). It was estimated that at external air velocities < 1 m s-1, the internal air velocity tended to zero, as the adsorbent bed thickness increases. This behavior can be explained by the phenomena observed at low air velocities where the viscous forces from the friction of air flowing through the adsorbent bed particles and the orifice plate are higher than kinetic forces (Richardson et al., 2002). In order to explain simultaneously the linear relationship among the
14
adsorbent bed thickness (L), external (Vex) and internal (Vo) air velocity, a multiple linear regression model was derived. According to the values shown in Eq. (7), the external air velocity produced the greatest effect on the internal air velocity in the PFSs although the multiple linear regression models results showed that the effect of the adsorbent bed thickness was also significant (α < 0.05). The multiple R-squared of the model was 0.94 with a p-value of 2.2x10⁻¹⁶.
𝑉𝑜 = −0.34 − 0.06L + 0.94 𝑉𝑒𝑥 (7) 3.3 Development and evaluation of a PFS prototype
Considering the previous results, and the conditions under which the PFS must be exposed, a new PFS prototype was constructed using consecutive cartridges as explained in section 2.3.3. The aerodynamic performance of this PFS configuration is shown in Fig. 6 where the internal-external velocity ratio (factor K) was 0.85. This value was within the expected interval because, as explained in sections 3.2.2 and 3.2.3, the diameter of the orifice plate and the adsorbent bed characteristics significantly influenced the K factor. Figure 6 also shows that the linear correlation between internal-external velocities was appropriate (R2 value ~0.95). This linear correlation was slightly lower than those obtained in PFS based on absorption (R2 value ~ 0.99) due to the effect of the adsorbent bed on the air flow through PFS (Mosquera, Scholtens, & Ogink, 2003; Scholtens et al., 2003).
The performance of the new PFS was validated by the estimating of the mass flow of N2O
released from two rooms of an experimental farm as a function of sampling time from 1.5 to 3.75 h (Figure 7). Results showed that the mass collected on the PFS increased with respect to time. An appropriate precision of the collection of N2O in the PFS was observed when the experiment
15
estimate the mass flow of N2O released in each room. After about 1.5 h of sampling, the mass
flow estimated by PFSs was near to the confidence interval of values as compared to the direct detection. The difference observed between the PFS results and the direct detection values was around 12 % under the conditions used (Larios et al., 2017).
This new PFS design can be easily unassembled to change the adsorbent material between sampling. The design permits cleaning of all components to satisfy the biosecurity conditions. The PFS manufacturing cost was around $350 CAN per sampler. This cost was calculated taking into account the price of assembling only four PFS. Nevertheless, the new PFS can be used several times without replacing any part. Thus, results suggested that the new PFS can be used as a tool to determine GHG emissions from agricultural sources. According to our knowledge, there are no commercially available PFSs based on adsorption that can be used for the estimating GHGs. Results from this study can, therefore, be considered as reference for the development of sampling devices where the collection by adsorption may take place.
4. Conclusions
The analysis of aerodynamic parameters determining the performance of PFSs developed for the estimation of GHG emissions from agricultural sources showed that the ratio between the orifice plate diameter to that of the pipe (d/D), also known as β ratio, as well as the diameter of the orifice plate, are the key parameters for the control of air flow rate through the PFSs. According to the aerodynamic behavior of the PFS prototype, orifice plates with a diameter greater than 0.5 mm or designed with a β ratio greater than 0.06 provide appropriate regulation of air flow rate. As the adsorbent bed thickness increases, the internal/external velocity ratio of the air flow decreases. The linear relationship between these parameters was gradually affected, mainly with
16
adsorbent bed thickness greater than 50 mm. Adsorbents in powder form produce higher pressure drop than spherical form. Therefore, adsorbents in spherical form with high adsorption capacity are preferred in order to decrease the air flow rate restrictions inside the PFS. Taking into account the approximate manufacturing cost of the PFS prototype developed in this work, PFS based on adsorption can be suggested as tools for estimating GHG emissions from agricultural sources.
5. Acknowledgements
Our sincere thanks go to Agriculture and Agri-Food Canada for the financial support by means of the Agricultural Greenhouse Gases Program (AGGP). Authors would like to thank the Program for the Professional development of Professors (Prodep-Mexico) for the grant to perform the research stage and the FRQNT (research-college grant) for the financial support.
6. References
Berndt, A., & Tomkins, N. W. (2013). Measurement and mitigation of methane emissions from beef cattle in tropical grazing systems: a perspective from Australia and Brazil. animal, 7(Supplements2), 363-372. doi:DOI:10.1017/S1751731113000670
FAO. (2014). Agriculture's greenhouse gas emissions on the rise. Retrieved from
http://www.fao.org/news/story/en/item/216137/icode/
Gaudet, E., Godbout, S., Marquis, A., Sneath, R., Phillips, R., & Lemay, S. (2005). Passive Flux Sampler for Measuring Nitrous Oxide and Methane Emissions from Agricultural Sources. Paper presented at the Canadian Society for Bioengineering, CSBE05072. https://csbe- scgab.ca/publications/meeting-papers/csbe-technical-conferences/4788-passive-flux-sampler-for-measuring-nitrous-oxide-and-methane-emissions-from-agricultural-sources
Godbout, S., Phillips, V., & Sneath, R. (2006). Passive flux samplers to measure nitrous oxide and methane emissions from agricultural sources, Part 1: Adsorbent selection. Biosystems engineering, 94(4), 587-596.
Groen, J. C., Pérez-Ramírez, J., & Zhu, W. (2002). Adsorption of nitrous oxide on silicalite-1. Journal of Chemical & Engineering Data, 47(3), 587-589.
Larios, A. D., Brar, S. K., Avalos-Ramírez, A., Godbout, S., Sandoval-Salas, F., & Palacios, J. H. (2016). Challenges in the measurement of emissions of nitrous oxide and methane from livestock sector. Reviews in Environmental Science and Bio/Technology, 15(2), 285-297.
Larios, A. D., Brar, S. K., Avalos-Ramírez, A., Godbout, S., Sandoval-Salas, F., Palacios, J. H., . . . Giroir-Fendler, A. (2017). Parameters determining the use of zeolite 5A as collector medium in passive
17 flux samplers to estimate N2O emissions from livestock sources. Environmental Science and Pollution Research, 24(13), 12136-12143.
Leuning, R., Freney, J. R., Denmead, O. T., & Simpson, J. R. (1985). A sampler for measuring atmospheric ammonia flux. Atmospheric Environment (1967), 19(7), 1117-1124. doi:DOI:
http://dx.doi.org/10.1016/0004-6981(85)90196-9
Liu, S., Afacan, A., & Masliyah, J. (1994). Steady incompressible laminar flow in porous media. Chemical engineering science, 49(21), 3565-3586.
Mosquera, J. (2003). Guidelines for the use of passive flux samplers (PFS) to measure ammonia emissions from mechanically ventilated animal houses: IMAG -(Rapport 2003-13/ Wageningen-UR, Instituut voor Milieu- en Agritechniek).
Mosquera, J., Scholtens, R., & Ogink, N. (2003). Using passive flux samplers to determine the ammonia emission from mechanically ventilated animal houses. Paper presented at the 2003 ASAE Annual Meeting.
Niven, R. K. (2002). Physical insight into the Ergun and Wen & Yu equations for fluid flow in packed and fluidised beds. Chemical Engineering Science, 57(3), 527-534. doi:10.1016/s0009-2509(01)00371-2
Palacios, J. H. (2010). Improvement of passive flux sampler for the measurement of nitrous oxide (N2O). (Maîtrise en Génie Agroalimentaire), Université Laval, Québec.
Peng, Y., Zhang, F., Xu, C., Xiao, Q., Zhong, Y., & Zhu, W. (2009). Adsorption of nitrous oxide on activated carbons. Journal of Chemical & Engineering Data, 54(11), 3079-3081.
Reader-Harris, M. (2015). Orifice Design Orifice Plates and Venturi Tubes (pp. 33-76): Springer International Publishing.
Richardson, J., Harker, J., & Backhurst, J. (2002). Flow of fluids through granular beds and packed columnsChemical Engineering, Particle Technology and Separation Processes (Vol. 2, pp. 191-236). doi:0 7506 4445 1
Saha, D., Bao, Z., Jia, F., & Deng, S. (2010). Adsorption of CO2, CH4, N2O, and N2 on MOF-5, MOF-177, and zeolite 5A. Environmental science & technology, 44(5), 1820-1826.
Schjoerring, J., Sommer, S. G., & Ferm, M. (1992). A simple passive sampler for measuring ammonia emission in the field. Water, air, and soil Pollution, 62(1-2), 13-24.
Scholtens, R., Hol, J., Wagemans, M., & Phillips, V. (2003). Improved passive flux samplers for measuring ammonia emissions from animal houses, Part 1: Basic principles. Biosystems engineering, 85(1), 95-100.
Wang, X., Ndegwa, P. M., Joo, H., Neerackal, G. M., Harrison, J. H., Stöckle, C. O., & Liu, H. (2016). Reliable low-cost devices for monitoring ammonia concentrations and emissions in naturally ventilated dairy barns. Environmental pollution, 208, Part B, 571-579.
doi:http://dx.doi.org/10.1016/j.envpol.2015.10.031
Wilkes, J. O. (2006). Flow in Chemical engineering equipment. In P. H. P. T. Reference (Ed.), Fluid mechanics for chemical engineers (pp. 194-210).
Xu, R. N., & Jiang, P. X. (2008). Numerical simulation of fluid flow in microporous media. International Journal of Heat and Fluid Flow, 29(5), 1447-1455. doi:10.1016/j.ijheatfluidflow.2008.05.005 Zielinski, J. M., & Kettle, L. (2013). Physical Characterization: Surface Area and Porosity. Retrieved from
file:///C:/Users/lariosad/Downloads/IntertekWhitepaper_Surface_Area_and_Porosity_Chemical s170613.pdf
18 Figures list
Fig. 1 Diagram of the PFS prototype
Fig. 2 Prototype PFS based on adsorption for the estimation of GHG emissions
Fig. 3 Pressure drop (∆P) in the PFS as a function of air flow rate and the orifice plate bore diameter
Fig. 4 Relationship between Vex and Qin through the PFS as a function of the orifice plate diameter
Fig. 5 Relationship between Qin and √∆P in the PFS as a function of the adsorbent bed thickness Fig. 6 Internal-external air velocity ratio and Qin in a new PFS prototype packed with silica gel and zeolite 5A
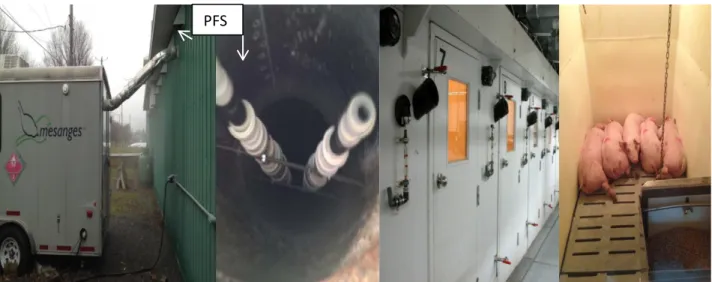
Fig. 7 Research facility where the prototype PFS were evaluated at experimental scale (Irda- Deschambault, QC, Canada)
Table list
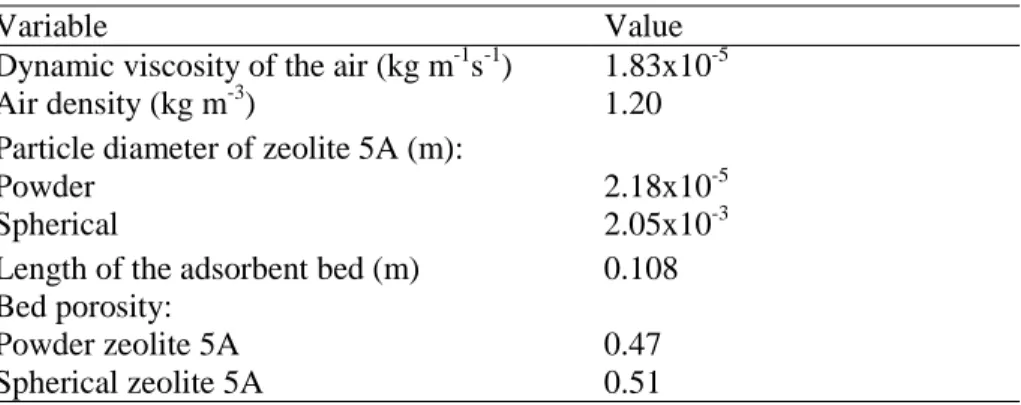
Table 1 Conditions used to evaluate the ∆P through the PFS using the Ergun equation
Table 2 Adsorbent form effect on the pressure drop of the air flow passing through passive flux sampler
Table 3 Parameters related to the aerodynamic behavior of the PFS
Table 4 Regression analysis from the evaluation of internal-external velocity ratio as a function of the orifice plate diameter
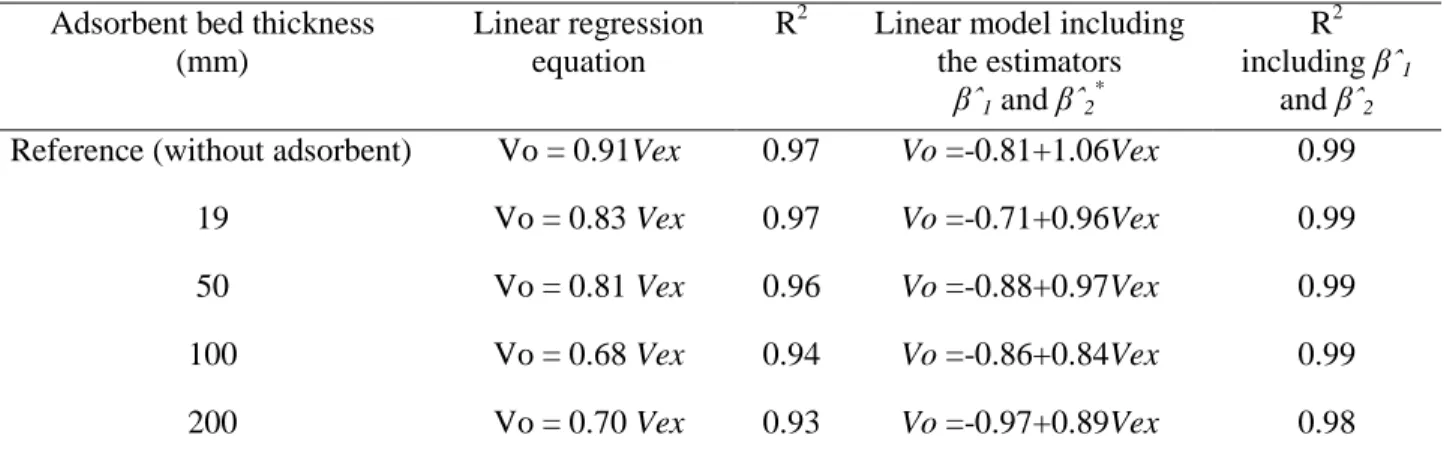
Table 5 Regression analysis from the evaluation of the effect of the adsorbent bed thickness on the internal-external velocity ratio
19
Fig. 1 Diagram of the PFS prototype.
Fig. 2 Prototype PFS based on adsorption for the estimation of GHG emissions (S= caps; A= cartridge connectors; 1, 2, 3 = cartridge to adsorbents; OP=orifice plate).
20
Fig. 3 Pressure drop (∆P) in the PFS as a function of the air flow rate and the orifice plate bore diameter.
Fig. 4 Relationship between Vex and Qin through the PFS as a function of the orifice plate diameter. y = 0.29x R² = 0.78 y = 0.03x R² = 0.97 y = 0.01x R² = 0.98 0 1 2 3 4 5 6 0 20 40 60 80 100 120 140 160 180 200 220 240 260 280 300 320 340 ∆P ^ 0 .5 ( P a) Qin (ml min-1) 0.5 mm 0.7 mm 1.0 mm 0 20 40 60 80 100 120 140 160 180 200 220 240 260 280 300 320 340 0 1 2 3 4 5 6 7 8 Qi n ( ml min -1) Vex (m s-1) 1mm 0.7 mm 0.5mm
21
Fig. 5 Relationship between Qin and the √∆P in the PFS as a function of the adsorbent bed thickness.
Fig. 6 Internal-external air velocity ratio and Qin in PFS prototype packed with silica gel and zeolite 5A. 0,0 0,5 1,0 1,5 2,0 2,5 3,0 3,5 4,0 4,5 5,0 0 10 20 30 40 50 60 70 80 90 100 110 120 130 140 150 160 170 ∆P ^0.5 ( Pa ) Qin (ml min-1) 19 mm 50 mm 100 mm 200 mm Vo = 0.85Vex R² = 0.95 0 20 40 60 80 100 120 140 160 180 0 1 2 3 4 5 6 7 8 0 1 2 3 4 5 6 7 8 Qi n ( ml min -1 ) Vo (m s -1) Vex (m s-1) Vo Qin
22
Fig. 7 Research facility where the prototype PFS were evaluated at experimental scale (Irda- Deschambault, QC, Canada).
23
Table 1 Conditions used to evaluate ∆P through the PFS with the Ergun equation.
Variable Value
Dynamic viscosity of the air (kg m-1s-1) 1.83x10⁻⁵ Air density (kg m-3) 1.20 Particle diameter of zeolite 5A (m):
Powder Spherical
2.18x10⁻⁵ 2.05x10⁻³ Length of the adsorbent bed (m) 0.108 Bed porosity:
Powder zeolite 5A Spherical zeolite 5A
0.47 0.51
Table 2 Adsorbent form effect on the pressure drop of the air flow passing through a passive flux sampler. Adsorbent form Superficial velocity x 10 -2 (m s -1) Viscous energy losses (Pa) from Eq. 1 (1st term) Kinetic energy x 10 -3 (Pa) from Eq. (1) (2nd term) ∆𝑃 (Pa) Spherical 0.1 0.1 0.0 0.1 0.2 0.2 0.2 0.2 0.3 0.4 0.4 0.4 0.5 0.6 0.9 0.6 0.6 0.8 15 0.8 0.8 1.0 26 1.0 1 1.2 38 1.3 Powder 0.1 1208.3 27 1208.4 0.2 3299.1 201 3299.3 0.3 5555.0 569 5555.6 0.5 8108.5 1212 8109.7 0.6 10496.2 2031 10498.2 0.8 13623.6 3422 13627.1 1 16586.0 5072 16591.1
24
Table 3 Parameters related to the aerodynamic behavior in PFS.
Orifice plate bore diameter (mm)
β ratio (d/D) Reynolds number Flow regime
0.5 0.045 From 29 to 1100 laminar
0.7 0.062 From 370 to 5250 from laminar to turbulent 1.0 0.089 From 460 to 5000 from laminar to turbulent
Table 4 Regression analysis from the evaluation of internal-external velocity ratio as a function of the orifice plate diameter.
Orifice plate bore diameter (mm) Linear regression equation R2 Power regression equation R2 1.0 Vo = 0.89 Vex 0.97 Vo = 0.58 Vex 1.26 0.99 0.7 Vo = 0.91 Vex 0.97 Vo = 0.52 Vex 1.32 0.99 0.5 Vo = 0.17 Vex 0.86 Vo = 0.035 Vex 1.92 0.99
Table 5 Regression analysis from the evaluation of the effect of the adsorbent bed thickness on the internal-external velocity ratio.
Adsorbent bed thickness (mm)
Linear regression equation
R2 Linear model including the estimators
βˆ1 and βˆ2*
R2 including βˆ1
and βˆ2 Reference (without adsorbent) Vo = 0.91Vex 0.97 Vo =-0.81+1.06Vex 0.99
19 Vo = 0.83 Vex 0.97 Vo =-0.71+0.96Vex 0.99
50 Vo = 0.81 Vex 0.96 Vo =-0.88+0.97Vex 0.99
100 Vo = 0.68 Vex 0.94 Vo =-0.86+0.84Vex 0.99
200 Vo = 0.70 Vex 0.93 Vo =-0.97+0.89Vex 0.98