© The Author(s) 2018. Published by Oxford University Press on behalf of the British Occupational Hygiene Society.
Original Article
Development of and Selected Performance
Characteristics of CANJEM, a General Population
Job-Exposure Matrix Based on Past Expert
Assessments of Exposure
Jean-François Sauvé
1,2, Jack Siemiatycki
2,3, France Labrèche
1,3,4,
Lesley Richardson
2, Javier Pintos
2, Marie-Pierre Sylvestre
2,3, Michel Gérin
1,
Denis Bégin
1, Aude Lacourt
5, Tracy L. Kirkham
6, Thomas Rémen
2,
Romain Pasquet
2,3, Mark S. Goldberg
7,8, Marie-Claude Rousseau
2,3,9,
Marie-Élise Parent
2,3,9and Jérôme Lavoué
1,2,*
1
Department of Environmental and Occupational Health, School of Public Health, Université de Montréal, 2375,
chemin de la Côte Ste-Catherine, Montréal, Québec, H3T 1A8, Canada;
2Centre de recherche du CHUM, 850,
rue St-Denis, Montréal, Québec, H2X 0A9, Canada;
3Department of Social and Preventive Medicine, School
of Public Health, Université de Montréal, 7101, avenue du Parc, Montréal, Québec, H3N 1X9, Canada;
4Institut
de Recherche Robert-Sauvé en Santé et en Sécurité du Travail, 505, Boul. de Maisonneuve Ouest, Montréal,
Québec, H3A 3C2, Canada;
5Bordeaux Population Health Research Center, Team EPICENE, Université de
Bordeaux, UMR 1219, 146 rue Léo Saignat, 33076 Bordeaux Cedex, France;
6Dalla Lana School of Public Health,
University of Toronto, 155 College Street, Toronto, Ontario, M5T 3M7, Canada;
7Department of Medicine, McGill
University, 1650 Cedar Avenue , Montréal, Québec, H3G 1A4, Canada;
8Division of Clinical Epidemiology, McGill
University Health Centre, 1650 Cedar Avenue, Montréal, Québec, H3G 1A4, Canada;
9INRS-Institut
Armand-Frappier, Université du Québec, 531 Boul. des Prairies, Laval, Québec, H7V 1B7, Canada
*Author to whom correspondence should be addressed. Tel: +1-514-343-6111-#3108; fax: +1-514-343-2200; e-mail: jerome.lavoue@ umontreal.ca
Submitted 22 December 2017; revised 3 May 2018; editorial decision 15 May, 2018; revised version accepted 20 May 2018.
Abstract
Objectives: We developed a job-exposure matrix called CANJEM using data generated in
popula-tion-based case–control studies of cancer. This article describes some of the decisions in developing CANJEM, and some of its performance characteristics.
Methods: CANJEM is built from exposure information from 31 673 jobs held by study subjects
included in our past case–control studies. For each job, experts had evaluated the intensity, fre-quency, and likelihood of exposure to a predefined list of agents based on jobs histories and descrip-tions of tasks and workplaces. The creation of CANJEM involved a host of decisions regarding the
doi: 10.1093/annweh/wxy044 Advance Access publication 12 June 2018 Original Article
structure of CANJEM, and operational decisions regarding which parameters to present. The goal was to produce an instrument that would provide great flexibility to the user. In addition to describ-ing these decisions, we conducted analyses to assess how well CANJEM covered the range of occu-pations found in Canada.
Results: Even at quite a high level of resolution of the occupation classifications and time periods,
over 90% of the recent Canadian working population would be covered by CANJEM. Prevalence of exposure of specific agents in specific occupations ranges from 0% to nearly 100%, thereby provid-ing the user with basic information to discriminate exposed from unexposed workers. Furthermore, among exposed workers there is information that can be used to discriminate those with high expos-ure from those with low exposexpos-ure.
Conclusions: CANJEM provides good coverage of the Canadian working population and possibly
that of several other countries. Available in several occupation classification systems and including 258 agents, CANJEM can be used to support exposure assessment efforts in epidemiology and pre-vention of occupational diseases.
Keywords: exposure assessment methodology; job-exposure matrix; retrospective exposure assessment
Introduction
Assessing exposure to occupational chemical and physical agents in community-based studies needs to represent the diversity of occupations and workplaces found in the population, often over decades. Due to scarcity of historical measurements job-exposure matrices (JEMs) were developed to reconstruct lifetime occupational exposures in these studies (Siemiatycki et al., 1981; Hoar, 1983; Gérin et al., 1985; Stewart and Stewart, 1994; Siemiatycki, 1996; Teschke et al., 2002).
Very few multi-occupation, multiagent generic JEMs are currently in use. Notable examples include the French MATGÉNÉ system (Févotte et al., 2011), currently con-taining exposure information for 17 agents, and the Finnish FINJEM (Kauppinen et al., 1998; Kauppinen et al., 2014), covering 74 agents (including psychosocial, physiological, and ergonomics factors). FINJEM has also been adapted in other countries (Kauppinen et al., 2009; García et al., 2013; van Tongeren et al., 2013). While not JEMs per se, the CAREX and CAREX-Canada systems also provide population-based exposure information for several known or suspected carcinogens (Kauppinen et al., 2000; Peters et al., 2015).
Recently, Siemiatycki and Lavoué presented an overview of the CANJEM JEM (Siemiatycki and Lavoué, 2018), a new general population JEM cover-ing 258 agents for the period 1930–2005. CANJEM is based on a database of individual expert evaluations of over 30 000 jobs (>8000 subjects) accumulated through four large population-based case–control studies in the Montreal metropolitan area and other Canadian cities.
This article describes the technical development of CANJEM, starting with the pooling of exposure data from the four individual studies, to the definition of JEM dimensions and computation of exposure indices, as well as a descriptive summary of the resulting JEM and an evaluation of its coverage of the Canadian population.
Methods
Case–control study data
The Montreal case–control studies
CANJEM was developed from occupational exposure data generated in the process of conducting four case– control studies in the Montreal area in the 1980s and 1990s. Study 1 (conducted 1979–1986) investigated 19 cancer sites among men aged 35–70 years (3726 cancer patients and 533 population controls) (Siemiatycki et al., 1987). Study 2 (1996–2001) was a study of lung cancer and included men and women aged 35–75 years (1205 cases and 1541 controls) (Ramanakumar et al., 2007). Study 3 (1996–1997) was a study of postmenopausal breast cancer among women aged 50–75 years (608 cases and 667 controls) (Labrèche et al., 2010). Study 4 (2000–2004) was a study of brain tumors, represent-ing the Quebec and Ontario portions of the multicentric INTEROCC study (Lacourt et al., 2013), and included men and women aged 30–59 years (218 cases and 414 controls). In all studies, incident cases were actively recruited from pathology departments of hospitals in the Montréal area, while population controls were selected randomly from electoral lists (Studies 1, 2, and 4) or from women diagnosed with other cancers (Study 3) and frequency-matched to cases by age and sex.
Exposure assessment methods
The exposure assessment method used in all four stud-ies has been described previously (Gérin et al., 1985; Siemiatycki et al., 1991). Briefly, complete occupational his-tories including job titles, employment duration, tasks per-formed, work environment, products, and equipment used were collected from extensive face-to-face or telephone interviews. Proxy respondents (generally spouses) provided occupational histories when subjects were unable to do so.
A team of trained experts in chemistry and industrial hygiene, unaware of the case–control status of subjects, reviewed the occupational histories to classify each job ever held according to standardized occupation and industry codes. Exposures to a predefined list of 294 chemical, physical, and biological agents, including mix-tures and broad chemical families, were then attributed to each job. Experts split and/or combined consecutive jobs that were assumed to be relatively homogenous in expos-ure over time. A job was considered exposed to a given agent if the agent was present in the workplace at levels above those in the general (nonoccupational) environ-ment. The experts rated exposure for each combination of job and agent according to three dimensions: reli-ability, intensity, and frequency of exposure. Relireli-ability, or the expert’s confidence that the exposure occurred, was rated as possible, probable, or definite. Intensity of exposure, based on the average level during the period of exposure, was rated as low, medium, or high. These levels were applied on a relative scale by agent (and not explicitly defined on quantitative concentration levels), where low represented a concentration above the back-ground environmental level, and high was generally used for occupations and processes associated with the high-est levels encountered in the work environment, such as sandblasting for crystalline silica (Vida et al., 2010). Lastly, frequency of exposure was rated in Study 1 using the following categories: <5%, 5–30%, and ≥30% of the workweek, representing <2 h, 2–12 h, and ≥12 h out of a typical 40-h workweek. In Studies 2–4, experts attrib-uted the number of hours per week exposed for each of the three intensity ratings. For example, a given job could have an exposure profile defined by 20 h per week at low intensity, 20 at medium, and none at high. In all stud-ies, each job was evaluated by two experts, and consen-sus was used to resolve disagreements in the exposures assigned. Periodic reviews were also conducted to ensure consistency in the assessments.
Development of CANJEM
Standardized occupational and industrial classifications
In developing CANJEM, the occupation and industry coding was extended, so that each of the 30 000 jobs
was independently coded into the same four occupation classification and the same three industry classification systems used in Canada, North America, and inter-nationally. These classifications and their hierarchical coding structures are presented in Table 1.
The coding of job and industry titles into each clas-sification was carried out by a team of trained experts using the original job descriptions and initial codes, official documentation, and a purpose-built tool avail-able online (http://www.caps-canada.ca). A systematic reliability assessment of the occupation and industry classification codes assigned by the experts was not per-formed; however, a limited inter-rater agreement study based on 1000 jobs showed performances similar to those reported in t’ Mannetje and Kromhout (2003).
Chemical and physical agents
A total of 258 agents were coded in all four studies and included in the CANJEM database. These were listed and defined by Siemiatycki (1991). They are described in detail on the CANJEM project’s website at http://www. canjem.ca, and descriptive statistics are available from http://expostats.ca/chems. The agents cover a wide range of compounds and can be specific chemicals (e.g. phos-gene, styrene, ozone), mixtures (e.g. gasoline, coal dust), groups based on use (e.g. pesticides, cleaning agents), chemical classes (e.g. lead compounds, aromatic amines), or physical agents (radio and microwave, ionizing and ultraviolet radiation).
Exposure indices of individual jobs
Constructing the database involved pooling data from jobs evaluated in four studies conducted over a 25-year period. Changes in the way the intensity and frequency of exposure were expressed between studies occurred over time; thus, we associated each exposed job with the following pooled indices, derived from each study-specific information (Table 2): intensity (low, medium, high), reliability (possible, probable, definite), frequency (<2 h, 2–12 h, 12 to <40 h, and ≥40 h per week). Lastly, we developed frequency-weighted intensity (FWI), a con-tinuous index that combines intensity and frequency. For each exposed job or agent pair in the database, the inten-sity level (using quantitative scores for low, medium, and high) was multiplied by the proportion of hours exposed relative to a 40-h workweek. By integrating categorical intensity and frequency of exposure into a single con-tinuous metric, FWI can facilitate the computation of cumulative exposure across jobs over time for subjects included in retrospective epidemiological studies.
Regarding the scores applied to the low-, medium-, and high-intensity levels, our experts indicated that there
were no fixed and universal guidelines to assign these categories and that the quantitative meaning of these levels varied somewhat from agent to agent. The relative quantitative levels might follow a 1:2:3 ratio for some agents, or a steeper trend such as 1:10:100 for others. It was impossible to nail down different ratios specific to each of the 258 agents, so the experts agreed that the ratio 1:5:25 based on a lognormal distribution of
exposure levels appeared to be the best estimate of the relative meaning of low:medium:high for most situations and was retained for the computation of FWI.
CANJEM dimensions
One CANJEM cell represents a combination of three dimensions: either occupational or industrial classifica-tion, time period, and agent (Fig. 1). For the occupation/ Table 1. Standardized occupation and industry classifications and levels of resolution available in CANJEM.
Classification Resolution Level Number of groups
in classification (A) Occupations
International Standardized Classification (ISCO), 1968a,b 1 digit Major group 8
2 digits Minor group 81
3 digits Unit group 282
5 digits Occupation 1504
Canadian Classification and Dictionary of Occupations (CCDO), 1971c 2 digits Major group 23
3 digits Minor group 81
4 digits Unit group 500
7 digits Occupation 7907
Canadian National Occupational Classification (NOC), 2011d 1 digit Division 10
2 digits Major group 40
3 digits Minor group 140
4 digits Unit group 500
United States Standardized Occupational Classification (SOC), 2010e 2 digits Major group 23
3 digitsf Minor group 97
5 digits Broad occupation 461 6 digits Detailed occupation 840 (B) Industries
International Standard Industrial Classification (ISIC) revision 2, 1968g,h 1 digit Major division 9
2 digits Division 33
3 digits Major group 71
4 digits Group 159
Canadian Standardized Industrial Classification (SIC), 1980i 1 digit Division 18
2 digits Major group 76
3 digits Minor group 318
4 digits Unit group 860
North American Industry Classification System (NAICS), 2012j 2 digits Sector 20
3 digits Subsector 102
4 digits Group 323
5 digits Industry 711
6 digits Canadian industry 922
aInternational Labour Office (ILO) (1969).
bIncludes Armed Forces as a category in each level of resolution. cDominion Bureau of Statistics (1970).
dStatistics Canada (2012a). eU.S. Bureau of Labor Statistics (2014).
fLevel includes two 4-digit codes: 15-11 (computer occupations) and 51-51 (printing workers). gMajor division 0 (Activities not Adequately Defined) and nested subgroups omitted. hUnited Nations (1971).
iStatistics Canada (1980). jStatistics Canada (2012b).
industry dimension, CANJEM is available in one of four occupational and three industrial standardized clas-sifications separately. For each classification, exposure estimates are provided across a range of resolutions from the most detailed categories (e.g. 5-digit codes for the 1968 International Standardized Classification of Occupations, or ISCO’68) to broader groupings (e.g. 2-digit ISCO’68 codes), as listed in Table 1.
Regarding the second axis (time period), we were faced with two competing tendencies. As shorter periods were defined, the specificity and validity of the informa-tion would increase, but the number of observainforma-tions in each cell would decrease. Thus, to accommodate dif-ferent possible levels of resolution of time periods and occupational or industrial classifications, we produced several versions of CANJEM using a single global period (1930–2005), two periods (1930–1969, 1970–2005) to reflect changes in the organization of occupational health and safety in Canada starting in the 1970s (Verma, 1996), and four time periods (1930–1949, 1950–1969, 1970–1984, and 1985–2005). CANJEM can be searched with any of those three schemes. Finally, the agent axis includes the 258 agents described previously.
CANJEM, rather than a single JEM, therefore rep-resents a set of JEMs, each defined by the choice of a particular occupation or industry classification and its associated resolution, a time period scheme (1, 2, or 4), and an agent. The process of selecting a specific version of CANJEM is illustrated in Figure 1.
Exposure indices in each cell
Each cell in a particular version of CANJEM provides an estimated probability of exposure, and, for exposed jobs, the reliability, intensity, frequency, and FWI of exposure
(Table 2). These indices are calculated by summarizing information from all individual jobs in the pooled data-base associated with the cell. A job was included in a period when the employment dates covered at least 1 year in the time period. Jobs with an employment period straddling two or more time periods can there-fore contribute to multiple time periods.
The probability of exposure is the proportion of jobs in a given cell that were considered exposed to the agent of interest, and ranges from 0 to 100%. Exposed jobs were defined as having a frequency of exposure of at least 30 min per week, a reliability level of “possible” or greater, and a FWI of at least 0.05, which corresponds to 2 h per week at low intensity.
Each cell also provides the distribution of exposed jobs (as relative frequencies) across each categorical rat-ing for reliability (possible, probable, definite), intensity (low, medium, high), and frequency (<2 h, 2 to <12 h, 12 to <40, and ≥40 h per week) of exposure. Estimates for the continuous index of FWI are provided as median and arithmetic mean values across exposed jobs in the cell.
For each JEM, all cells for which one job or more were available in the pooled exposure database are included. The selection of a specific minimum sample size per cell is to the CANJEM users’ discretion.
Descriptive analyses of CANJEM
Coverage of the Montreal and Canadian populations
Since CANJEM is based on data generated from a fixed set of real subjects in our past studies, it cannot be assumed that CANJEM has exposure estimates avail-able for every occupation or industry at any level of resolution. We therefore conducted analyses to describe the extent of coverage of CANJEM for the Montreal Table 2. Exposure indices of individual jobs in the pooled exposure database and indices of the CANJEM cells.
Index Format
Indices in the pooled exposure database
Exposure status Binary (exposed/unexposed)
Reliabilitya Categorical (possible, probable, certain)
Intensitya Categorical (low, medium, high)
Frequencya Categorical (<2 h, 2 to <12 h, 12 to <40, ≥40 h per week)
FWIa Continuous
Indices in CANJEM cells
Probability Percentage (proportion of jobs exposed among all jobs)
Reliability Categorical (relative frequencies of exposed jobs with possible, probable and certain reliability) Intensity Categorical (relative frequencies of exposed jobs with low, medium and high intensity) Frequency Categorical (relative frequencies of jobs exposed <2 h, 2–12 h, 12–40, and 40+ h per week) FWI Continuous (median and arithmetic average of exposed jobs)
aAvailable for exposed jobs only.
and Canadian populations at two different times rep-resented in the 1986 Census of Canada (Statistics Canada, 1989) and the 2011 National Household Survey (Statistics Canada, 2016). CANJEM versions
used were based on the Canadian classification spe-cific to each census, namely the 4-digit level of the 1971 Canadian Classification and Dictionary of Occupations (CCDO) for the 1986 census, and 4-digit level of the Figure 1. Illustration of the organization of the CANJEM system, using the JEM based on 5-digit ISCO’68 codes and a single time period as an example.
2011 National Occupational Classification (NOC) for the 2011 census. For illustrative purposes, the CANJEM versions used in the analysis had a minimum sample size per cell of 10, and all time period schemes were tested. The proportion of individuals employed in occupations covered by the JEMs, relative to the total number of individuals employed in each population (Canada and Montreal), was then computed.
Probability of exposure and average FWI
To present a descriptive analysis of the information contained in CANJEM, we used the ISCO’68 classifi-cation, commonly used in occupational epidemiology (t’ Mannetje and Kromhout, 2003), with 5-digit codes, a single time period (1930–2005) and a minimum sam-ple size per cell of 10. The analysis focused on the prob-ability of exposure and average FWI of cells by agent, the latter restricted to cells with a minimum probability of 5% to exclude data from occupations with rare or unusual exposure to a given agent.
Results
Some indicators of exposure prevalence and other exposure parameters
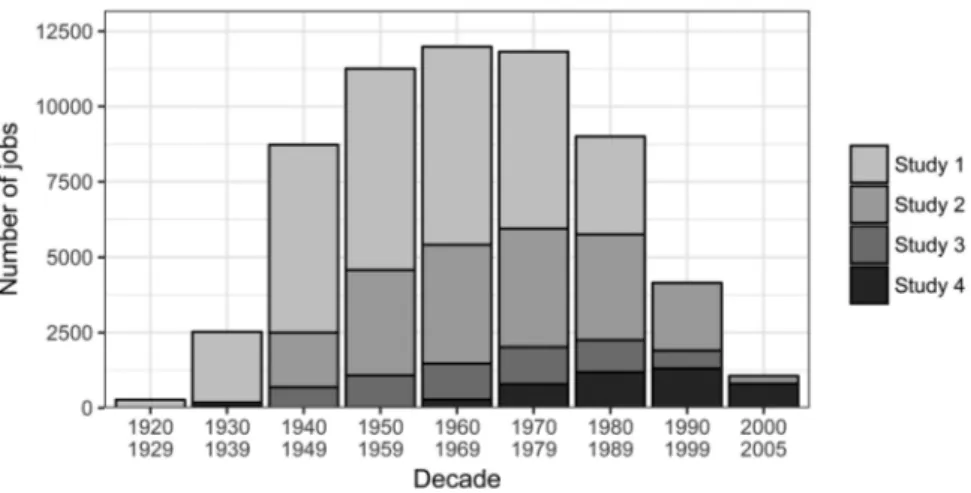
The pooled database contained information on a total of 31 673 jobs held by 8760 subjects between 1930 and 2005. Also, 15 067 (47.5%) jobs were collected during Study 1, followed by Study 2 (n = 10 371, 32.7%), Study 3 (n = 3510, 11.1%), and Study 4 (n = 2725, 8.6%). Figure 2 presents the distribution of jobs by decade stratified by study.
Of the 31 673 jobs included in the database, 22 763 (71.9%) were exposed to at least one of the 258 agents. The agent for which we identified the largest number of
exposed jobs in our database was polycyclic aromatic hydrocarbons (PAHs) from any source (n = 7651, 24.2% of all jobs). Several associated agents such as PAHs from hydrocarbons, engine emissions, and carbon monoxide also had some of the largest number of exposed jobs, as listed in Table 3.
The majority (62%) of exposed job or agent combi-nations had a “definite” reliability level, compared with 27% for “probable” and 11% for “possible.” Forty-eight percent had a frequency in the range of 2 to <12 h per week; relative frequencies for the remaining categories were 7% for <2 h, 18% for 12 to <40 h, and 28% for ≥40 h per week, the latter consisting mainly of expos-ure 40 h per week (87%). For intensity, more than half of the exposed job/agent combinations had low inten-sity (58%), compared with 34% for medium and 8% for high intensity. Table 3 lists the 15 agents with the larg-est number of exposed jobs in the pooled database and their distribution by reliability, intensity, and frequency of exposure. A listing of the full set of 258 agents accom-panied by descriptive summaries of the exposure data is available from http://expostats.ca/chems.
Agents with the highest probability of exposure and average FWI
The probability of exposure was ≥5%, a criterion used to define a particular cell as “exposed” (i.e. involving exposure for at least some workers), for 13 960 (11.6%) of CANJEM cells defined by 5-digit ISCO’68 codes with at least 10 jobs (n = 467), a single time period, and 258 agents. The median probability of exposure across this subset of 13 960 cells was 13.4% (interquartile interval 7.7–30.0%, range 5–100%). Table 4 presents the expo-sure profiles for the 15 agents with the highest propor-tion of exposed cells, and for the 15 agents with the
Figure 2. Number of jobs in the pooled exposure database by decade of employment, stratified by source study. Since a job with a period of employment covering more than one decade was included in each time period category, the cumulative total is greater than 31 673.
highest FWI based on the median value of average FWI of exposed cells. The overall proportion of jobs exposed and number of 5-digit ISCO occupations with at least 5% of jobs exposed for each of the 258 agents are avail-able from http://expostats.ca/chems. Agents with the highest proportion of exposed cells were associated with low frequency and intensity of exposure. Conversely, the 15 agents with the highest average FWI values had rela-tively few exposed cells.
Coverage of the Montreal and Canadian populations
Using data from the 1986 Census of Canada and the 1971 Canadian Classification and Dictionary of Occupations (4-digit codes) version of CANJEM, the proportions of the Montreal working population cov-ered by JEMs defined with 1, 2, or 4 periods were 93%, 86%, and 68%, respectively. For the Canadian working population, coverage for the same JEMs was slightly lower with 91%, 81%, and 63%, respectively. Using the data from the most recent census (2011) and the 2011 National Occupational Classification version (NOC) of CANJEM (4-digit codes), the proportion of the working population covered by the JEMs with 1, 2, and 4 time periods were 91%, 76%, and 53% for the Montreal population, and 90%, 76%, and 52% for the Canadian population. As an illustration of the
influence of the criterion of minimum sample size per cell (set at 10 for this calculation), the previous num-bers are changed to the following when choosing a minimum of five jobs per cell: 95%, 86%, and 63% for the Montreal population, and 94%, 86%, and 64% for the Canadian population. As for the influ-ence of occupational resolution, when using the 3-digit NOC codes the numbers (with minimum sample size at 10) are changed to 100%, 95%, and 83% for both the Montreal and Canadian populations.
Discussion
Occupational exposure assessment is a challenging aspect of population-based studies due to the diversity of work-places and work conditions that need to be evaluated with limited information. To address this, our group developed in the 1980s a method based on the collection of detailed job descriptions and their translation into exposure esti-mates to hundreds of agents by trained experts (Gérin et al., 1985). This method, although providing exposure estimates specific to the intricacies of each job held by each subject, is very costly (an estimated 50 expert years were used across the four studies) and probably inaccessible to the vast majority of researchers. In creating CANJEM, we aggregated expert evaluations accumulated over several Table 3. Number of and crude proportion of exposed jobs, proportion of exposed jobs stratified by reliability and inten-sity rating, and modal frequency of exposure across exposed jobs for the 15 most prevalent agents in the pooled expo-sure database.
Agent No. exposed
jobs (% of total)a
Reliability (% of jobs)b Intensity (% of jobs)b Frequency (h/week)
Possible Probable Certain Low Medium High Modal category (% of jobs)b
PAHs from any source 7651 (24%)a 11.8 14.2 73.9 68.8 23.7 7.5 2 to <12 (34.3%)
PAHs from petroleum 5903 (19%) 4.5 14.6 80.9 69.7 23.5 6.8 12 to <40 (36.3%) Engine emissions 5816 (18%) 4.7 13.1 82.2 43.2 50.4 6.3 12 to <40 (50.6%) Organic solvents 5696 (18%) 7.2 21.2 71.7 35.1 51.5 13.4 2 to <12 (55.6%) Carbon monoxide 5298 (17%) 3.4 12.7 83.9 78.4 19.5 2.1 12 to <40 (42.9%) Lead compounds 4211 (13%) 4.7 13.7 81.5 83.5 15.4 1.1 12 to <40 (49.6%) Alkanes (C5–C17) 4056 (13%) 6.4 25.8 67.8 33.4 51.4 15.2 2 to <12 (51.2%) Aliphatic aldehydes 4047 (13%) 31.1 38.3 30.6 86.7 12.8 0.5 ≥40 (51.2%) Mononuclear aromatic hydrocarbons 3842 (12%) 6.4 21.7 72 62.3 32.8 4.9 2 to <12 (47.9%) Cleaning agents 3564 (11%) 3.5 12.4 84.1 71.7 18.1 10.2 2 to <12 (69.3%) Formaldehyde 3390 (11%) 33.4 46.0 20.6 86.4 13.0 0.6 ≥40 (49.3%) Alkanes (C18+) 3350 (11%) 6.8 23.0 70.1 49.8 33.5 16.7 ≥40 (40.5%) Metallic dust 3309 (10%) 6.3 25.0 68.7 52.5 41.0 6.5 ≥40 (51.2%) Iron 2869 (9%) 5.3 21.3 73.4 47.8 42.1 10.1 ≥40 (47.1%)
Diesel engine emissions 2667 (8%) 21.4 26.4 52.2 58.8 35.5 5.7 2 to <12 (42.4%)
aPercentage of exposed jobs relative to all jobs in the CANJEM database (n = 31 673). bPercentage of exposed jobs by category relative all exposed jobs by agent.
decades into a format usable by other researchers in epi-demiological and other public health investigations.
Coverage of the Montreal and Canadian populations
CANJEM was constructed from jobs held by participants enrolled in our studies. Since these represent a sample of
the population, some combinations of occupations/indus-tries and periods may not be represented in our data, as opposed to other JEMs created by assigning exposures to a list of all occupations in a population, such as FINJEM (Kauppinen et al., 1998) and MATGÉNÉ (Févotte et al., 2011). Nevertheless, we found very good coverage of the Canadian working population as represented in Table 4. Fifteen agents with the largest proportion of cells with probability of exposure of 5% or greater, and highest average FWI of exposure; CANJEM based on 5-digit ISCO’68 codes and period 1930–2005.
Agent Probability Intensity Frequency FWId
Cells with P≥5% (%)a Median (%)b Low (%)c Medium (%)c High (%)c Median (h/week) Mean Highest proportion of cells with probability ≥5%e
PAHs from any source 71.1f 30.5 69.1 23.7 7.3 25.0 1.00
Organic solvents 63.4 30.2 34.2 52.2 13.6 5.0 1.07
PAHs from petroleum 58.7 23.2 70.1 23.4 6.5 20.8 0.92
Alkanes (C5–C17) 53.7 18.8 32.4 52.2 15.4 6.0 1.32
Carbon monoxide 53.1 20.0 79.3 18.7 2.0 19.0 0.68
Aliphatic aldehydes 50.7 16.3 88.0 11.7 0.3 25.0 0.73
Mononuclear aromatic hydrocarbons 50.5 20.8 62.0 33.2 4.8 11.3 0.84
Engine emissions 49.3 15.0 41.9 51.6 6.5 9.8 0.97 Alkanes (C18+) 48.6 20.0 48.5 34.5 17.1 15.3 1.22 Lead compounds 47.5 17.7 83.8 15.3 0.9 10.2 0.57 Formaldehyde 41.1 15.4 87.9 11.7 0.4 28.8 0.73 Metallic dust 37.0 30.8 50.5 42.3 7.1 16.0 1.43 Nitrogen oxides 35.8 13.5 83.4 16.3 0.4 22.7 0.65 Benzo[a]pyrene 35.8 14.6 76.6 17.3 6.2 23.0 0.92 Iron 35.1 21.6 46.3 43.4 10.4 20.5 1.49
Highest average FWI, median across cells with probability ≥5%
Nitroglycerine 0.4 5.8 0.0 14.3 85.7 40.0 13.31
Coke dust 1.9 10.0 30.0 25.0 45.0 45.0 10.12
RDX (cyclonite) 0.2 5.4 50.0 0.0 50.0 40.0 9.52
Coke combustion products 2.6 9.5 24.0 24.0 52.0 48.0 5.97
Tobacco dust 1.1 6.7 22.6 41.9 35.5 40.0 5.65
Fur dust 2.1 10.2 23.1 41.5 35.4 40.0 5.47
Trinitrotoluene 0.6 6.2 35.7 7.1 57.1 40.0 5.00
Sodium hydrosulphite 0.2 63.6 14.3 57.1 28.6 2.5 4.79
Coal tar and pitch 4.9 8.1 9.4 42.4 48.2 4.0 4.50
Leather dust 4.7 19.3 64.0 28.5 7.4 40.0 3.10
Coal dust 7.5 9.1 19.1 20.2 60.7 22.8 2.84
PAHs from coal 15.2 9.5 29.1 49.3 21.6 20.4 2.69
Coal combustion products 9.9 9.8 35.6 51.7 12.7 35.0 2.60
Chlorine dioxide 0.9 24.7 26.7 73.3 0.0 31.3 2.45
Wool fibres 8.8 35.5 60.9 35.6 3.4 40.0 2.27
aAverage FWI, median value of cells with probability of exposure ≥5%. bCANJEM cells based on a minimum of 10 jobs (n = 467). cProportion of cells (out of 467) with probability of exposure ≥5%. dMedian probability across cells with probability of exposure ≥5%.
eProportion of jobs by categorical intensity ratings across cells with probability of exposure ≥5%.
fExposure parameter used to sort agents is denoted in bold.
two national surveys conducted 25 years apart (1986 and 2011), with 90% or more of the working popula-tion employed in occupapopula-tions included in JEMs defined by one time period for 1930–2005. As expected the pro-portions of occupations covered were lower when the data are split into more time periods (down to 50–60% depending on the population), and are improved by coarser resolutions of the occupation/industry classifica-tions or less stringent sample size criteria.
Validity
CANJEM results from the aggregation of exposure estimates in a series of case–control studies held in Montreal. Its validity therefore mainly rests on the qual-ity of the individual estimates, as well as the representa-tiveness of the jobs in the database compared with the Montreal and Canadian working populations (or any other population one may wish to use the JEM for).
The exposures assigned by the experts have been shown to be reliable and repeatable (Goldberg et al., 1986; Siemiatycki et al., 1997). A validation trial was also conducted where our experts assessed exposure to 19 agents (12 of which are CANJEM agents, encompass-ing metals, solvents, and hydrocarbons, among others) for 47 jobs for which some measurements were available (Fritschi et al., 2003). Between 70 and 90% of the sub-stances known to have been present were correctly iden-tified. In addition, the occupational histories collected by interviews and questionnaires have been found to be accurate when compared with governmental records (Baumgarten et al., 1983).
As with other sources of information on occupa-tional exposures, CANJEM’s application to any study population other than the original ones requires careful evaluation. The only extensive external comparison of the evaluations of the Montreal experts was conducted by Lavoué et al. (2012) between jobs from Study 2 and FINJEM for 27 agents. Prevalence and levels of expos-ure were often similar between the two sources for several agents such as metals or welding fumes, but disa-greements were also found for agents such as flour dust and chlorinated solvents for prevalence, and toluene and benzo[a]pyrene for intensity level. Aside from differ-ences in exposure assessment methodology, differdiffer-ences in true exposure conditions could also play a role in the discrepancies observed. The studies used in creating CANJEM were set in a largely urban population with a historically important textile and garment industry, and manufacturing of food and beverage products, among others (Brodeur and Galarneau, 1994). The applica-tion of CANJEM to another populaapplica-tion should there-fore account for population-specific factors in exposure.
Lastly, the time period covered by the source exposure data ended in 2005, and the information contained in CANJEM may become outdated for recent jobs in occu-pations that underwent major changes in exposure con-ditions, or for new jobs.
Decisions made in designing CANJEM
The exposure information in CANJEM combines data from studies conducted at different points in time over 25 years, from jobs held by both cases and controls, as well as by men and women. Excluding data based on one or more of these factors would have resulted in fewer cells included in CANJEM, and in fewer jobs to base the exposure estimates within each cell. On the other hand, mixing information from jobs with system-atic differences in exposure profiles could lead to less reliable estimates.
Concerns regarding including information from cases have been raised in the literature since differ-ences in exposures to known risk factors for a disease and reporting of work, tasks, and exposures may occur between cases and controls (Kirkham et al., 2016). Using data from Study 2, Kirkham et al. (2016) compared JEMs created from jobs held by lung cancer cases to JEMs created from population controls. The agreement between the JEMs was high for exposure status (92– 93% concordance in the designation of cells as having some likelihood of exposure or not) and for the prob-ability and intensity of exposure, suggesting that aggre-gating the case and control information in our study into a single JEM is justifiable given the benefits of increased sample size.
The potential differences in exposure by men and women were evaluated by Labrèche et al. (2015), who compared JEMs created separately for men and women using data from Studies 2 and 3. For 91% of the 14 337 occupation–agent combinations, the probability of exposure between jobs held by men and jobs held by women was comparable with an intraclass correlation coefficient of 0.74 among cells with at least 5% of jobs exposed. While differences in exposure probability were observed for several agents such as engine emissions or fabric dust, most could be explained by the different distribution of jobs held by men and women across the spectrum of occupations. We conducted a detailed evalu-ation of 326 combinevalu-ations of agents and occupevalu-ations where there were notable sex differences in probability of exposure; we found that 57% could be resolved by using more precise occupational codes, 24% were explained by differences in industry, 16% by differences in reported tasks, and only 3% could not be clearly explained by an expert examining the tasks reported and the agent
involved (Labrèche et al., 2015). Results from this evalu-ation did not warrant the production of sex-specific ver-sions of CANJEM although further refinements could be made to provide estimates stratified by gender for cells where the main differences were observed.
CANJEM includes exposure data from jobs held by subjects whose occupational histories were collected from proxy respondents, which represented ~22% of jobs. Compared with self-respondents, exposure assigned to jobs from proxy respondents had somewhat lower reliability ratings but similar exposure metrics. A comparison between a JEM created from jobs held by self-respondents and a JEM based on jobs held by proxy respondents: 89% cells were unexposed for both JEMs, 5.7% were exposed in both JEMs, 2.9% were exposed for self respondents only, and 2.6% were exposed among proxies only. Kendall correlations among cells exposed in both JEMs were 0.64 for probability of exposure and 0.59 for FWI. These observations supported the inclu-sion of data from proxy respondents in CANJEM given the added sample size.
Additional methodological considerations
The pooling of exposure data from the different stud-ies involved significant efforts in adapting some of the exposure indices and selecting compatible agents across the four studies, but differences may remain since the studies were conducted at different points in time. Most of the exposure assessment method and infrastructure was developed for Study 1, and evolved during Studies 2–4. The relative meaning of the exposure levels repre-sentative of low, medium, and high intensity, as well as the background environmental level may have changed over time as well (Pintos et al., 2012). A comparison of JEMs created from the exposure data from Studies 1 and 2 for a period with the most overlap in jobs between these studies (1950–1980) showed that exposure prob-ability was slightly higher in Study 2 (done 10 years later), while a larger proportion of high intensity rat-ings were assigned in Study 1 (results not shown). We do not think that these differences warrant the use of study-specific estimates in each cell, but their evaluation and adjustment using modeling constitute an interesting development avenue for CANJEM.
Regarding the scores applied to the low-, medium-, and high-intensity levels in the computation of FWI, we also evaluated alternative ratios of 1:2:3, 1:3:9, and 1:10:100 aside from 1:5:25; pairwise Kendall correla-tions between FWI values computed with the different ratios for each exposed job or agent pair were very high, with the lowest correlation (tau = 0.7) found between the two most extreme ratios (1:2:3 and 1:10:100).
Correlations stratified by agent were similar and did not merit the inclusion of FWI indices computed using ratios other than 1:5:25.
Finally, some JEMs such as MATGÉNÉ present cells based on combinations of occupation and indus-try, which can provide refined estimates for occupations with significant between-industry variation. In the case of CANJEM, there is currently no such combinations since it would result in a notable reduction in cell sample size given that the JEM was developed from a finite set of occupational histories and job descriptions. But since both occupation and industry codes are available for each job in the database, it would be possible to create versions of CANJEM based on a custom classification combining these two dimensions.
Conclusion
CANJEM is one of the largest sources of information on occupational exposures in North America and beyond, built from 50 expert-years of work by our team, and is accessible online. The combination of an extensive list of agents, multiple time periods, and flexible dimensioning makes it suitable for a diversity of applications in epi-demiology and occupational hygiene.
Funding
Funding for the development of CANJEM was provided by the Société de recherche sur le cancer (SRC), along with the Fonds de Recherche du Québec – Santé through the GrePEC initiative (grant no. 16264). The original studies were funded by a num-ber of agencies, including the National Health Research and Development Programme, Health Canada, the National Cancer Institute of Canada, the Medical Research Council of Canada, the Canadian Institutes for Health Research, and the National Institutes of Health.
Disclaimer
The authors declare no conflict of interest relating to the mater-ial presented in this Article. Its contents, including any opinions and/or conclusions expressed, are solely those of the authors.
Acknowledgements
Jack Siemiatycki was principal investigator (PI) of Studies 1, 2, and 4, and guided the development of the exposure assess-ment method used in all studies. Lesley Richardson participated in designing Studies 1 and 2, including the data collection and exposure assessment protocols. Mark Goldberg and France Labrèche were PIs of Study 3. Marie-Élise Parent was co-investigator of Study 4. Exposure assessment methods were developed and implemented by Michel Gérin, Jack Siemiatycki, Howard Kemper, Louise Nadon, Ramzan Lakhani, Denis Bégin,
and Benoit Latreille. Several research assistants contributed to data collection and data management, including Ron Dewar, Marie-Claire Goulet, Jérôme Asselin, Sally Campbell, Dora Rodriguez, Elmira Aliyeva, Ana Gueorguieva, and Mendher Merzoug. Jérôme Lavoué conceptualized the current structure of CANJEM and supervised its construction. Jean-François Sauvé carried out the computations and programming to prod-uce CANJEM. The descriptive analyses described in this art-icle were designed and conducted by Jean-François Sauvé and Jérôme Lavoué. All authors reviewed and commented on the manuscript.
References
Baumgarten M, Siemiatycki J, Gibbs GW. (1983) Validity of work histories obtained by interview for epidemiologic pur-poses. Am J Epidemiol; 118: 583–91.
Brodeur M, Galarneau D. (1994) Three large urban areas in transition. Perspect Labour Income; 6: 5.
Dominion Bureau of Statistics. (1970) Standard industrial
clas-sification manual. Ottawa: Information Canada.
Févotte J, Dananché B, Delabre L et al. (2011) Matgéné: a pro-gram to develop job-exposure matrices in the general popu-lation in France. Ann Occup Hyg; 55: 865–78.
Fritschi L, Nadon L, Benke G et al. (2003) Validation of expert assessment of occupational exposures. Am J Ind Med; 43: 519–22.
García AM, González-Galarzo MC, Kauppinen T et al. (2013) A job-exposure matrix for research and surveillance of occu-pational health and safety in Spanish workers: MatEmESp.
Am J Ind Med; 56: 1226–38.
Gérin M, Siemiatycki J, Kemper H et al. (1985) Obtaining occu-pational exposure histories in epidemiologic case-control studies. J Occup Med; 27: 420–6.
Goldberg MS, Siemiatycki J, Gérin M. (1986) Inter-rater agree-ment in assessing occupational exposure in a case-control study. Br J Ind Med; 43: 667–76.
Hoar S. (1983) Job exposure matrix methodology. J Toxicol
Clin Toxicol; 21: 9–26.
International Labour Office (ILO). (1969) International
stand-ard classification of occupations. Revised Edition 1968.
Geneva: ILO.
Kauppinen T, Heikkilä P, Plato N et al. (2009) Construction of job-exposure matrices for the Nordic Occupational Cancer Study (NOCCA). Acta Oncol; 48: 791–800.
Kauppinen T, Toikkanen J, Pedersen D et al. (2000) Occupational exposure to carcinogens in the European Union. Occup Environ Med; 57: 10–8.
Kauppinen T, Toikkanen J, Pukkala E. (1998) From cross-tabulations to multipurpose exposure information sys-tems: a new job-exposure matrix. Am J Ind Med; 33: 409–17.
Kauppinen T, Uuksulainen S, Saalo A et al. (2014) Use of the Finnish Information System on Occupational Exposure (FINJEM) in epidemiologic, surveillance, and other applica-tions. Ann Occup Hyg; 58: 380–96.
Kirkham TL, Siemiatycki J, Labrèche F et al. (2016) Impact of aggregating exposure information from cases and controls when building a population-based job-exposure matrix from past expert evaluations. Occup Environ Med; 73: 474–81.
Labrèche F, Goldberg MS, Valois MF et al. (2010) Postmenopausal breast cancer and occupational exposures.
Occup Environ Med; 67: 263–9.
Labrèche F, Lacourt A, Lavoué J. (2015) Occupational exposure
to chemical and physical contaminants: sex-differentiated analysis. Montréal: Institut de recherche Robert-Sauvé en
santé et en sécurité du travail.
Lacourt A, Cardis E, Pintos J et al. (2013) INTEROCC case-con-trol study: lack of association between glioma tumors and occupational exposure to selected combustion products, dusts and other chemical agents. BMC Public Health; 13: 340. Lavoué J, Pintos J, Van Tongeren M et al. (2012) Comparison
of exposure estimates in the Finnish job-exposure matrix FINJEM with a JEM derived from expert assessments per-formed in Montreal. Occup Environ Med; 69: 465–71. Mannetje t’, Kromhout H. (2003) The use of occupation and
industry classifications in general population studies. Int J
Epidemiol; 32: 419–28.
Peters CE, Ge CB, Hall AL et al. (2015) CAREX Canada: an enhanced model for assessing occupational carcinogen exposure. Occup Environ Med; 72: 64–71.
Pintos J, Parent ME, Richardson L et al. (2012) Occupational exposure to diesel engine emissions and risk of lung can-cer: evidence from two case-control studies in Montreal, Canada. Occup Environ Med; 69: 787–92.
Ramanakumar AV, Parent ME, Siemiatycki J. (2007) Risk of lung cancer from residential heating and cooking fuels in Montreal, Canada. Am J Epidemiol; 165: 634–42. Siemiatycki J. (1996) Exposure assessment in community-based
studies of occupational cancer. Occupational Hygiene; 3: 41–58.
Siemiatycki J, Day NE, Fabry J et al. (1981) Discovering carcin-ogens in the occupational environment: a novel epidemio-logic approach. J Natl Cancer Inst; 66: 217–25.
Siemiatycki J, Fritschi L, Nadon L et al. (1997) Reliability of an expert rating procedure for retrospective assessment of occupational exposures in community-based case-control studies. Am J Ind Med; 31: 280–6.
Siemiatycki J, Lavoué J. (2018) Availability of a new job-expo-sure matrix (CANJEM) for epidemiologic and occupational medicine purposes. J Occup Environ Med, in press. doi: 10.1097/JOM.0000000000001335
Siemiatycki J, Nadon L, Lakhani R et al. (1991) Exposure assessment. In Siemiatycki J, editor. Risk factors for cancer
in the workplace. Boca Raton: CRC Press; pp. 45–114.
Siemiatycki J, Wacholder S, Richardson L et al. (1987) Discovering carcinogens in the occupational environment. Methods of data collection and analysis of a large case-referent monitor-ing system. Scand J Work Environ Health; 13: 486–92. Statistics Canada. (1980) Standard industrial classification,
1980. Ottawa, ON: Statistics Canada, Standards Division.
Statistics Canada. (1989) Census of Canada, 1986: occupations. Ottawa: Statistics Canada.
Statistics Canada. (2012a) National occupational
clas-sification, 2011. Ottawa: Minister of Industry.
978-0-662-45368-0.
Statistics Canada. (2012b) North American Industry
Classification System (NAICS) Canada 2012. Ottawa:
Statistics Canada. 978-1-100-19674-9.
Statistics Canada. (2016) 2011 National household
sur-vey. Ottawa, ON: Statistics Canada. Catalogue
no. 99-012-X2011033.
Stewart WF, Stewart PA. (1994) Occupational case-control stud-ies: I. Collecting information on work histories and work-related exposures. Am J Ind Med; 26: 297–312.
Teschke K, Olshan AF, Daniels JL et al. (2002) Occupational exposure assessment in case-control studies: opportunities for improvement. Occup Environ Med; 59: 575–93.
United Nations. (1971) International standard industrial
clas-sification of all economic activities, revision 2. New York:
United Nations Statistical Office.
U.S. Bureau of Labor Statistics. (2014) Standard Occupational Classification (SOC) System. http://www.bls.gov/soc/#classification. Accessed 14 December 2015.
van Tongeren M, Kincl L, Richardson L et al.; INTEROCC STUDY GROUP. (2013) Assessing occupational exposure to chemicals in an international epidemiological study of brain tumours. Ann Occup Hyg; 57: 610–26.
Verma DK. (1996) Occupational health and safety initiatives and trends in Canada, in particular in Ontario. Ann Occup
Hyg; 40: 477–85.
Vida S, Pintos J, Parent ME et al. (2010) Occupational expo-sure to silica and lung cancer: pooled analysis of two case-control studies in Montreal, Canada. Cancer Epidemiol
Biomarkers Prev; 19: 1602–11.