HAL Id: sic_01303189
https://archivesic.ccsd.cnrs.fr/sic_01303189
Submitted on 16 Apr 2016
HAL is a multi-disciplinary open access
archive for the deposit and dissemination of
sci-entific research documents, whether they are
pub-lished or not. The documents may come from
teaching and research institutions in France or
abroad, or from public or private research centers.
L’archive ouverte pluridisciplinaire HAL, est
destinée au dépôt et à la diffusion de documents
scientifiques de niveau recherche, publiés ou non,
émanant des établissements d’enseignement et de
recherche français ou étrangers, des laboratoires
publics ou privés.
Is Visualization Usable for Displaying Web Search
Results in an Exploratory Search Context?
Aline Crédeville, Dominic Forest
To cite this version:
Aline Crédeville, Dominic Forest. Is Visualization Usable for Displaying Web Search Results in an
Ex-ploratory Search Context?. Maristella Agosti; Nicola Ferro; Pamela Forner; Henning Müller; Giuseppe
Santucci. Information Retrieval Meets Information Visualization : PROMISE Winter School 2012,
Zi-nal, Switzerland, January 23-27, 2012, Revised Tutorial Lectures , 7757, pp.167-176, 2013, Lecture
Notes in Computer Science, 978-3-642-36414-3. �10.1007/978-3-642-36415-0_11�. �sic_01303189�
M. Agosti et al. (Eds.): PROMISE Winter School 2012, LNCS 7757, pp. 167–176, 2013. © Springer-Verlag Berlin Heidelberg 2013
Is Visualization Usable for Displaying Web Search
Results in an Exploratory Search Context?
Aline Crédeville and Dominic Forest
École de bibliothéconomie et des sciences de l’information, Université de Montréal, Canada {aline.credeville,dominic.forest}@umontreal.ca
Abstract. Information visualization is defined as an interactive and graphic
amplifying cognition. Moreover, the field of information retrieval is the original scope of information visualization. Nevertheless, many problems remain. The exploratory research information is presented as a task context conducive to the use of visualization. The research aims to identify the dynamic and interactive graphics that use a search visual interface (versus text), and the gain in terms of usability compared to strategic and tactical requirements of the task of explo-ratory search on the Web exploexplo-ratory type. The theoretical, conceptual and me-thodological framework is presented.
Keywords: information visualization, exploratory search, clustering, usability.
1
Introduction
The search engine has established itself as an almost exclusive means of searching and browsing the web, and its technical and algorithmic performance is widely recog-nized. However, the “query-result” paradigm has several interactivity limitations and is only appropriate for a limited spectrum of search taxonomies [1]. Indeed, Google’s search interface is considered adequate only for 17% of the searches it performs [2]. Considering the broad spectrum of information search taxonomies [2], [3] and infor-mation behaviours [4], a new current in scientific research has emerged in the past years that focuses on the interaction between the user and the system rather than the individual analysis of those entities [5], [6]. Indeed, the searching interface has be-come a focal point for researchers [7]–[10]. For exploratory searching in particular [11], new interfaces are being developed for the benefit of relevant exploratory tactics and strategies [9]. In this respect, visualization of search results appears as a promis-ing device for the information seekpromis-ing process.
Due to the double interactive and visual-perceptual process it entails [12], [13], visualization is characterized by its tendency to amplify the cognitive faculties de-ployed by the user for knowledge building, analysis and learning processes [14]. Nev-ertheless, in the field of information retrieval, the evidence of cognitive amplification is yet to be demonstrated within the exploratory search context.
Thus, our research stands on the crossroads of several challenges. Firstly, although it is known that visualising information aids memorisation and analysis of information
in general, the means of implementing visually structured search results remains to be determined. Secondly, the new interactive modalities required by the exploratory research process introduce additional dimensions which extend beyond the reach of typical recall and precision metrics. Thirdly, it has not yet been verified that, when compared to other interfaces designed for exploratory search, visual and interactive presentation of results leads to a clear gain over a textual list-based presentation, based on the same clustering algorithm.
The goal of this research is to assess the gain in terms of usability, from the user’s point of view, of exploring search results through a visual layout (as opposed to a textual layout) when performing exploratory searches on the Web. Increasing usabil-ity of an interface means reducing the cognitive load associated with its use and sim-plifying the cognitive, affective and physical processes related to the final task of the user.
Because we believe that interactive visualization reduces cognitive load associated with information treatment processes required by cognitive strategies and research tactics in the context of exploratory information search, we assert that it can benefit the user’s investigation and discovery processes beyond the known positive effects of clustered results [15].
Our research aims to evaluate the usability of visualization in the context of ex-ploratory information search on the web. To accomplish this, we wish, through heu-ristic analysis and controlled experimentation by simulating tasks related to explora-tory information search, to:
• Identify the graphical and interactive functional factors of visualization that have an impact on the process of exploratory information searching
• Correlate visualization and exploratory information searching in terms of usability on the basis of identifiable search strategies and interactive views, according to ei-ther the user’s proficiency in a particular field of knowledge or his expertise in in-formation searching
• Through interaction between the user and the context-related visualization device, define what represents a gain or an obstacle in the process of exploratory informa-tion search, in particular with respect to the user’s own strategies and tactics
2
Litterature Review
2.1 Exploratory Search
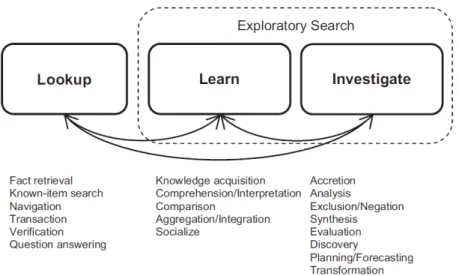
Marchionini [11] and White and Roth [16] have modeled the exploratory search proc-ess by providing perspective on the iterative and non-linear dynamics between differ-ent cognitive strategies and associated search tactics.
This model highlights interactions between different strategies and their associated tactics. Among exploratory search tactics, several behavioural information search models, such as the « berry-picking model » by Bates [17], the « sense-making model» by Dervin [18], and « information foraging » by Pirolli et Card [19] can be recognized.
Is V
Fig. 1. Exploratory search mo
14, reprinted with permission)
The main learning strate [20], [21] which consists in ing new information to addr The process of explorato knowledge, is a typical exam cognitive challenges, the « gine environment is conside
Since 2006, an increasin HCIR2010; WISI2010) are with exploratory informatio face are emerging to suppo as mSpace [22] and visual i
2.2 Search Results Visu The visualization of search in displaying the results tha and proposing a device that tive views.
The visualization of info nal cognitive aid [24]. Gra vealing dominant themes or same manner that performin tive load of mental calculati
Visualization Usable for Displaying Web Search Results
odel based on Marchionini [11] (Source: White and Roth [16
egy partly reminds us of Kulthau’s more general proc n reducing cognitive and affective uncertainties by prov
ress a gap or a weakness in the state of knowledge. ory information, aimed explicitly at the acquisition of n
mple of this type of process [1]. Thus, with respect to th query-response » paradigm that dominates the search ered inefficient, if not detrimental.
ng number of scientific meetings (EESS2006 ; ESI20 e being organized to discuss the main challenges associa on search: interactivity and evaluation. Two types of in ort exploratory information search: faceted interfaces s interfaces such as Carrot2Search [23].
ualization
results is a device for visualising information that cons at match a user’s query in a graphical and dynamic mann
t facilitates navigation within these results through inter
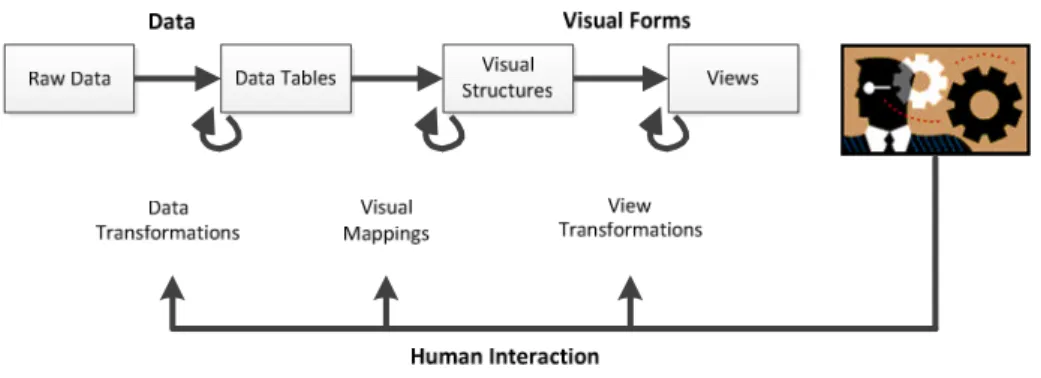
ormation (fig 2) is an interactive device acting as an ex aphical and interactive representation of results aims at r informational motives that characterize the results, in ng a mathematical calculation in writing relieves the cog ion on the memory.
169 6] p. cess vid-new hese en-007; ated nter-uch sists ner, rac- xter-t re-the
gni-Fig. 2. Reference model for information visualization process (Source: Card, Mackinlay et
Shneiderman [14] p. 17 reprinted with permission)
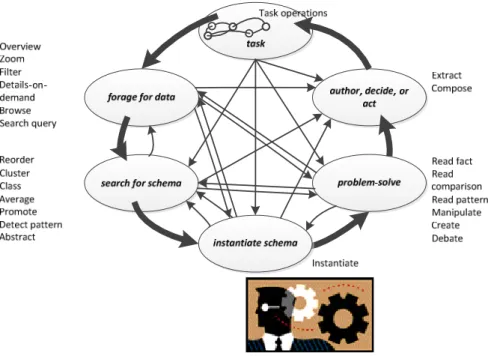
To accomplish this, visualization of search results is designed with the aid of clus-tering algorithms originating from the field of text searching. The web has and will continue to bring numerous challenges regarding the structuring of search results [23]. To this day, unsupervised clustering algorithms (Suffix Tree Clustering, k-means) can be adapted to the dynamics, the heterogeneity and the size of the web. Moreover, this structuring process, with or without downstream visualization, is known to facilitate investigation and discovery within large masses of textual material. As a result of these properties, visualization helps the knowledge crystallization process.
This crystallization process (fig 3) calls for tactics and strategies that are similar to those of exploratory information search. Interactive viewing allows direct manipula-tion of the graphic representamanipula-tion in order to enable analytical and investigatory proc-essing of results, thus providing an insight into the state of knowledge available on the web on a particular subject.
However, beneath the surface of visualization’s generic principles, the application of visualization in the environment of search results remains problematic. Some openly criticize the use of this device on search results given the textual nature of information [8]. In the commercial sector, two important players have been forced to cease their operations as visual meta-search engines: Kartoo and Grokker. On several occasions, in a general context or with reference to information search, researchers [25]–[27] report similar findings concerning visualization: challenges include a lack of understanding of the cognitive processes involved, scalability issues associated with the variable size of the information mass to be processed, and difficulties related to categorization and labelling of search results [23].
On a more fundamental level, a major obstacle to the establishment of this device is the absence of an authoritative evaluation method [28]. Although the theoretical principle of cognitive amplification is agreed upon, its application is based on a mul-tidimensional analysis, where a deep understanding of the interaction between the user and the system is essential. The question is then: how to evaluate the impact of interactive views on the user experience of information seeking process?
Is Visualization Usable for Displaying Web Search Results 171
Fig. 3. Knowledge crystallization during information visualization process (Source: Card,
Mackinlay et Shneiderman [14] reprinted with permission)
2.3 Evaluation of Search Results Visualization
The evaluation of a system aims to assess its capacity to satisfy a user according to chosen criteria [29]. In the fields of both scientific research and innovation, evaluation serves the role of a barometer that is able to validate the quality of a system with re-spect to different criteria, such as performance, satisfaction, usefulness or usability. The objective, the context, the task at hand and the stage of maturity of the system are all relevant criteria for selecting a scenario and an evaluative approach [30]. Tradi-tionally, information retrieval systems were evaluated through performance, a system-centered criterion, by measuring the system’s recall and precision rates [31]. The interdependency between the interactions generated by the system’s use and the in-formation seeking process performed by the user makes placing the user at the core of the evaluation process essential.
Evaluating the visualization of search results will address the requirements of the task at hand as well as those of the exploratory search and of the visualization proc-ess. To perform this assessment, we aim to take advantage of the shared nature of visualization and information seeking processes, as summarized by Zhang [32], and to gauge the added value of the visualization device. Several evaluation methods are in use, although none have earned general recognition [33]. To evaluate the user experi-ence with respect to a given task, it is recommended to assess device usability [30]
In practice, it appears that few usability studies have been conducted to this date [25], [34], [35] and that controlled, user-centric experiments are currently the preferred
approach. The latter offer the advantage of precise and generalizable results [28]. Most are focused on method evaluation and measuring the impacts of individual characteris-tics (gender, spatial abilities, cognitive style, associative memory). However, the heterogeneity of chosen measures, tasks and visualizations thwarts the process of com-paring results [36]. In addition, some case studies and longitudinal studies have been performed; their results are very detailed but remain hardly generalizable. Moreover, although not pertaining specifically to the evaluation of visualization of search results, the usability evaluation framework designed by Wilson [37] establishes measures that allow the assessment of interactive features according to the strategies of exploratory research. The last method for evaluating user experience considered in this research focuses on the insight gained by the user from the visualization of the presented infor-mation, rather than on the device and its components. North [38] mentions that these two evaluations are not in opposition but that they are, on the contrary, rather comple-mentary. Indeed, Rester and Pohl’s [39] study on the evaluation of a visualization de-vice designed to facilitate exploratory research processes confirms this statement.
3
General Study Design
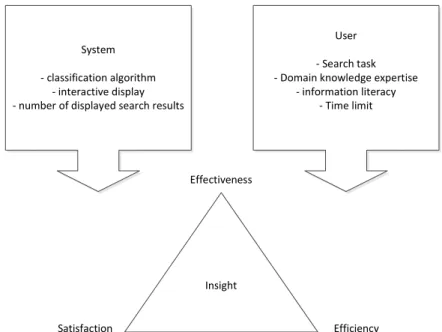
Our research seeks to evaluate, in terms of usability, the added value of the visualiza-tion of search results in the context of exploratory informavisualiza-tion search on the web. The main hypothesis of this research is that interactive views support the tactics and strategies related to information searching.
System
‐ classification algorithm ‐ interactive display ‐ number of displayed search results
User
‐ Search task ‐ Domain knowledge expertise
‐ information literacy ‐ Time limit Insight Effectiveness Efficiency Satisfaction
Is V
The evaluation framewor exercises. The first phase a stage process. During the fi ing to heuristics [40]. The two types of users (experts by simulating an explorator In practice, the objectiv search results is to demons ganization, interactive displ the user’s task in an effici with a high degree of usabi to a minimum. Several obje visualization device. Firstly alization device within and fied. Secondly, the interfac tactics will be compared in The second phase is of the insights the user receiv the chosen tactics and strate The system selected for system features a textual a automatic classification alg purposes.
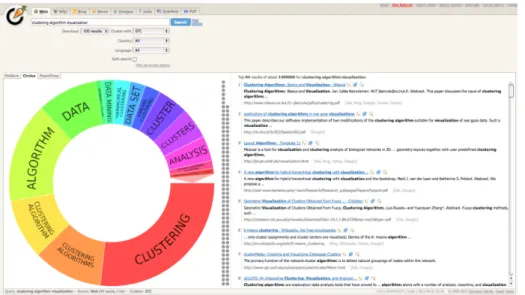
Fig. 5. Example of visual clus
rot2search engine
Visualization Usable for Displaying Web Search Results
rk (fig 4) covers two phases and calls for two experimen aims to evaluate the usability of the device through a tw irst stage, the interface is inspected for a first time acco
second stage implies controlled testing of the interface s in information search or experts in a field of knowled ry information research task.
e of evaluating the usability of a visualization device strate that the different system components (indexing, lay) are processing the information required to accomp ent, effective and satisfactory manner. Thus, an interf ility is a system that helps reduce the user’s cognitive l ectives are pursued by evaluating the relative usability o y, the limitations and weaknesses associated with the vi d outside of the information search context will be ide ce features that are used to support research strategies
terms of usability.
a qualitative and investigatory nature. Its aim is to ass ves through the use of a visualization device, according
egies of exploratory information search.
this experiment is the Carrot2Search engine (fig 5). T s well as a visual interface, is based on high-performa gorithms and defines itself as open software for academ
stered search results interface with the STC algorithm from C 173 ntal wo- ord-e by dge) for or-lish face oad of a isu- enti-and sess g to This ance mic
Car-Several types of expertise are tested simultaneously to shed light on the various factors known to have an impact on the skills required for the use of information visu-alization and exploratory information search on the web. Thus, the proposed heuristic analysis will be performed by information visualization experts. The experimental phase calls for two types of users: 15 volunteer users that have demonstrated their proficiency in information handling by successfully completing the Information Search coursework at the Library Sciences School of the University of Montreal, as well as 15 users that have proven skills in a field of knowledge related to the task of information search.
4
Conclusion
In theory, visualization constitutes an external cognitive aid. It supports memorisation and the processes of analysis and investigation by highlighting patterns and relation-ships between various pieces of information. These cognitive properties appear to assist the strategies and tactics required by exploratory information search. This re-search aims to evaluate, in terms of usability, the added value of a device designed for the visualization of search results within an appropriate context. We hope this work will make three types of contribution to evolving knowledge. Theoretically, we seek empirical evidence confirming the cognitive benefits of visualization in the context of exploratory information search. Methodologically, we aspire to devise effective quali-tative metrics for evaluating the visual interface for exploratory information search. Lastly, we wish to formulate practical recommendations for successfully integrating visualization into information search interfaces.
References
1. Schraefel, m.c: Building Knowledge: What’s beyond Keyword Search? Computer 42(3), 52–59 (2009)
2. White, R.W., Drucker, S.M.: Investigating Behavioral Variability in Web Search. In: Wil-liamson, C., Zurko, M.E. (eds.) Proceedings of the 16th International Conference on World Wide Web ( WWW 2007), Banff, Alberta, Canada, pp. 21–30. ACM Press, New York (2007)
3. Broder, A.: A Taxonomy of Web Search. SIGIR Forum 36(2), 3–10 (2002)
4. Wang, P.: Information Behaviour and Seeking. In: Ruthven, I., Kelly, D. (eds.) Interactive Information Seeking, Behaviour and Retrieval, pp. 15–41. Facet, London (2011)
5. Cool, C., Belkin, N.J.: A Classification of Interactions with Information. In: Bruce, H. (ed.) International Conference on Conceptions of Library and Information Science No4 (CoLIS 2004), pp. 1–16. Libraries Unlimited, Greenwood Village (2002)
6. Cool, C., Belkin, N.J.: Interactive information retrieval: history and background. In: Ruth-ven, I., Kelly, D. (eds.) Interactive Information Seeking, Behaviour and Retrieval, pp. 1– 14. Facet, London (2011)
7. Marchionini, G.: Toward Human-Computer Information Retrieval. Bulletin of the Ameri-can Society for Information Science and Technology 32(5), 20–22 (2006)
Is Visualization Usable for Displaying Web Search Results 175
9. Wilson, M.L., Kules, B., Schraefel, m.c, Shneiderman, B.: From Keyword Search to Ex-ploration: Designing Future Search Interfaces for the Web. Foundations and Trends® in Web Science 2(1), 1–97 (2010)
10. Jansen, B.J., Rieh, S.Y.: The Seventeen Theoretical Constructs of Information Searching and Information Retrieval. Journal of the American Society for Information Science and Technology 61(8), 1517–1534 (2010)
11. Marchionini, G.: Exploratory Search: from Finding to Understanding. Communications of the ACM - Supporting Exploratory Search 49(4), 41–46 (2006)
12. Bederson, B., Shneiderman, B.: The Craft of Information Visualization: Readings and Ref-lections. Morgan Kaufmann Publishers, San Diego (2003)
13. Ware, C.: Information Visualization Perception for Design. Morgan Kaufmann Publishers, San Francisco (2000)
14. Card, S.K., Mackinlay, J.D., Shneiderman, B.: Readings in Information Visualization: Us-ing Vision to Think. Morgan Kaufmann Publishers, San Francisco (1999)
15. Kules, B., Shneiderman, B.: Users Can Change their Web Search Tactics: Design Guide-lines for Categorized Overviews. Information Processing and Management 44(2), 463–484 (2008)
16. White, R.W., Roth, R.A.: Exploratory Search: Beyond the Query-Response Paradigm. Morgan & Claypool Publishers, San Rafael (2009)
17. Bates, M.J.: The Design of Browsing and Berrypicking Techniques for the Online Search Interface. Online Information Review 13(5), 407–424 (1989)
18. Dervin, B.: From the Mind’s Eye of the User the Sense-making Qualitative-quantitative Methodology. In: Glazier, J.D., Powell, R.D. (eds.) Qualitative Research in Information Management, pp. 61–87. Libraries Unlimited, Englewood (1992)
19. Pirolli, P., Card, S.: Information Foraging. Psychological Review 106, 643–675 (1999) 20. Kuhlthau, C.C.: A Principle of Uncertainty for Information Seeking. Journal of
Documen-tation 49(4), 339–355 (1993)
21. Kuhlthau, C.C., Heinström, J., Todd, R.J.: The ‘Information Search Process’ Revisited: Is the Model still Useful? Information Research 13(4) (2008), http://informationr. net/ir/13–4/paper355.html (accessed October 29, 2012)
22. Smith, D.A., Russell, A., Wilson, M.L., Owens, A., Schraefel, m.c: mSpace.fm (2005), http://mspace.fm/ (accessed October 29, 2012)
23. Carpineto, C., Osiński, S., Romano, G., Weiss, D.: A Survey of Web Clustering Engines. ACM Computing Surveys 41(3), 17:1–17:38 (2009)
24. Norman, D.A.: Things that make us smart. Addison Wesley, Don Mills (1993)
25. Chen, C.: Top 10 Unsolved Information Visualization Problems. IEEE Computer Graphics and Applications, 12–16 (2005)
26. Burkhard, R.A., Andrienko, G., Andrienko, N., Dykes, J., Koutamanis, A., Kienreich, W., Phaal, R., Blackwell, A., Eppler, M., Huang, J., Meagher, M., Grun, A., Lang, S., Perrin, D., Weber, W., Moere, A.V., Herr, B., Börner, K., Fekete, J.-D., Brodbeck, D.: Visualiza-tion Summit 2007: ten research goals for 2010. InformaVisualiza-tion VisualizaVisualiza-tion 6(3), 169–188 (2007)
27. Kerren, A., Stasko, J.T., Fekete, J.-D., North, C.: Workshop Report: Information Visuali-zation-Human-Centered Issues in Visual Representation, Interaction, and Evaluation. In-formation Visualization 6(3), 189–196 (2007)
28. Carpendale, S.: Evaluating Information Visualizations. In: Kerren, A., Stasko, J.T., Fekete, J.-D., North, C. (eds.) Information Visualization. LNCS, vol. 4950, pp. 19–45. Springer, Heidelberg (2008)
29. Al-Maskari, A., Sanderson, M.: A review of factors influencing user satisfaction in infor-mation retrieval. Journal of the American Society for Inforinfor-mation Science and Technolo-gy 61(5), 859–868 (2010)
30. Lam, H., Bertini, E., Isenberg, P., Plaisant, C., Carpendale, S.: Seven Guiding Scenarios for Information Visualization Evaluation. TechReport 2011-992-04. University of Calgary, Calgary (2011)
31. Harman, D.K., Voorhees, E.M.: TREC: An Overview. Annual Review of Information Science and Technology 40, 113–155 (2006)
32. Zhang, J.: Benchmarks and Evaluation Criteria for Information Retrieval Visualization. In: Zhang, J. (ed.) Visualization for Information Retrieval, pp. 239–254. Springer, Heidelberg (2008)
33. Plaisant, C.: The Challenge of Information Visualization Evaluation. In: Costabile, M.F. (ed.) Proceedings of the Working Conference on Advanced Visual Interfaces (AVI 2004), Gallipoli, Italy, pp. 109–116. ACM Press, New York (2004)
34. Freitas, C.M.D.S., Luzzardi, P.R.G., Cava, R.A., Winckler, M., Pimenta, M.S., Nedel, L.P.: On Evaluating Information Visualization Techniques. In: De Marsico, M., Levialdi, S., Panizzi, E. (eds.) Proceedings of the Working Conference on Advanced Visual Inter-faces (AVI 2002), Trento, Italy, pp. 373–374. ACM Press, New York (2002)
35. Valiati, E.R.A., Freitas, C.M.D.S., Pimenta, M.S.: Using Multi-dimensional in-depth Long-term Case Studies for Information Visualization Evaluation. In: Bertini, E., Perer, A., Plaisant, C., Santucci, G. (eds.) B Proceedings of the 2008 AVI Workshop on BEyond Time and Errors: Novel Evaluation Methods for Information Visualization (BELIV 2008), Florence, Italy, pp. 1–7. ACM press, New York (2008)
36. Julien, C.-A., Leide, J.E., Bouthillier, F.: Controlled User Evaluations of Information Vi-sualization Interfaces for Text Retrieval: Literature Review and Meta-analysis. Journal of the American Society for Information Science and Technology 59(6), 1012–1024 (2008) 37. Wilson, M.L.: An Analytical Inspection Framework for Evaluating the Search Tactics and
User Profiles Supported by Information Seeking Interfaces. Ph.D., University of Sou-thampton, SouSou-thampton, United Kingdom (2009)
38. North, C.: Toward Measuring Visualization Insight. IEEE Computer Graphics and Appli-cations 26(3), 6–9 (2006)
39. Rester, M., Pohl, M.: Methods for the evaluation of an interactive InfoVis tool supporting exploratory reasoning processes. In: Bertini, E., Plaisant, C., Santucci, G. (eds.) Proceed-ings of the 2006 AVI workshop on BEyond Time and Errors: Novel Evaluation Methods for Information Visualization, pp. 1–6. ACM Press, New York (2006)
40. Zuk, T., Schlesier, L., Neumann, P., Hancock, M.S., Carpendale, S.: Heuristics for infor-mation visualization evaluation. In: Bertini, E., Plaisant, C., Santucci, G. (eds.) Proceed-ings of the 2006 AVI workshop on BEyond Time and Errors: Novel Evaluation Methods for Information Visualization, pp. 1–6. ACM Press, New York (2006)