UTILISATION DES CAMÉRAS DE PIÉGEAGE ET DES MODÈLES DE CAPTURE-RECAPTURE POUR L'ESTIMATION DES DENSITÉS DE
CHIMPANZÉS D'AFRIQUE OCCIDENT ALE (PAN TROGLODYTES VERUS) EN CÔTE D'IVOIRE
MÉMOIRE PRÉSENTÉ
COMME EXIGENCE PARTIELLE À LA MAÎTRISE EN SCIENCES DE L'ENVIRONNEMENT
PAR
MARIE-L YNE DESPRÉS-EINSPENNER
Avertissement
La diffusion de ce mémoire se fait dans le respect des droits de son auteur, qui a signé le formulaire Autorisation de reproduire et de diffuser un travail de recherche de cycles supérieurs (SDU-522 - Rév.0?-2011 ). Cette autorisation stipule que «conformément à l'article 11 du Règlement no 8 des études de cycles supérieurs, [l'auteur] concède à l'Université du Québec à Montréal une licence non exclusive d'utilisation et de publication de la totalité ou d'une partie importante de [son] travail de recherche pour des fins pédagogiques et non commerciales. Plus précisément, [l'auteur] autorise l'Université du Québec à Montréal à reproduire, diffuser, prêter, distribuer ou vendre des copies de [son] travail de recherche à des fins non commerciales sur quelque support que ce soit, y compris l'Internet. Cette licence et cette autorisation n'entraînent pas une renonciation de [la] part [de l'auteur] à [ses] droits moraux ni à [ses] droits de propriété intellectuelle. Sauf entente contraire, [l'auteur] conserve la liberté de diffuser et de commercialiser ou non ce travail dont [il] possède un exemplaire.''
Drapeau, d'avoir cru en moi et de m'avoir permis de réaliser mon rêve de contribuer à la conservation des chimpanzés sauvages. Je tiens aussi à remercier ma famille (Alain, Carol, Emily) et mes amis (Élyse, Chantal, Julie, Alex, Romain, Miguelani) de m'avoir encouragée et poussée à poursuivre mes ambitions. Je remercie spécialement mon partenaire d'aventures, Erwan Le Bars, d'avoir été là pour moi à chaque instant. Cela n'aurait jamais été possible sans vous tous.
Un grand merci à l'Office Ivoirien des Parcs et Réserves (OIPR), au Centre Suisse de Recherches Scientifiques (CSRS) en Côte d'Ivoire, Roman Wittig, Zoro Goné Bi, les gens de l'Est, et toute l'équipe du Taï Chimpanzee Project (TCP) de m'avoir permis de réaliser ma collecte de données en Côte d'Ivoire. Merci à Freddy et Liran d'avoir aidé avec l'identification des chimpanzés dans les vidéos, et d'avoir ensoleillé les jours de pluie. Un merci particulier à Frédéric Yehanon Oulaï d'avoir été mon support moral pendant les moments durs en forêt, et de m'avoir fait sentir chez moi à des milliers de kilomètres du Canada. Je remercie aussi Eric Howe et Roger Mundry de m'avoir assisté dans les analyses statistiques et dans ma compréhension des modèles CMR. Enfm, mes recherches n'auraient pu être possibles sans l'apport financier du Service des Relations Internationales de l'UQAM et du Fonds de Recherche du Québec Nature et Technologies. Un grand merci.
Mon plus grand souhait serait que les résultats de mon mémoire puissent contribuer à la protection des chimpanzés et des autres espèces de grands singes. Espérons qu'w1 jour l'humanité comprendra qu'elle n'est rien sans la riche biodiversité qui l'entoure.
LISTE DES TABLEAUX ... vii
RÉSUMÉ ... ix
INTRODUCTION GÉNÉRALE ... 1
CHAPITRE!: V ALIDA TING THE USE OF CAMERA TRAPPING AND CAPTURE -RECAPTURE MO DELS TO ESTIMA TE DENSITIES OF THE ENDANGERED WESTERN CHIMPANZEE (PAN TROGLODYTES VERUS) IN TAÏ NATIONAL PARK, IVORY COAST ... 9
1. 1. ABSTRACT ... 9 1.2. INTRODUCTION ... 11 1.3. METHODS ... 15 1.4. RE SUL TS ... 22 1.5. DISCUSSION ... 25 1.6. CONCLUSION ... 32 CONCLUSION GÉNÉRALE ... 41 BIBLIOGRAPHIE ... 45 APPENDIX 1: Individual capture histories and proportion of total captures ... 57
APPENDIX II: Population size, density estimates and their respective standard errors and 95% confidence intervals given by each method ... 58
APPENDIX III: Results from the SECR function mask.check ..................................... 64
Figure 1.1 Map of the location of Taï National Park within Côte d '1 voire (a), and the home ranges of the chimpanzee communities followed by the Taï Chimpanzee Project (TCP) (b ). Home range of the east community is highlighted in red (modified version of map from Kouakou et al., 2011) ... 33
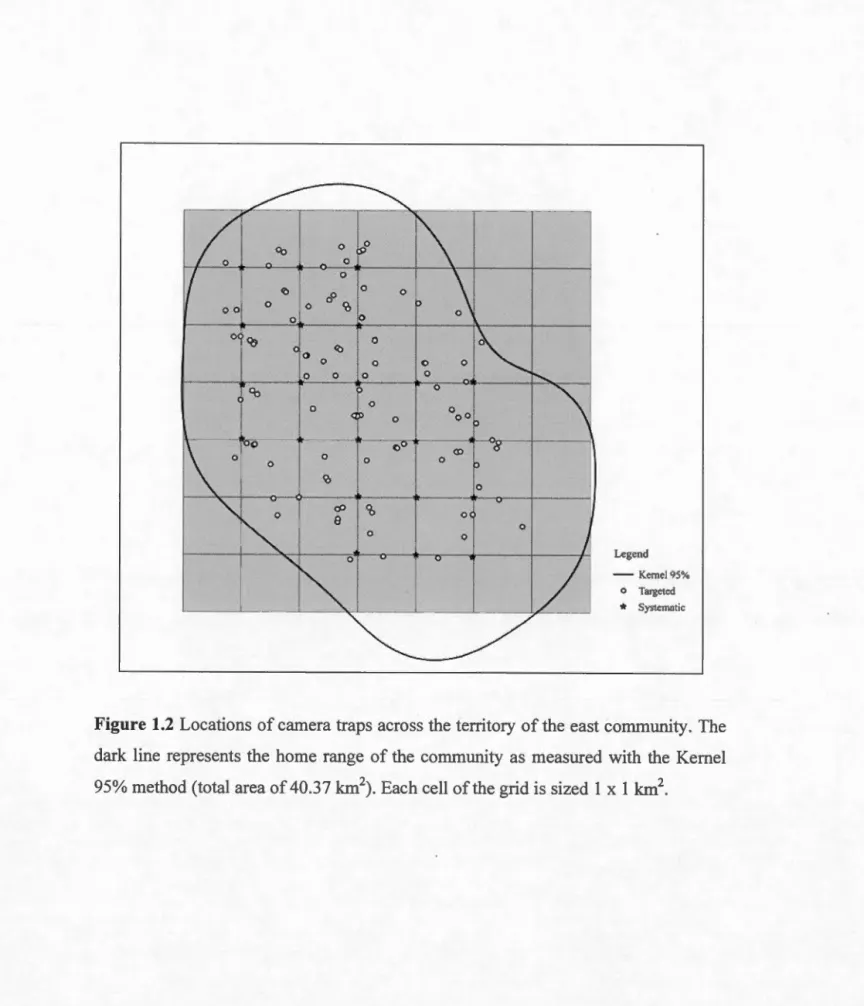
Figure 1.2 Locations of camera traps across the terri tory of the east community. The dark line represents the home range of the community as measured with the Kemel 95% method (total area of40.37 km\ Each cell ofthe grid is sized 1 x 1 km2 •.•... 34
Figure 1.3 Example of identifications of individuals (a) Adult Male "Freddy", (b) Subadult female "Gia" ... 35
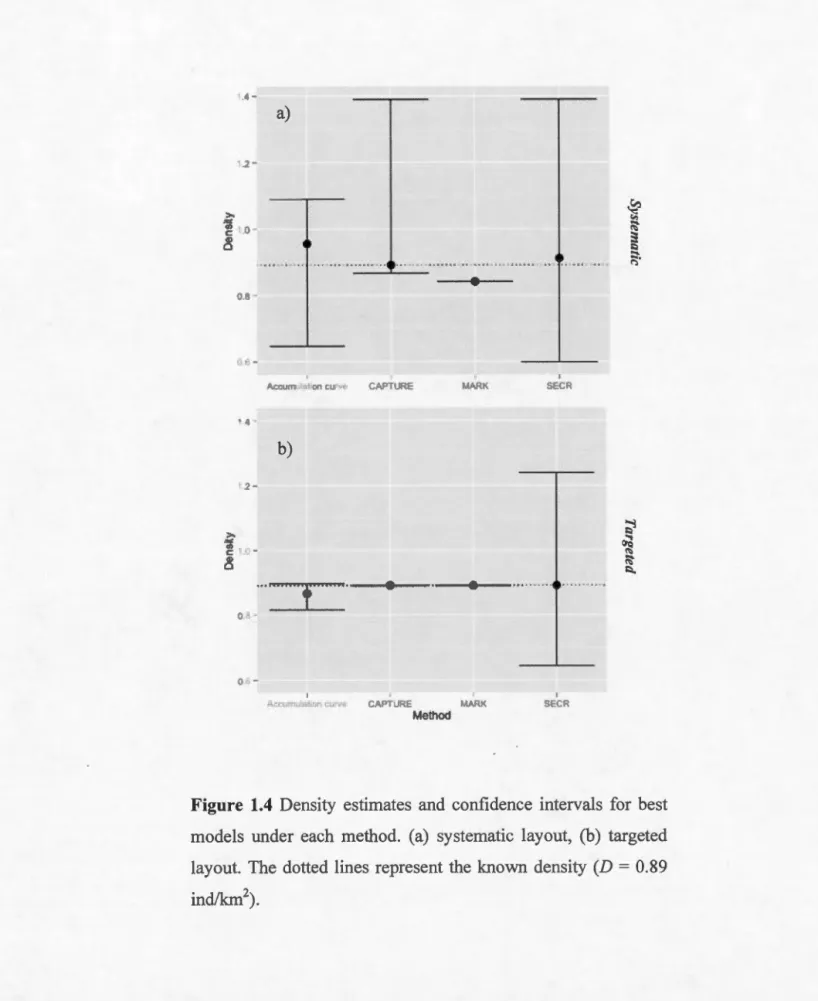
Figure 1.4 Density estimates and confidence intervals for best models under each method. (a) systematic layout, (b) targeted layout. The dotted !ines represent the known density (D = 0.89 ind/km2) ...•...•...•....•...•...•...•...•.•. 37
Figure 1.5 Number of captures (black) and uruque individuals captured (white) caught for various occasion numbers. Triangles represent systematic data, dots targeted data ... 3 8
each model under the appropriate sections: i, ii or iii) ... 36
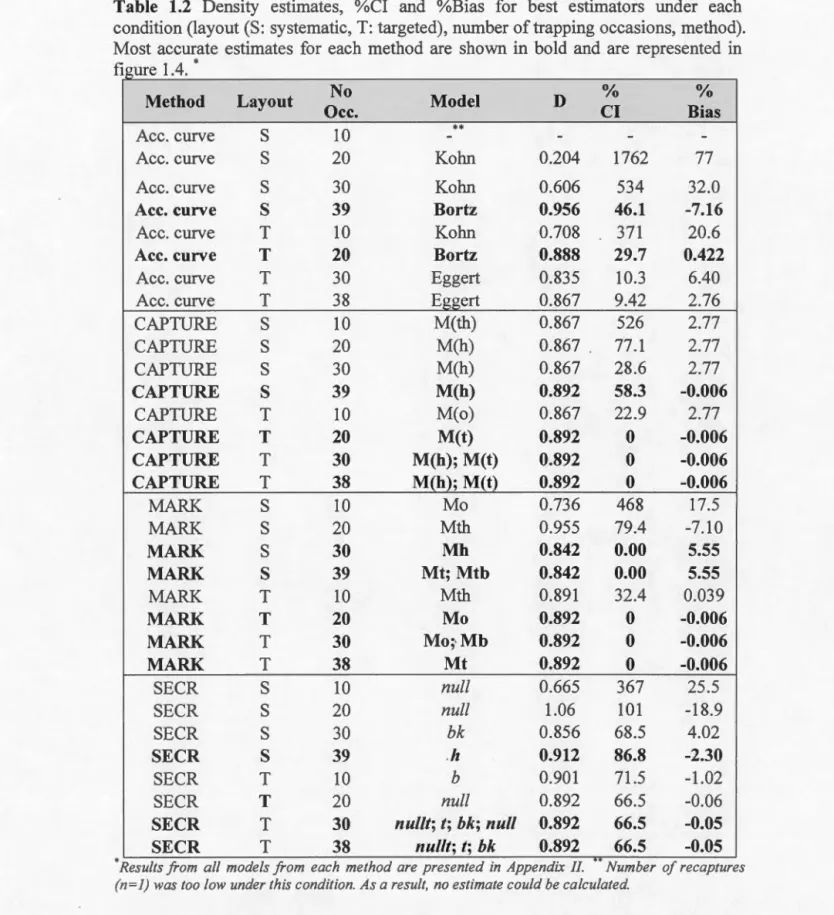
Table 1.2 Density estimates, %CI and %Bias for best estimators under each condition (layout (S: systematic, T: targeted), number of trapping occasions, method). Most accurate estimates for each method are shown in bold and are represented in figure 1.4 .. ... 39
effets des menaces spécifiques sur une espèce, mesurer le succès de décisions de conservation, et pour comprendre l'écologie des populations animales. La méthode des caméras de piégeage, combinée aux modèles de capture-recapture (C-R), a récemment été mise au point pour surmonter les limitations des techniques conventionnelles d'inventaire des populations de grands singes. Cependant, aucune validation de la méthode n'a été réalisée à ce jour. Dans cette étude, je vise à valider l'utilisation de caméras de piégeage en combinaison avec les modèles de C-R pour estimer les densités de chimpanzés d'Afrique occidentale (Pan troglodytes verus). Plus précisément, je vise à identifier: 1) quelle est la meilleure méthode de C-R pour estimer les densités de chimpanzés par caméras de piégeage, 2) quel est l'effort de piégeage minimum requis pour des estimations de densités exactes et précises, et 3) si un placement aléatoire des caméras peut donner des mesures de densité fiables et robustes. Afin de répondre à ces trois objectifs, j'ai mené une étude de caméras de piégeage de 10 mois sur le territoire d'une communauté de chimpanzés habituée à la présence humaine, et donc où la densité totale de chimpanzés est déjà connue. Les caméras ont été placées selon deux placements différents: systémÇltiquement, où les caméras ont été installées à chaque kilomètre, ou stratégiquement, à des endroits fréquemment visités par les chimpanzés. Les résultats montrent que tous les modèles de C-R ont do1mé des estimations de densité plus exactes et plus précises que les autres méthodes. couramment utilisées pour le recensement des populations de grands singes. Les chimpanzés avaient deux fois plus de chances d'être filmés par les caméras placées de façon stratégique, mais les densités issues des caméras systématiques étaient aussi précises et robustes. Ainsi, cette étude met l'accent sur la pertinence des caméras de piégeage et des modèles de C-R comme outils de surveillance des populations des grands singes.
MOTS-CLÉS: caméras de piégeage, chimpanzés, pan troglodytes verus, smv1, densité, capture-marquage-recapture, modèles spatiaux de capture-marquage-recapture, Côte d'Ivoire.
INTRODUCTION GÉNÉRALE
État global des populations de grands singes dans le monde
En plus de la perte et de la fragmentation d'habitat causées par l'exploitation des ressources forestières, l'agriculture, et l'exploitation minière, gazière et pétrolière, la survie des grands singes sauvages est menacée par le braconnage, la capture illégale des individus à des fins récréatives ou biomédicales, les instabilités politiques, ainsi que la transmission de maladies mortelles par l'homme (Cowlishaw et Dunbar, 2000; Walsh et al., 2003; Kormos et al., 2004; Campbell et al., 2008; Maldonaldo et al., 2012).
Les baisses alarmantes des populations de grands singes en Afrique démontrent l'urgence d'instaurer des mesures de conservation drastiques pour en protéger les populations restantes (Kormos et al., 2004; Campbell et al., 2008; Rainer et al., 2013). Au cours des trente dernières années, les populations de chimpanzés sauvages en Afrique tropicale ont diminué de plus de 66%, passant d'environ 600 000 à moins de 200 000 individus (Butynski, 2001). Par conséquent, toutes les sous-espèces de chimpanzé commun (Pan troglodytes), y compris le chimpanzé d'Afrique occidentale (P. t. verus), sont actuellement classées cornn1e étant "en danger" (EN) par J'Union Internationale pour la Conservation de la Nature (UICN) (Oates et al., 2008). Ainsi, si aucune action de conservation d'urgence n'est mise en place, les populations de chimpanzés sauvages risquent de s'éteindre au cours des prochaines années (Oates et al., 2008). Au Bénin, au Togo et au Burkina Faso, les populations de chimpanzés d'Afrique occidentale se sont déjà éteintes, et les populations du Sénégal, de la Guinée-Bissau, de la Côte d'Ivoire et du Ghana restent extrêmement menacées (Butynski, 2001; Campbell et al., 2008).
Pour faire face à ces menaces et mettre en place des mesures de conservation appropriées, les biologistes doivent se baser sur des données de densités des populations précises, à partir desquelles tout changement peut être facilement mesuré
en permanence. Les populations de chimpanzés demeurent pourtant encore peu
suivies. Les inventaires nationaux requis pour établir des stratégies de conservation à
long terme restent rares, ne couvrent qu'une petite partie des populations de chimpanzés, ou ont été réalisés il y a plus d'une dizaine d'années (Kormos et al.,
2004; Campbell et al., 2008; Maldonado et al., 2012). Ainsi, afin de mieux comprendre le statut de ces populations, la réalisation d'inventaires nationaux et la mise en place de méthodes de suivi applicables à grande échelle sont devenues la priorité de plusieurs plans d'action de conservation des grands singes (Morgan et al.,
2011; Plumptre etal., 2011; Carlsen etal., 2012; Maldonaldo etal., 2012; UICN et
ICCN, 2012; Dwm et al., 2014; UICN, 2014).
L'estimation des densités de grands singes peut toutefois s'avérer difficile dans les
grandes forêts tropicales où ils vivent, les emplacements y étant souvent difficiles d'accès, la visibilité très faible, et les individus insaisissables et très mobiles. Par conséquent, déterminer le nombre de chimpanzés avec exactitude est w1e tâche ardue,
comme le démontrent les importantes variations entre les différentes estimations
d'effectifs émises au cours des derniers recensements. En Côte d'Ivoire par exemple,
des recensements nationaux par Marchesi et al. (1995) en 1989-1990 ont résulté en
une estimation de 11 676 ± 1168 chimpanzés, alors que Teleki en comptait 500 à 1000 (Teleki, 1989). Il y a donc un besoin urgent de baser les politiques de
conservation sur des données qui peuvent être comparables entre différents sites et entre les différentes aimées de recensements.
Les approches modernes utilisées pour le suivi des populations de grands singes
et al., 1997; Kouakou et al., 2009; NGoran et al., 2013), l'échantillonnage génétique (Arandjelovic et al., 2010; Moore et Vigilant, 2013; McCarthy et al., 2015), les enregistrements audio (Heinicke et al., 2015; Kalan et al., 2015), et les observations directes (Mitani et al., 1993; Morgan et al., 2006). Bien que largement appliquées et efficaces pour l'estimation de densités, ces approches ont certaines limites pour un suivi plus approfondi, qui requiert généralement une connaissance des paramètres sociodémographiques tels que l'âge, le sexe, et l'identité des individus (Head et al., 2013). De plus, ces méthodes manquent de précision pour mesurer les changements à petite échelle (Head et al., 2013), dépendent de variables difficiles à mesurer (Bradley et al., 2008; Kühl et al., 2008; Mathewson et al., 2008; Guschanski et al., 2009), et sont difficiles à reproduire et à standardiser en raison d'une expérience parfois inégale des utilisateurs de la technique, des biais d'observation, et des différences dans les efforts d'échantillonnage (Ahumada et al., 2013).
Avec l'arrivée des caméras numériques de piégeage au cours de la dernière décennie, de nombreux projets de recherche ont commencé à les utiliser pour l'inventaire des vertébrés terrestres, en particulier dans les habitats forestiers, où les taux de rencontre avec les moyens et grands vertébrés sont souvent faibles (Klailova et al., 20 12;
Ahumada et al., 2013; Head et al., 2013; Nakashima et al., 2013). Les can1éras de piégeage sont un outil efficace, à haut rapport qualité/prix, et dont les résultats peuvent être facilement reproductibles (Ahumada et al., 2013). En comparaison avec d'autres méthodes d'échantillonnage sur le terrain, elles sont faciles à standardiser, car l'influence humaine et l'erreur sont réduites au placement et à l'entretien des caméras, ainsi qu'à l'identification des individus filmés (Ahwnada et al., 20 13). Si la mise en place des caméras de piégeage est conçue correctement, elles fournissent des informations très précieuses sur la co1nmw1auté de vertébrés terrestres suivie, telle que la diversité des espèces, l'occupation de l'espace, l'abondance des individus, la reconnaissance des individus, la structure d'âge des groupes (mâles, femelles, juvéniles), ainsi que les budgets d'activité, les comportements, et les mouvements des
individus (Klailova et al., 2012; Ahumada et al., 2013; Head et al., 2013). Swann et
al. (20 11) considèrent que les données acquises par caméras de piégeage sont en
quelque sorte 'supérieures' à celles des observations directes, puisqu'elles peuvent
être révisées par d'autres chercheurs. De plus, les résultats peuvent être reproduits sur
le terrain de façon saisonnière ou annuelle, et ce pour les mêmes conditions
d'échantillonnage. Enfin, un grand nombre d'études utilisant des caméras de piégeage
ont porté leurs inventaires sur plusieurs espèces à la fois (Giman et al., 2007; Jiménez et al., 2010; Head et al., 2012; Ahumada et al., 2013; Head et al., 2013), mettant en évidence le grand potentiel des caméras quant aux interactions entre les espèces et au suivi de la biodiversité (Burton et al., 20 15). Toutefois, bien que l'adoption de nouvelles technologies comme celle des caméras présente de nombreux atouts, sans
le développement parallèle des méthodes d'analyses des données issues des can1éras, cette technologie ne pourra être systématiquement implantée dans les programmes de biomonitoring des espèces de grands singes (Burton et al., 2015).
Utilisation des caméras de piégeage en combinaison avec les modèles statistiques de
capture-recapture
L'utilisation de caméras de piégeage pour l'estimation des densités des commw1autés animales a fait ses preuves lorsqu'elle est combinée à une approche d'analyse
statistique de type Capture-Recapture (C-R) (Winarni et al., 2005; Karanth et al.,
2006; Kelly et al., 2008; Sollmann et al., 2011; Blanc et al., 2013; Borah et al., 2013;
Head et al., 2013; Spehar et al., 2015). Cette technique, sous sa forme la plus simple, s'appuie sur 1 'idée que la taille d'une population peut être estimée par la capture et le marquage des individus. La recapture de quelques individus à un moment ultérieur permet alors d'estimer le nombre d'individus dans la population, et ce en comparant la proportion d'individus recapturés (c'est à dire des individus identifiés plus d'une
fois), avec le nombre total d'individus capturés (White et al., 1982). Deux conditions principales sous-tendent la théorie de C-R pour estimer l'abondance: 1) la population est démographiquement et géographiquement fermée (pas de naissances, de décès, d'immigration ou d'émigration pendant la période d'échantillonnage), 2) les individus marqués sont identifiés correctement (pas de perte des marques), et 3) la variation dans la probabilité de capture entre les individus de la population peut être modélisée. Effectuer de courtes périodes d'échantillonnage peut augmenter les chances de respecter la condition de fermeture de la population. Cependant, être capable de modéliser correctement la variation dans les probabilités de détection reste l'un des principaux défis dans le développement de modèles de C-R, toute hétérogénéité non modélisée provoquant un biais dans l'estimation de la taille de la population (White et
al., 1982; Burton et al., 20 15).
L'ensemble de modèles de C-R le plus couramment utilisé comprend des modèles où la probabilité de capture est constante, varie avec le temps, en réponse à la capture, au sein des individus, ou avec une combinaison de ces facteurs (Otis et al., 1978; White et al., 1982). Cependant, étant donné que la probabilité de détection dépend aussi de l'emplacement des individus, la nature spatiale des données de capture-recapture peut être utilisée pour déterminer les probabilités de capture (Borchers et Efford, 2008).
Les modèles spatialement explicites de capture-recapture (SECR) utilisent l'information de localisation des individus capturés pour modéliser leurs mouvements à l'intérieur et au-delà de la zone d'échantillonnage, et intègrent ce mouvement à l'estimation de la densité (Efford, 2004). De récentes études ont montré que lorsque les conditions de ces modèles sont satisfaites, ils peuvent donner les informations les plus fiables quant à la taille et aux tendances temporelles de la population ou de l'espèce (Ancrenaz et al., 2012). Le développement des modèles SECR a pris de l'ampleur au cours des dernières années et une variété de méthodes existe à ce jour (Royle et Young, 2008; Marques et al., 2012; Borchers et al., 2014; Chandler et
Clark, 2014; Reich et Gardner, 2014; Roy le et al., 2014; Efford, 2015; Ramsey et al., 2015). Ces modèles se basent sur l'indépendance et la distribution aléatoire des
mouvements des individus dans la zone d'échantillonnage (Efford, 2004). Toutefois,
aucune étude de validation n'a encore été réalisée avec les grands singes, il reste donc à voir s'ils peuvent être appliqués au suivi des populations de chimpanzés. Contrairement aux hypothèses qui sous-tendent les modèles SECR, les chimpanzés
ne se mélangent pas au hasard dans une population, montrent un comportement
territorial, et occupent des domaines vitaux bien définis (Teleki et al., 1976; Mitani,
2006), suggérant qu'il y aurait une grande hétérogénéité de capture entre les individus
de différentes communautés (Kühl et al., 2008). Les rares études qui ont utilisées les
méthodes SECR sur des populations de grands singes montrent toutefois que la
méthode semble efficace dans l'estimation des densités, étant comparable aux autres
méthodes utilisées couramment sur le terrain (Head et al., 2012, 2013; Spehar et al.,
2015).
Contexte et objectifs de l'étude
Les baisses alarmantes notées lors des derniers recensements des populations de
chimpanzés d'Afrique occidentale montrent qu'il est important de trouver des
méthodes de suivi applicables à grande échelle afin de pouvoir guider les futures
décisions de conservation, telles que la sélection et la mise en place d'aires protégées,
la détermination du statut de l'espèce selon les critères de l'UICN, et l'identification
des menaces qui pèsent sur sa survie. Pour ce faire, il est nécessaire d'évaluer la
validité des méthodes de suivi non intrusives telles que les caméras de piégeage, qui
ont montré de grandes possibilités pour le suivi des populations. Pourtant, aucune
étude de ce type n'a encore été réalisée. En fait, les études portant sur la validation des
chimpanzés, Kouakou et al. (2009) sont les seuls à avoir testé la validité d'une méthode de suivi courante, celle du recensement du nombre de nids fabriqués par les chimpanzés dans les arbres à chaque soir. Cependant, puisque cette méthode dépend de variables qui varient de site en site et entre les saisons, cette étude de validation ne s'applique qu'aux inventaires réalisés au Parc National Taï. Facilement applicables à grande échelle, les recensements par échantillotmage génétique sont de plus en plus utilisés pour l'évaluation des densités de grands singes. Pourtant, ici encore, aucune étude de validation sur une population suivie à long terme n'a été réalisée. Ainsi, de par le manque d'études qui comparent la méthode des caméras de piégeage à des méthodes déjà prouvées sur le terrain, et de par les nombreux avantages qui sont reliés à l'utilisation des caméras, il est essentiel de valider la méthode et les analyses statistiques qui en découlent, et ce en vue d'assurer un meilleur suivi des populations de grands singes.
L'objectif principal de mon étude consiste à valider la technique des caméras de piégeage au moyen des modèles de capture-recapture (CR) pour estimer la densité d'une conm1unauté connue de chimpanzés d'Afrique occidentale dans le Parc National de Taï, en Côte d'Ivoire. Plus précisément, je vise à déterminer: 1) quelle est la meilleure méthode C-R pour estimer les densités de chimpanzés utilisant les caméras de piégeage, 2) quel est l'effort de piégeage optimal, et 3) si un placement aléatoire des caméras peut fournir des données suffisantes pour des estimations de densité précises et robustes. Afin de répondre à ces trois objectifs spécifiques, j'ai mené pendant 1 0 mois une étude au moyen de caméras de piégeage sur le tetTitoire d'une communauté de chimpanzés habituée à la présence humaine, et où la densité totale de chimpanzés est donc déjà connue. Afin d'estimer la densité des populations de chimpanzés au moyen des données de caméras de piégeage, j'ai utilisé trois différentes approches courment utilisées dans l'estimation de densités de populations: les courbes d'accumulation, les modèles de capture-recapture classiques, et les modèles spatialement explicites de capture-recapture. J'ai ensuite comparé leur
exactitude et leur précision afin de déterminer quelle approche est la plus appropriée pour le suivi des populations de chimpanzés. L'exactitude renvoie au biais exprimé en pourcentage de différence par rapport à la densité connue, et la précision a été mesurée au moyen de l'étendue de l'intervalle de confiance autour de la valeur moyenne des estimations de la densité. Afin d'identifier l'effort de piégeage optimal,
défini comme le temps de piégeage minimum requis pour les estimations les plus exactes et les plus précises, j'ai estimé 1 'exactitude et la précision des estimations de densités pour différents efforts de piégeage en variant le nombre de semaines où les caméras opéraient. Enfin, afin de déterminer si un placement aléatoire des caméras pouvait donner des mesures de densité fiables, j'ai estimé la densité des chimpanzés à partir de données issues de caméras placées de façon systématique (à chaque kilomètre sur une grille de 1 x 1 km2), puis comparé les probabilités de capture sous
ce placement avec celles des caméras placées à des endroits fréquemment visités par les chimpanzés.
CHAPITRE!
V ALIDA TING THE USE OF CAMERA TRAPPING AND CAPTURE-RECAPTURE MODELS TO ESTIMA TE DENSITIES OF THE ENDANGERED
WESTERN CHIMPANZEE (PAN TROGLODYTES VERUS) IN TAÏ NATIONAL PARK, IVORY COAST
1. 1. ABSTRACT
Accurate density estimates are essential to assess the effects of specifie threats,
measure the success of management decisions, and understand the ecology of primate populations. As a result, great ape conservation and ecology demands a good
understanding of demographie trends, density, and distribution of great ape
populations. Camera trapping combined with capture-recapture (C-R) modeling has recently been developed to overcome past limitations of great ape population assessment techniques, possibly increasing the efficiency in density estimation. However, no validation of the method has yet been done with great apes. The three main objectives of this study were to identify: 1) what was the best C-R method to estimate chimpanzee densities using camera traps, 2) what was the optimal trapping effort, defined as the minimum trapping time required for the less biased and most precise estimates, and 3) whether a systematic grid of traps randomly located within the study area could provide sufficient data for robust abundance and density estimates. In order to address these three objectives, a 1 0-month can1era trapping study was conducted on the terri tory of a habituated chimpanzee community, where total chimpanzee density is already known. Three commonly used approaches to
estimate density were compared: accumulation curves, conventional capture-recapture models, and spatially explicit capture-recapture models (SECR). Cameras were placed according to two different camera placements: a systematic one, where cameras were placed every kilometer, and a targeted one, where cameras were placed
at locations frequently visited by chimpanzees. Effective sampling area (ESA) was calculated using tracking data from at least one focal individual combined over 174 days throughout 2013-2015, and ail members of the community were followed at least once. The results show that all three methods gave accurate and precise density
estimates that were generally comparable with one another (i.e. overlapping 95% Cls).
Estimates from CAPTURE and MARK were the most accurate, and densities
estimated by accumulation curve techniques were always less accurate than the other methods. Within each method (except accw11ulation curves), there was no significant variation between estimates from the model that did not consider heterogeneity in
capture probability and estimates from the models that did. This suggests that
heterogeneity in capture probability was minor. 1 propose that SECR models should
be used to estimate chimpanzee densities via camera traps. The results show that the
method is more accurate and more precise than other census methods commonly used to census great ape populations. At last, the results have shown that detection probabilities are highest under a targeted placement, but that a systematic layout still yields accurate estimates. This study thereby emphasizes the suitability of combining
C-R and SECR modeling and camera trapping as useful monitoring tools for great ape conservation and ecology.
1 1
1
1.
1.2. INTRODUCTION
For conservation management to be effective on the long term, researchers need to obtain accurate census data from which change can be easily and continuously measured. However, in large rainforests, estimating great ape densities can be difficult as locations can be hard to access, visibility is very low, and individuals are elusive and highly mobile. As a result, indirect methods such as nest or dung counts are most often used to estimate population densities (Anderson et al., 1983; Blom et
al., 2001; Dupain etal., 2004; Devos etal., 2008; Kühl etal., 2008; Todd etal., 2008;
Kouakou et al., 2009; Granier et al., 2014 ). Y et, fixed relationships between nest numbers or dung piles and great ape densities do not exist, as both nest decay or dung production rates need to be known, and have been found to vary between field sites, climates, seasons, and individuals (Kühl et al., 2008; Mathewson et al., 2008; Todd et
al., 2008). Data collection for these variables requires considerable investment of time and effort, and thus their values mostly remain unknown across sites (Todd et al., 2008; Kouakou et al., 2009; Spehar et al., 2015). Imprecision and bias of density estimates from indirect signs may also be created by inter-observer error, low encounter rates, and nest reuse and production rates (Bradley et al., 2008; Kühl et al.,
2008; Guschanski et al., 2009).
In arder to overcome these difficulties, population assessment technologies in conjunction with advances in capture-recapture modeling have been developed (Arandjelovic et al., 2010; Moore and Vigilant, 2013; Head et al., 2013; Roy et al., 2014; Spehar et al., 2015). These require a set of detectors to be deployed in which individuals from an animal population can be directly or indirectly captured, marked and released. In its simplest form, population size can then be inferred by calculating the proportion of individuals already marked when caught at another occasion (White
et al., 1982). Detectors can take various forms: physical traps (Borchers and Efford,
et al., 2012), haïr snares (Howe et al., 2013), but area searches for fecal samples (Arandjelovic et al., 2010; Moore and Vigilant, 2013; Roy et al., 2014; McCarthy et al., 2015) and camera traps (Head et al., 2013; Spehar et al., 2015) have been the types of detectors most extensively used with great apes. Genetic censuses via collection of fecal samples have shown more accurate results than nest counts, but individuals can be missed in sweeps, and the method remains to be validated on a known population (Arandjelovic et al., 2010; Roy et al., 2014; McCarthy et al., 2015).
The use of camera traps with capture-recapture (C-R) statistical analysis has proven successful for density estimation in severa! surveys of large mammal species (Karanth and Nichols, 1998; Kelly et al., 2008; Royle et al., 2011; Gray and Prum, 2012; Noss et al., 2012; Sollmann et al., 2012; Weingarth et al., 2012; Borah et al., 2013; Tobler et al., 2013), including great apes (Head et al., 2013; Spehar et al., 20 15). Camera traps have shown higher species detection rates (Bowkett et al., 2006),
and are able to take records of the most elusive and rare species (Carbone et al., 2001; Pettorelli et al., 2009). When individuals can be distinguished from one another, individual-level data can be obtained, and this with relatively low effort (Head et al., 2013; Boyer-Ont! and Pruetz, 2014). Two main assumptions underlie C-R theory: 1) the population is demographically and geographically closed (i.e., no births, deaths, immigration or emigration throughout the sampling period); and 2) variation in capture probability can be accounted for. Ensuring sampling periods are short enough can increase chances that the assumption of population closure will be met. However,
being able to correctly mode! variation in individual detection probabilities has remained one of the main challenges in the development of capture-recapture models, ali unmodeled individual heterogeneity causing bi ases in the estimation of population size (White et al., 1982; Burton et al., 20 15).
The most commonly used set of capture-recapture models are those elaborated by Otis et al. (1978), which were further implemented in computer programs such as
CAPTURE (White et al., 1978) and MARK (White and Burnham, 1999). This set includes models where capture probability is constant (Mo), varies with time (Mt), with behavioural response to capture (Mb), among individuals (M11), or with a
combina ti on of these factors (Mth, Mtb, Mtbh) (White et al., 1982).
However, since probability of detection also depends on the location of animais, the spatial nature of the capture-recapture data can be used to determine capture probability (Borchers and Efford, 2008). Spatially explicit capture-recapture models
(SECR) include the location of detections from capture-recapture studies and are
therefore able to model the variation in exposure to detectors of animais whose
activity centers are distributed throughout the sampled habitat (Efford and Mowat, 2014). SECR models can also incorporate other sources of variation in capture probability, such as sexual and individual differences in ranging patterns (Sollmann et al., 2011; Tobler et al., 2013). Y et, their validity for density estimation of gregarious and territorial species like chimpanzees remains to be tested using camera traps.
SECR models are based on the assumption that individuals move independently and
are randomly distributed across the sampling area (Efford, 2004). Chimpanzees do
not mix randomly within a population, show ten·itorial behaviour, and occupy defined home ranges (Teleki et al., 1976; Mitani, 2006), suggesting that there would be large
capture heterogeneity between individuals (Kühl et al., 2008). No standardized
method has yet been developed to estimate chimpanzee densities via camera traps and
C-R models, and thus further assessments and developments are needed before the
method can be used to guide management and conservation decisions (Kühl et al., 2008).
From 1995 to 2007, the population size of western chimpanzees (Pan troglodytes verus) living in Côte d'Ivoire declined by an alarrning 90%, a country which rell!ains to be thought of as one of the final refuge for this subspecies (Campbell et al., 2008).
Taï National Park (TNP) in South Western Côte d'Ivoire harbours long-term research sites on chimpanzee behaviour and ecology (Campbell et al., 2008; N'Goran et al.,
2013). Four chimpanzee communities living in the park have gradually been habituated to human presence since the 1980s (Boesch and Boesch-Achermann, 2000), and thus offer a unique opportunity to validate approaches used to estimate densities from capture-recapture models using camera trap data.
The overall goal of my study was to validate the use of camera trapping m combination with capture-recapture models to estimate the density of a habituated community of western chimpanzees in Taï National Park, Ivory Coast. More specifically, 1 aimed to identify: 1) what the best C-R method to estimate chimpanzee densities is using camera traps, 2) what the optimal trapping effort is, and 3) whether a systematic grid of traps randomly located within the study area could provide sufficient data for robust abundance and density estimates. In arder to address these three objectives, 1 conducted a 1 0-month camera trapping study on the terri tory of a habituated chimpanzee community, where chimpanzee total density is already known. 1 calculated density estimates from camera trap data using three commonly used density estimation approaches: accumulation curves, closed capture-recapture models in CAPTURE and MARK, and spatially explicit capture-recapture models, and then compared their accuracy and precision. Accuracy was defmed as the percentage of bias from the known density, and precision as a measure of the confidence interval width. In _arder to identify the optimal trapping effort, defined as the minimum trapping time required for the less biased and most precise estimates, 1 estimated accuracy and precision of density estimates for various numbers of camera trapping weeks (i.e. number of occasions). At last, 1 calculated density separately for each camera trap layout and assessed whether accuracy and precision of estimates under the systematic layout were high, and compared detection probabilities for each layout, in arder to see whether a systematic layout of cameras could be used to monitor chimpanzee populations.
1.3. METHODS
1.3.1. Study site and subjects
The study was conducted from June 2014 to March 2015 (total of 273 days) in Taï National Park, Ivory Coast (5°08'N to 6°407'N, and 6°47'W to r25'W). Average annual rainfall in the study area is approximately 1800 mm and annual average temperature between 24 and 30°C (Anderson et al., 2005). In the eastern part of the park, a chimpanzee community ( called the "East community") has gradually been habituated to human presence and followed on a daily basis since the 1980s by researchers and assistants of the Taï Chimpanzee Project (TCP) (Figure 1.1) (Boesch and Boesch-Achermann, 2000).
Trac king data from 2013 to 2015 (total of 154 da ys) of at least one focal individual per day of the east community was used to calculate the 95% fixed kemel density estimate of community territory size, using the Geographie Information System software ArcGIS 9.2 (Environmental Systems Research Institute, Redlands, USA), with the extension module Hawths Tools (Beyer, 2004). This resulted in an estimated area of 40.37 km2, hereafter considered as the "effective sampling area" (ESA). Focal follows of members from the east community carried out simultaneously as the camera trapping survey allowed knowing that, throughout the study period, the community was composed of a total of 36 individuals. Of these, an adult female and her infant disappeared, one juvenile was found dead, and two subadult females were seen leaving the group and coming back throughout the sampling period, although the last two individuals remained in the community for most of the duration of the study period. These closure violations will be discussed in the appropriate section of the discussion. Known density of the effective sampling area was thus calculated as 0.89 ind/km2 (D=36/40.37 km2).
1.3.2. Camera trap layout
A total of 81 (mean: 64, range: 13-81) cameras (Bushnell Trophy Cam™;
http://bushnell.com) were deployed over the 1 0-month period across an area of 42
km2 (figure 1.2). Using a grid of cells lxl km2 that overlapped the territory of the east community, I placed cameras according to two layouts: a systematic (total of 23 cameras) and a targeted layout (58 cameras). Systematic cameras were placed at the
intersections of cells in the core of the territory, within 30 meters of the point given
by the GPS, and oriented towards the geographie north. Within each cell, targeted
cameras were installed at locations frequently visited by chimpanzees, with a
maximum of two cameras per cell. These locations included potential tool use sites (i.e. nut cracking sites, army ants nests), small water hales, natural bridges, fruiting trees, and trails. Ail cameras were placed between 0.3 (ex: nut cracking sites) to 1.6 meters (ex: natural bridges) above the ground. Ali cameras were set to a high
sensitivity. Motion detectors were prograrnmed to trigger as soon as movement was
detected, and were active 24 hours a day. Videos were recorded for a period of 60 seconds. In cases where individuals were in front of the camera for severa! minutes,
continuous 60s videos were recorded with an interval of minimum one second.
Cameras recorded date and time at which individuals were filmed. Ali cameras were visited once or twice a month, and batteries, silica gel, SD cards and cling film
protecting the cameras were changed. The targeted placement aimed to increase the probability of filrning individuals, and thus, when the data on SD cards showed that
no chimpanzee was filmed within the last month; targeted cameras were moved to
another targeted location within the same cell. This resulted in a total of 103 camera locations for the targeted placement (Figure 1.2). Systematic cameras were never moved and thus remained at the same locations throughout the entire study period.
1.3.3. Data collection
For each video that recorded a chirnpanzee, 1 noted the date and tirne of the video, the GPS location of the camera, as well as the identity of the chirnpanzees that were filrned. Capture histories were calculated for each individual for a total of 39 trapping occasions, where one occasion represented seven consecutive can1era trapping days (total of 273 days). Systernatic cameras were installed one week prior to the targeted cameras, which were thus only active for 38 trapping occasions. Two experienced observers, who knew the chirnpanzees and followed them on a daily basis throughout the study period, identified the chimpanzees that were filrned. Individuals were identified through a cornbination of facial and bodil y characteristics, such as presence of scars, shape and coloration of ears, nose, face, and body (see exarnple in figure 1.3) (Goodall, 1988). Due to lack of tirne, only 25% of videos could be identified by both observers, and thus data used to construct capture histories included identifications made by either of the observers (observer 1: 48 % of aU videos, observer 2: 52 %),
and identifications where both observers agreed, for those cases where both observers identified the chin1panzees. This resulted in a total of 1281 of 1674 (targeted) and 278 of 364 (systernatic) positive identifications. Interobserver reliability was rneasured via Cohen's Kappa coefficient (Cohen, 1960) using the kappa2 function of the 'irr' package (Garner et al., 2012) in R (version 3.2.1; R Core Tearn 2015 .
1.3.4. Density estimation
In order to determine which C-R method gives the most accurate and precise density estirnates, 1 cornpared three conm10nly used approaches to estimate density: (i.)
accumulation curves, (ii.) conventional capture-recapture models, and (iii.) spatially explicit capture-recapture models (table 1.1).
i. Accumulation curves
First, 1 fitted the capture-recapture data with three different accwnulation curve functions commonly used in genetic studies (Eggert et al., 2003; Bellemain et al.,
2005; Lukacs and Burnham, 2005; Petit and Valiere, 2005). Adapted to camera trap data, the curves of the functions are determined by the accwnulation of unique individuals filmed, the asymptotes representing the estimated population sizes. First, 1
estimated population size as Kohn et al. (1999) used to estimate the number of coyotes (Canis latrans) in California. Kohn's et al. function (hereafter "Kohn estimator ") asswnes an accumulation curve ofhyperbolic forn1 and is given by:
E(x) = ax (b+x)
where x is the number of individuals filmed, E(x) the cwnulative number of unique individuals filmed, a the asymptote of the function, and b the nonlinear slope of the
function which declines as x increases. The second accwnulation curve method
("Eggert estimator ") 1 tested has previously been used to estirnate forest elephant (Loxodonta cyclotis) densities in Ghana (Eggert et al., 2003), and asswnes an exponential form of the accwnulation curve. lt is given by: E(x)
= a(l
- e(bx)). The last method was the "Bortz estirnator", which also assun1es a curve of exponential form, and is given by: E(x)= a + bex (Bortz et al., 1990). For each method, the capture histories were bootstrapped 1 000 times to estima te the confidence intervals of a. In order to estirnate density and its precision, 1 divided population size, SEs, and Clu and CI1 (upper and lower 95% confidence intervals lirnits) by total sampling areaii. Capture-Recapture Models
I tested population closure in CAPTURE (White et al., 1978), a test that is based on
the nurnber of occasions between the first and last captures of individuals captured
twice or more (Otis et al., 1978). I th en calculated population size using the computer
programs CAPTURE and MARK (White and Burnham, 1999). CAPTURE (available
online at: http://www.mbr-pwrc.usgs.gov/software/capture.html) includes models for closed populations where capture probabilities are constant (M0), vary with time (M1), with behavioural response to capture (Mb), within individuals (M11) or with a combination of these factors (Mth, Mtb, Mtbh) (White et al., 1982) (table 1.1).
Population sizes in MARK (http://wamercnr.colostate.edu/-gwhite/mark/mark.htm)
are obtained with the original Otis et al. (1978) models (similar to CAPTURE), as weil as with two-fmite mixture models (Lukacs, 2015). Models in MARK were constructed using the "Closed captures", "Closed Captures with Het.", and t, b, and h
parameterizations, by controlling for variations in initial capture probability and
recapture probabilities using the Parameter Index Matrices (PIMs) (table 1.1) (White,
2008; Lukacs, 2015). Estimates of population size from these two programs were
then used to estimate density by dividing population size, SEs and 95% confidence
intervals by total sampling area.
iii. Spatially Explicit Capture Recapture Models
SECR models include data on the location of detectors, and fit two different models to the spatial detection histories: a spatial mode! of the population and a spatial mode!
of the detection process. The first describes the distribution of home ranges centers
(or activity centers (ACs)) of the individuals from the san1pled population, while the other relates the probability of detecting an individual according to the distance from
each animal's activity center from the detector (Efford, 2015). In the latter, capture probabilities p from the conventional C-R models are replaced by a vector of at !east two parameters: g0 , the probability of detection at the activity center of an animal, and cr, the spatial scale over which capture probability declines (Efford, 2004). I fitted 8 different models (table 1.1) according to variations of effects on g0 and cr, using the
'secr' 2.9 package (Efford, 2015) in R 3.0.1 (R Core Team, 2013). The nullmodelt assumed no effect on g0 and cr, the tmodel that g0 varied with time, the bmodel that g0 varied with behavioural response to capture, the hmodel that g0 and cr varied within individuals, hsex that g0 and cr varied according to sex, hage that g0 and cr varied according to age (adult, sub adult, juvenile, infant), and, at last, the bkmodel, a trap-specific behavioural mode! with effects on g0. Days where cameras were not functioning where accounted for in ali models except in the nullmodel, which assumed no effect on g0 and cr and no variation in trapping effort. All models assumed a Poisson distribution of activity centers and a half normal detection function. In order to estimate density, SECR evaluates the likelihood by surnming values at points on a 'habitat mask', where each point represents a grid cell of potentially occupied habitat. Masks may be constructed using severa! approaches,
such as using GPS data, or automatically generated buffers of arbitrary width placed around the detectors (Efford, 20 15). To test how the choice of habitat mask has on SECR estimates, I first fitted models with a habitat mask created with the tracking data ("polygon" type in 'secr'). Then, I used the function mas k. check fTom the 'secr' package to construct masks of varying buffer width and spacing. These masks are restricted to the points within a given buffer distance of any camera ("trapbuffer" type). To see which trapbuffer width gives the most accurate and precise density estimation, I tested buffer sizes 100, 500, 1000, 2000 and 5000 meters. At last, I used the function suggest.buffer (with a relative bias target of 0.001), which determines a suitable trapbuffer width, to see if the outcome of this function corresponds to the appropriate buffer size in mask.check.
1.3.4.1. Accuracy and precision ofdensity estimates
Models from each method were compared using estimates of accuracy and precision. Accuracy was calculated using the percentage of bias, as: %Bias= ((0.89-D)/0.89)•100, where 0.89 ind/km2 is the known density, and D the density estimated by each mode!. Precision was calculated as the percentage of the confidence interval width, as: %CI= ((Ciu-CI1)/D) •100, where Ciu and CI1 are the upper and lower 95%
confidence intervals values. As they are defined, an increasing percent bias and percent CI suggest an increasingly accurate and precise method. I selected appropriate models and estimators based on accuracy and precision, but accuracy was more important in mode! selection.
1. 3. 5. Optimal trapping effort
Optimal trapping effort, defined as the minimal effort required for the most accurate and precise density estimates, was determined by comparing density estimates for various trapping occasions (10, 20, 30 and 38 (targeted) and 39 (systematic) weeks).
1.3.6. Systematic camera trap placement
Density was calculated separately for each camera trap layout. Since both layouts did not involve the same number of camera traps, accuracy and precision of density estimates cannot be compared between both layouts. However, SECR models including trap covariates offer the possibility of calculating trap-specific detection probabilities (Efford, 2015). As a result, trap-specific initial detection probabilities (gO) from SECR models were compared between both layouts in order to see which
layout yielded higher detection probabilities.
1.4.RESULTS
For a total of 39 sampling occasions of 7 days each, 595 videos of chimpanzees were
recorded, of which 514 were taken under the targeted placement and 81 under the
systematic one. Up to 36 unique individuals were filmed, and thus all individuals of the group were filmed at least once. Mean capture frequency was of 6 captures (range
0-1 0) for the systematic placement and 16 (range 1-25) for the targeted placement.
Considering only adults, males had sirnilar capture frequencies for both the
systematic (mean: 8.6, range: 6-10, as opposed to 6.89, range: 4-10 for females) and the targeted (mean: 21.6, range: 17-25, females: mean: 15.9, range: 13-22) layouts. Adults (systematic: mean: 7.5, range: 4-10; targeted: mean: 17.9, range: 16-25) had slightly higher capture frequencies than subadults, juveniles and infants (systematic: mean: 6.73, range: 1-10; targeted: mean: 16.8, range: 10-25) (see appendix 1 for
individual capture frequencies).
1.4.1. Density estimation
Closure tests in CAPTURE for both systematic (p<0.001) and targeted (p<0.001) data
showed closure violation. This was indeed the case since three individuals
disappeared and two individuals temporarily left the group during the study period.
Still, density estimation remained precise and accurate for most methods. Models with most accurate density estirnates and related Cls for each method are shown in figure 1.4. Except estimates from MARK under the systematic layout, all models
included the true density within their 95% confidence intervals. Estirnates from
CAPTURE and MARK were the most accurate in both layouts, and densities
estimated by accumulation curve techniques were always less accurate than the other
methods. SECR estirnates had the highest %CI, not going lower than 66.5% (fig. 1.4;
table 1.2). Models selected according to variation in p, as well as estimates of D of
MARK and CAPTURE, varied only under the systematic layout. Within each method
( except accumulation curves ), there was small variation between estima tes from the
model selected as most accurate and estimates from the Mo model, suggesting minor heterogeneity in capture probability (see appendix II for estimates from ali models).
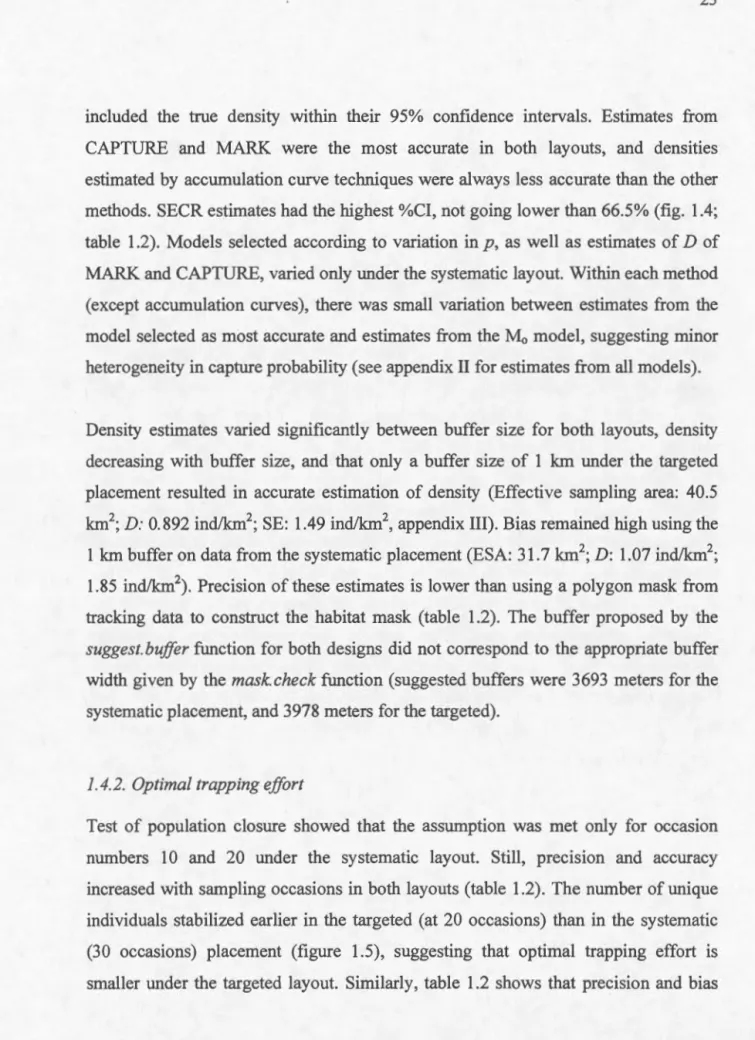
Density estimates varied significantly between buffer size for both layouts, density decreasing with buffer size, and that only a buffer size of 1 km under the targeted placement resulted in accurate estimation of density (Effective sampling area: 40.5 km2; D: 0.892 ind/km2; SE: 1.49 ind/km2, appendix III). Bias remained high using the
1 km buffer on data from the systematic placement (ESA: 31.7 km2; D: 1.07 ind/km2;
1.85 ind/km2). Precision of these estimates is lower than using a polygon mask from
tracking data to construct the habitat mask (table 1.2). The buffer proposed by the
suggest. buffer function for both designs did not correspond to the appropriate buffer
width given by the mask.check function (suggested buffers were 3693 rneters for the
systernatic placement, and 3978 meters for the targeted).
1. 4. 2. Optimal trapping effort
Test of population closure showed that the assumption was met only for occasion
numbers 10 and 20 under the systematic lay out. StiJl, precision and accuracy
increased with sampling occasions in both layouts (table 1.2). The number of unique
individuals stabilized earlier in the targeted (at 20 occasions) than in the systematic
(30 occasions) placement (figure 1.5), suggesting that optimal trapping effort is
reach a plateau around 20 occasions under the targeted layout, and slightly later, at 30
occasions, for the systematic layout. Precision and accuracy of estimates at 39 occasions un der the systematic lay out were similar to tho se at 1 0 occasions un der the targeted layout.
1. 4. 3. Systematic layout
All 36 members of the community were filmed under the targeted placement,
whereas under the systematic placement, two individuals (a female and her infant)
were not filmed. Since both individuals disappeared at the beginning of the study, more effort (i.e. more sampling occasions) would not have increased chances of filming them. The targeted trap layout also yielded higher detection probabilities than the systematic one. Average initial detection probabilities (gO) across all individuals,
traps, and occasions estimated from null SECR models were 0.024 at targeted and
0. 01 0 at systematic traps, indicating that overall, targeted traps were more than twice as likely to detect chimpanzees. CR estimates of detection probability (p) from targeted and systematic arrays cannot be compared directly because they are specifie to the array of traps rather than individual traps, and more targeted traps were
deployed (mean numbers of traps operating per occasion were 45.26 for targeted and 19.49 for systematic layouts (ratio
=
2.32)). Still, accuracy and precision after 38 occasions under the systematic layout were high (table 1.2).1.5. DISCUSSION
1. 5.1. Density estimation
To my knowledge, this is the frrst study validating the use of capture-recapture models and camera trapping for the density estimation of a habituated great ape community. My results show that accumulation curves, conventional capture-recapture and spatially explicit capture-recapture models gave accurate and precise density estimates that were generally comparable with one another (i.e. overlapping 95% Cis). Still, accumulation curves constantly under- or overestimated density. Whereas the method does not account for any variation in capture probabilities
(Gotelli and Graves, 1996), conventional C-R and SECR models include
heterogeneity of a variety of factors and thus allow for better modeling of detection probabilities, which is crucial for accurate density estimation.
There were no significant differences between the capture-recapture models that considered various sources of heterogeneity in capture probability (M11, Mt, bkmodel,
etc.) and the nul! models (M0 , nul/modeZ, etc.), which did not consider any variation, revealing that capture heterogeneity was minor. In CAPTURE, Chao's estimators (1988, 1989) were the most accurate. These were designed for sparse data (Chao, 1989), and are the most robust to non-independence of captures (Boulanger et al., 2004).
C-R estimates were accurate and precise although assumption of population closure was not met throughout the study period. This might be due to the high number of recaptures for most individuals found in the study area. Studies with lower number of recaptures should therefore be cautious when using closed population models on open populations. Nevertheless, precise and accurate density estimates from open populations have also been noted in the past (Head et al., 20 13), and th us relaxation
oftrus assumption seems to be possible when sampling effort is high.
1. 5.1.1. Validating the use of SECR models for chimpanzee density estimation and ils
implications for future mode! developments
Spatially explicit capture-recapture models address many of the limitations of traditional capture-recapture models, but they are based on a set of assumptions hard
to be met when used with chimpanzees. SECR models were developed for solitary and non-territorial species, and thus assume independent and randomly distributed
activity centers (ACs) (Efford, 2004). This is not the case in chimpanzees, since they form social groups ranging from a few individuals to more than 150 (and thus ACs are not independent), and exhibit territorial behaviour (ACs are not randomly
distributed) (Teleki et al., 1976; Mitani, 2006). Furthermore, since the study was
done on the territory of one community of chimpanzees, the A Cs of individuals were
not distributed homogeneously throughout the sampling area as the SECR models assumed they did: rather, individual ranges overlapped and activity centers were clustered around the middle of the sampling area. As a result, ali san1pled individuals had an equal probability of detection, since their ACs were centered around the same
location. Still, as my results have shown, the violation of these SECR assumptions has not affected the accuracy of the estimates, as reflected by their low %Bias.
Similarly, using multi-catch traps, Efford et al. (2009b) note that SECR estimates were robust to the failure of assumptions of independence and uniformity of ACs. As
Royle et al. (2014) explain, assuming a homogeneous distribution of ACs still
permits for infinite possible distributions of points without violating the assumption of spatial randomness. Independent, uniform points will almost never seem regularly or systematically distributed. Given that capture rates are rugh, the spatial randomness
the uniform distribution hypothesis is only assumed a priori. SECR models include the spatial information of at least sorne individuals of the population in their density estimation, and thus their robustness is directly afÎected by the quantity and quality of the collected data. As a result, the bias potentially caused by violating the assumptions decreases as the total captures and individual capture frequencies increase, stressing the importance of effective sampling effort.
Estimates of chimpanzee densities from SECR were the less precise, exhibiting a minimum %CI of 66.5%. SECR models include the spatial variation of the distribution of individuals in the variance of their density estimates, and thus standard errors and confidence intervals are often higher with this method then with conventional C-R models (Obbard et al., 2010; Gerber and Parmenter, 2015). As a result, they are able to include more sources of variation in capture probabilities, an important feature that is ignored in conventional capture-recapture models (Obbard et al., 2010).
At a first glanee, a precision of 66.5% may seem high, but comparisons with other studies that tested census approaches on great apes show that the density estimates obtained via camera trap data and SECR models were most often more precise and more accurate than those obtained via other methods. In Taï National Park, Kouakou
et al. (2009) conducted a 12-month study on the validation of severa! nest count methods to census chimpanzees from three of the habituated communities in the park. Estimates of abundance were Jess precise (%CI of 102 to 121% ), and less ace urate (%Bias of 5.4 to 97.3%) than the estimates obtained from camera trap data. Kouakou
et al. (2009) being the only other study validating a census approach on a habituated great ape population, accuracy of the density estimates from this study cannat be compared with other census methods. However, precision can be compared with other recent censuses done on great ape populations. Genetic sampling seems to yield more precision in density estimation: recently, Roy et al. (2014) estimated mountain
gorillas (Gorilla beringei beringei) abundance in Uganda usmg genetic
capture-recapture techniques and found an estimate precision (%CI) of 20.7%. True density
was unknown, but the authors reported that the method seemed to downwardly bias
the miniml!ID abundance estimate, as an important proportion of groups and
individuals were missed in either of the two sweeps realized. Combining spatially
explicit capture-recapture modelling with genetic sampling, McCarthy et al. (20 15)
had similar values of precision (%CI of 21.6%) for their abundance estimates of
eastern chimpanzee in population size in fragmented habitat in Uganda. However,
with chimpanzees in Tanzania, Moore and Vigilant (2014) had less precise results in
density estimation through SECR and genetic sampling (%CI of 88%). Precision of
census estimates thus seems to vary between studies, but Head et al. (2013) and
S pehar et al. (20 15) also noted that the ir SECR estimates from camera trap data were
more precise than those from nest counts and genetic sampling.
Nevertheless, I have also shown that the use of telemetry data to estimate effective
sampling area was crucial for accurate density estimates in SECR. When
conservation managers do not have access to tracking data, the 'secr' package offers
the option of calculating effective san1pling area by adding a buffer strip around the
detectors (i.e. cameras) (Efford, 20 15). Testing various buffer widths showed that
densities varied significantly with buffer size, density decreasing with increasing
buffer size, and that only a buffer of 1 km resulted in accurate density estimates. This
is likely due to the fact that the sampling area covered the territory of only one
community of chimpanzees. Since chimpanzees are territorial, probability of
detecting individuals drastically drops at a given distance from the detectors,
contrarily to the binomial distribution expected by the model. As a result, I suggest
that future camera trapping studies on great apes should extend sampling area over
SECR models are especially of interest in conservation ecology because they can be used to study a variety of ecological processes, such as landscape connectivity (Sutherland et al., 2015), response to specifie threats (Christiansen et al., 2014;
Pirotta et al., 2014), and spatial variation in density (Efford et al., 2009a). These
implications extend and increase the applicability and value of capture-recapture theory for research on animal populations.
However, while this study validated the use of SECR despite violation of its core
assumptions, there is still a need for future model development to account for biological and behavioral processes, such as attractive and repulsive interactions
among individuals caused by territoriality and sociality. Very little research has been done on this topic. Reich and Gardner (2014) have been the first to propose a model that accounts for a spatial variation in density and potential repulsive interactions between individuals' activity centers, but it is only applicable to solitary species. The validity of SECR modelling for group living species thus remains to be tested with other gregarious and territorial species. Future studies should also focus on sampling
larger areas, which are covered by severa! comrnunities of chimpanzees, so that sampled individuals do not have equal probability of capture according to the locations of their activity centers. Camera trap array should thus be greater than the home ranges of chimpanzee comrnunities of the study area. Albeit these limitations, I
suggest that SECR models are chosen to estimate chimpanzee densities with camera
traps, since they offer accurate results and include more sources of variation in their precision then conventional capture-recapture models. This is an important feature
that should be considered in future censuses of great ape populations, since conservation management needs to include all possible sources of uncertainty in the data used to make conservation decisions.
1. 5. 2. Optimal trapping effort
The results have shown that increasing the nurnber of occasions will increase both
accuracy and precision of density estimates. Comparing estimates from various
occasion numbers has shown that under a targeted placement, a minimum survey
period of 20 weeks is required, if encounter rates are similar to the ones from this
study. This period should be longer in case of a systematic placement, which required
30 to 40 weeks for good density estimation.
1.5.3. Systematic layout
Heterogeneity in capture probability between individuals remams a challenge in
density estimation because it is difficult to identify all sources of variation and to model them appropriately. Therefore, the best option is to simply remove the effects of heterogeneity by increasing the chances that most individuals of the population
will be caught several times (Gerber and Parmenter, 20 15). With this study, I have
found that targeted placement of cameras can double the detection probabilities of
individuals. The advantages include increased estimate precision and accuracy, and the need for less sampling length or effort (Gerber and Parmenter, 2015). Still, the
systematic layout yielded quite accurate estimates, and thus could be used in studies
that have no effort to invest in the search of targeted locations, when the distribution
of the chimpanzees under study is still unknown, or when trying to monitor several species at the same time. However, when chimpanzees are the focus of camera trap survey, a little extra effort should be invested to place the cameras in a way to maximize capture probabilities. With chimpanzees, this means placing them at frequently visited locations, such as trails, fruiting trees, natural bridges, and tool use
sites. Tool use sites were especially good to obtain close-up videos of individuals, but not ali individuals were filmed at those sites. However, cameras placed on trails or