HAL Id: hal-01602335
https://hal.archives-ouvertes.fr/hal-01602335
Submitted on 5 Jun 2020
HAL is a multi-disciplinary open access
archive for the deposit and dissemination of
sci-entific research documents, whether they are
pub-lished or not. The documents may come from
teaching and research institutions in France or
abroad, or from public or private research centers.
L’archive ouverte pluridisciplinaire HAL, est
destinée au dépôt et à la diffusion de documents
scientifiques de niveau recherche, publiés ou non,
émanant des établissements d’enseignement et de
recherche français ou étrangers, des laboratoires
publics ou privés.
Distributed under a Creative Commons Attribution - ShareAlike| 4.0 International
License
Eliciting strategies and tasks in uncertainty-aware data
analytics
Nadia Boukhelifa, Marc-Emmanuel Perrin, Samuel Hurron, James Eagan
To cite this version:
Nadia Boukhelifa, Marc-Emmanuel Perrin, Samuel Hurron, James Eagan. Eliciting strategies and
tasks in uncertainty-aware data analytics. IEEE VIS 2016 Conference on Visual Analytics Science
and Technology, Oct 2016, Baltimore, United States. 2 p. �hal-01602335�
Eliciting Strategies and Tasks in Uncertainty-Aware Data Analytics
Nadia Boukhelifa∗ Marc-Emmanuel Perrin† Samuel Hurron‡ James Eagan§
T ´el ´ecom ParisTech & LTCI, Universit ´e Paris-Saclay
ABSTRACT
Uncertainty plays an important and complex role in data analysis and affects many domains. To understand how domain experts analyse data under uncertainty and the tasks they engage in, we conducted a qualitative user study with 12 participants from a vari-ety of domains. We collected data from audio and video recordings of think-aloud demo sessions and semi-structured interviews. We found that analysts sometimes ignore known uncertainties in their data, but only when these are not relevant to their tasks. More of-ten however, they deploy various coping strategies, aiming to un-derstand, minimise or exploit the uncertainty. Within these coping strategies, we identified five high level tasks that appear to be com-mon acom-mongst all of our participants. We believe our findings and further analysis of this data will yield concrete design guidelines for uncertainty-aware visual analytics.
1 INTRODUCTION
Before visualization designers can express a need for specifically tailored tools to explore uncertain data, we have to understand how, in practice, analysts treat uncertainty information. Such investiga-tion can help shed light into what analysis tasks we need to sup-port when building uncertainty-aware visual analytics tools and the evaluation tasks to use for more ecological validity. Indeed, exist-ing user-studies dealexist-ing with uncertainty visualization have largely dealt with simplified low-level detailed tasks, making it unclear how applicable the results of these studies are in the real-world [1, 2]. When high level tasks are used, their choice is seldom justified.
Our hypothesis is that uncertain data may require special types of analysis tasks and exploration strategies. To this end we designed a qualitative user study to identify the coping strategies and the tasks that domain experts engage in when they are confronted with uncer-tainty. In this work, we identified three key strategies and five main processes (high level tasks) common amongst our participants. We believe that further analysis of the collected data will result in a more detailed characterisation of uncertainty-aware data analytics and can yield a concrete set of design guidelines and open research questions relevant to the visual analytics research community.
2 STUDYDESIGN
We conducted semi-structured interviews and think-aloud demos with domain experts to identify their uncertainty coping strategies and the tasks they engage in when exploring uncertain data.
2.1 Participants
We interviewed 12 domain experts (9 female) aged 26–56 (mean 38) from 11 different organisations (entreprise and research). Par-ticipants were self identified as working with uncertainty. The an-alysts ranged from PhD students to experienced data scientists. In
∗e-mail: [email protected]
†e-mail: [email protected]
‡e-mail: [email protected]
§e-mail: [email protected]
this paper, we use the term “analyst” to refer to anyone whose pri-mary job function includes working with data to answer questions that inform business or research decisions.
2.2 Study Procedure and Task
Interviews were one-to-one and lasted from 45 minutes to 2 hours. We asked open-ended questions and encouraged interviewees to de-scribe their lived experiences. The interview had three parts: gen-eral, scenario and think-aloud demo, and prospectives (a wish list). Whenever possible, we asked participants to show us their tools and data sets. All interviews were video recorded.
2.3 Data Analysis
We collected 681 minutes of recordings in total, which were then transcribed by one author (92,151 words). To analyse this data, we followed a structured procedure based on grounded theory. Two authors independently open coded the transcripts, highlighting in-teresting snippets of text, or key ideas that were frequently men-tioned. We then crossed checked the selected excerpts before ex-tracting them into a data table. In total, we analysed 787 snippets using iterative coding and affinity diagramming.
3 INITIALFINDINGS
Our participants contributed their own definitions of what uncer-tainty means for their respective domains. These uncertainties gen-erally fall into one of four layers: data, model, interface, and cogni-tive. At the data layer, uncertainty pertains to the data set itself, such as uncertainty about particular values in the data or their provenance (e.g. errors; imprecise or inaccurate data; missing or unknown data; and vagueness, ambiguity, and fuzziness). At the model layer, un-certainty pertains more to the processing that was applied to the data, such as to fit them to a particular model (e.g. model accuracy and error). The interface layer deals with the software that acts as an interface between the data and the user, such as in a visualization (e.g. algorithmic errors and inconsistency between the system and interface). Finally, uncertainty at the cognitive level relates to how the user interprets and makes sense of the data (e.g. ambiguity in sense-making and inter-personal dynamics).
3.1 Strategies to Cope with Uncertainty
The analysis of our data revealed two categories of uncertainty cop-ing strategies: active and tacit. Most important are the active strate-gies where analysts deploy tools and techniques to understand,
min-imiseor exploit the underlying uncertainties. Although all
partic-ipants view uncertainty as an important aspect to consider during data analysis, they sometimes chose to ignore it. This happens when the category of uncertainty itself was not relevant to the anal-ysis or business needs, or because it was difficult to control. Tacit strategies reflect accepted domain practices with regards to uncer-tainty. They have an influence on the type of active strategy, if any, that analysts choose to use.
3.2 Processes and Tasks in Uncertain Data Analysis
Our analysis revealed five processes frequently used by our partici-pants: acquire, manipulate, reason, characterise and present. Key to data analysis are the manipulate, characterise and reason processes. We differentiate between these processes by the output they each
1AcquircharaReas Reaschara charaDataAnnot AnnotPreseAcquirReas
2AcquirReas ReasDataReas ReasAnnotReas
3AcquircharaData Data chara AnnotReas Reas Reas Reas Reas Reas ReasPrese
4AcquircharaReasDataReascharaData DatacharaReasData AnnotReas Reas Reas
5AcquirDataAcquirReas ReascharaReasAcquirAnnot Link ( charaReas
6Acquir AcquirData charaReasDatacharaReascharaReascharaReas ReascharaDataPrese
7Reas ReasAcquirReascharaAcquirData Data Data Datachara chara charaReasPrese PreseData
8AcquirDataReaschara charaReas
9AcquirData Data Data Data Reaschara chara charaReas ReasCharaDataReas
10AcquircharaData charaAcquirchara chara chara chara charaPrese PresecharaDataReas
11AcquirDatachara charaDataAcquirData
12AcquirReaschara charaDatachara charaReas Reas ReasAcquirDataPrese
Reasoning Present Present Present Present Reasoning Reasoning Present Reasoning Reasoning ACQUIRE DATA MANIPULATE DATA CHARACTERIZE UNCERTAINTY REASON PRESENT
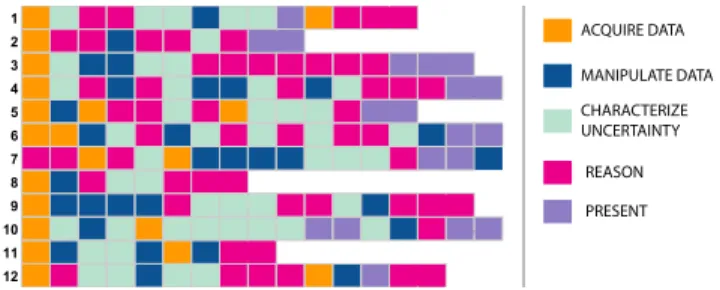
Figure 1: Participants’ analysis workflows using the five uncertainty processes: acquire, manipulate, characterise, reason and present.
ACQUIRE DATA PRESENT
CHARACTERIZE UNCERTAINTY Annotate | Compute | Model
MANIPULATE DATA
Data transformation Correction
REASON
Infer | Interpret | Hypothesis Compare | Validate
Figure 2: A flow-diagram describing the variety of ways analysts in-teract with uncertainty information during data analysis and
sense-making. Characterising uncertainty being a distinctive step to
uncertainty-aware data analysis and can happen at any stage. produce: manipulate generates data; characterise generates meta-data and reason generates thoughts. The characterise process is particular to uncertain data analysis.
Acquire Almost all participants start their process by acquiring data and half of them would repeat this process at least once dur-ing the analysis. The acquisition process comprises tasks involvdur-ing collecting, generating, enriching and storing data. The result of this process is often a database. Our participants acquired images, sen-sor data, log data, DNA sequencing tables, and documents.
Manipulate This process consists of applying computerised tools that transform data. We have observed four groups of data manipulations: transform by applying statistical operations (e.g. normalisation) and aggregation; correct often to clean data or cor-rect known biases; remove such as for filtering outliers; and
en-richthrough data fusion, extrapolation, duplication and estimation.
These operations can be manual or automatic. The output of this process is typically a transformed or a new database. All our par-ticipants manipulated data or models of it; and used one or more of the aforementioned data manipulation tasks.
Characterise Uncertainty This process involves any operation which tries to qualify or quantify uncertainty, thus generating infor-mation about uncertainty. All our participants engaged in this activ-ity. Characterisation tasks can be of three types, ordered from least informal to formal as follows: (a) Annotate uncertainty: here par-ticipants assigned notes to data, to describe their thoughts, doubts and their own or collaborative informal assessments of data quality. The output of this task are often text annotations and comments, stored as metadata fields in a database; (b) Compute uncertainty: often through statistical assessments of data quality (e.g. calcu-lating the mean and standard deviation), or by defining a quality threshold manually or through learning and clustering algorithms; and (c) Model uncertainty: A few participants engaged in this ac-tivity where they tried to build a model that takes uncertainty into account or model the uncertainty in itself. All these models had a confidence attribute to characterise predictions or estimations.
Reason Reasoning encapsulates all tasks that result in the gen-eration of thoughts, insight or decisions, as an individual or a col-laborative task. The outcome of this process is currently not stored
or exploitable in an automatic process. In this category, we include the following re-occurrent tasks: infer, interpret, make a hypothesis, cross check, compare, search, derive insight, conclude and validate with experts. All of our participants performed uncertainty-aware reasoning tasks during their analysis.
Present In the present process, participants produced artefacts such as written reports, presentations and plots for the purpose of exploration, communication and dissemination. All participants used this process, usually towards the end of their analysis work-flow. However, only a few participants used the present process to explore intermediate results.
3.3 Uncertainty-aware Data Analysis Workflows
To understand how the five processes of analysis under uncertainty relate to each other, we did the following steps: (a) we analysed video and transcript data from our study to produce 12 workflow diagrams that were then validated by our participants; (b) we open coded participants’ activities using our process labels. The results of this analysis are shown in Fig. 1. The visual analysis of these processes shows no common overall sequencing between partici-pants. However, what is shared, is that many participants started their analysis with data acquisition and finished with a presenta-tion of their findings. Data manipulapresenta-tion, is at the core of the anal-ysis, interleaved with reasoning and uncertainty characterisation. Similar to data acquisition and manipulation, but with a higher fre-quency is the uncertainty characterisation process. It appears that the majority of participants used this process extensively, often us-ing two or more characterisation operations in a row. Interestus-ingly, uncertainty characterisation is never at the end of the analysis. This is because for all of our participants, managing uncertainty was an aspect of analysis and not the goal. Reasoning also happens at var-ious places in the analysis. This is understandable, as participants form hypotheses that inform all other steps of data analysis.
We translated these findings into the process model in figure 2. The diagram illustrates our observation that the five data analysis processes can occur at anytime during the analysis. The links be-tween the process boxes indicate possible sequence paths.
3.4 Implications for Uncertainty-Aware Analytics
Based on our study findings, we discuss three design implications for uncertainty-aware analysis tools. First, our study showed that a great deal of uncertainty characterisation was manual. Experts used their knowledge to assess data quality, disambiguate objects and remove outliers in their data. There is need to create tools that capture and encode analysts’ annotations, and specifically with re-gards to uncertainty. Second, whereas tools to gain a basic under-standing of data quality and to minimise the uncertainty are widely accessible (e.g. by removing uncertain data or adding annotations), uncertainty exploitation tools are scarce (e.g. to make inferences). Therefore, we see more need for developing uncertainty exploita-tion tools. Third, in real life, analysts collaborate with other “data workers”, data providers, managers and other parties. Each of them has a different role to play along the analysis workflow. We en-vision collaborative uncertainty-aware data analysis tools that take into account sources of uncertainty in the data as well as in the model, interface, and cognitive and relational levels.
ACKNOWLEDGEMENTS
Thanks to the Chair Big Data & Market Insights at T´el´ecom ParisTech.
REFERENCES
[1] P. S. Quinan, L. M. Padilla, S. H. Creem-Regehr, and M. Meyer. To-wards Ecological Validity in Evaluating Uncertainty. In VIS Workshop Proc. on Visualization for Decision Making Under Uncertainty, 2015. [2] M. Skeels, B. Lee, G. Smith, and G. G. Robertson. Revealing
un-certainty for information visualization. Information Visualization,