HAL Id: hal-03111080
https://hal.archives-ouvertes.fr/hal-03111080
Submitted on 15 Jan 2021
HAL is a multi-disciplinary open access archive for the deposit and dissemination of sci-entific research documents, whether they are pub-lished or not. The documents may come from teaching and research institutions in France or abroad, or from public or private research centers.
L’archive ouverte pluridisciplinaire HAL, est destinée au dépôt et à la diffusion de documents scientifiques de niveau recherche, publiés ou non, émanant des établissements d’enseignement et de recherche français ou étrangers, des laboratoires publics ou privés.
Copyright
Measurements and Modeling of High-Pressure O 2 and
CO 2 Solubility in Brine (H 2 O + NaCl) between 303
and 373 K and Pressures up to 36 MPa
Salaheddine Chabab, Pezhman Ahmadi, Pascal Theveneau, Christophe
Coquelet, Antonin Chapoy, Jérôme Corvisier, Patrice Paricaud
To cite this version:
Salaheddine Chabab, Pezhman Ahmadi, Pascal Theveneau, Christophe Coquelet, Antonin Chapoy, et al.. Measurements and Modeling of High-Pressure O 2 and CO 2 Solubility in Brine (H 2 O + NaCl) between 303 and 373 K and Pressures up to 36 MPa. Journal of Chemical and Engineering Data, American Chemical Society, 2021, 66 (1), pp.609-620. �10.1021/acs.jced.0c00799�. �hal-03111080�
Measurements and modeling of high-pressure O
2and CO
2solubility in brine (H
2O+NaCl) between 303 and 373 K and
pressures up to 36 MPa
Salaheddine Chababa, Pezhman Ahmadib, Pascal Theveneaua, Christophe Coqueleta,*, Antonin Chapoyb,a, Jérôme Corvisierc and Patrice Paricaudd,a
aMines ParisTech, PSL University, Centre of Thermodynamics of Processes, 35 rue Saint Honoré, 77305
Fontainebleau Cedex, France
bHydrates, Flow Assurance & Phase Equilibria Research Group, Institute of GeoEnergy Engineering,
Heriot-Watt University, Edinburgh EH14 4AS, Scotland,UK
cMines ParisTech, PSL University, Centre de Géosciences, 35 rue Saint Honoré, 77305 Fontainebleau Cedex,
France
dUnité Chimie & Procédés (UCP), ENSTA Paris, 828 Boulevard des Maréchaux, 91762 Palaiseau cedex,
France
*Corresponding author. Tel: +33164694962, E-mail address: christophe.coquelet@mines-paristech.fr (C. Coquelet)
Abstract
Knowledge of the solubility of oxygen in natural water, which is generally saline, is important for several scientific and engineering fields. Applications such as geological storage of gas (containing O2, e.g. flue gas) or energy (Compressed Air Energy Storage) operate at high pressure.However, to date, there is no high-pressure O2 solubility data in brine, which has led researchers to develop models to predict this important property. To overcome the lack of data, solubility of O2 in brine has been measured using two different techniques, at molalities between 0.5 and 4 mol/kgw (NaCl), temperatures between 303 and 373 K and pressures up to 36 MPa. In order to validate the experimental methods, measurements of the solubility of CO2 in a highly concentrated brine (6 mol/kgw of NaCl) at temperatures between 303 and 373 K and pressures up to 39.5 MPa, were performed also in this work. These measurements allowed the evaluation of existing models such as the well-known Geng and Duan model, and the model recently developed by Zheng and Mao (ZM). The e-PR-CPA, Soreide-Whitson, and geochemical models used in our previous work were also used to process the new data. These last three models have been parameterized on measured and reported literature O2 solubility data, and new optimized parameters of the ZM model have been proposed. These models reproduce the effect of temperature, pressure and NaCl concentration on solubility with an average absolute deviation less than 5% from the measured data.
1. Introduction
Knowledge of the solubility of oxygen in natural water, which is generally saline, is important for several scientific and engineering fields such as hydrometallurgy 1, bioprocess engineering 2, oceanography and geochemistry 3, etc. Underground gas and energy storage is one of the geochemical applications that require the knowledge of the phase equilibrium of the O2 + water + salt mixture, since oxygen is generally always present in gas streams, whether as impurity as in the case of flue gases storage in the context of Carbon Capture and Storage (CCS), or in large quantities as in the case of Compressed Air Energy Storage (CAES).Due to its very high reactivity in the aqueous phase, oxygen can participate in geochemical reactions such as the oxidation of pyrite possibly present in the geological formation or can be used by micro-organisms leading to the contamination of the stored products 4.
The oxycombustion process uses oxygen as an oxidant instead of air for energy production while avoiding NOx emissions and facilitating the recovery of CO2 from the flue gases since they are mostly enriched by the latter. This technology needs large quantities of oxygen and requires the centralization of oxygen production and storage. In the framework of the ANR FLUIDSTORY project, an innovative concept (Electrolysis-Methanation-Oxycombustion (EMO) unit) 5 for energy storage concerns the supply of oxycombustion with oxygen from water electrolysis using renewable electricity, and with methane produced by methanation using hydrogen from electrolysis as well and CO2 recovered from oxycombustion flue gases. To manage the time laps between the production and use of these energy carriers (H2, O2, CH4, and CO2), the underground storage in salt caverns is suggested since it is considered to be the most suitable technique for large gas storage. The risks related to the reactivity of oxygen, which are discussed earlier, must be considered in the case of storage of oxygen (pure or mixed) in salt caverns. Accurate determination of oxygen solubility in the aqueous phase (residual brine in the caverns) under the thermodynamic conditions of storage (temperature, pressure, and salinity) is therefore necessary.
Several experimental studies exist for the solubility of O2 in pure and saline water. Existing data for these systems have been well reviewed by Battino 6, and recently by Geng and Duan 7 and Zheng and Mao 8. These reviews have shown that there is a lack of high pressure solubility data especially for O2 solubility in saline water which has only been studied at atmospheric pressure and low temperature (≤ 318 K). This lack of data has prompted researchers to develop models (Geng and Duan 7, Li et al. 9, Valderrama et al. 10, Zheng and
Mao 8) to estimate solubilities outside the range of available experimental data. Due to their unavailability to date, no data of O2 solubility in salt water at high pressure were included in the adjustment of these models, hence the need for high pressure solubility measurements of O2 in brine, and more specifically in NaCl brine since sodium and chloride are the main species present in natural saline water.
In this work, the solubility of O2 in H2O+NaCl with two different techniques was measured under geological storage conditions (temperature 303 ≤ T (K) ≤ 373, pressure up to 36 MPa and NaCl molality 0.5 ≤ mNaCl (mol/kgw) ≤ 4). CO2 solubility measurements at very high molality (6 mol/kgw of NaCl) were also performed to complete our previous work 11 and also to validate the measurement technique. The modeling of literature data and the measured solubilities of this study, was performed using several models (e-PR-CPA, Soreide and Whitson, and geochemical models) developed and presented in our recent work 11.In order to improve the accuracy of the model proposed by Zheng and Mao, the model parameters were readjusted on experimental data including the new measured data.
Figure 1 : Distribution of literature (×) and new measured (◊) solubility data. (a): CO2+H2O system (solubility and water content); (b): O2+H2O system (solubility and
water content); (c): CO2 solubility in NaCl brine; (d): O2 solubility in NaCl brine (m=mol/kgw).
0 10 20 30 40 50 60 70 270 320 370 420 470 520 570 P re s s u re / M P a Temperature /K data CO2 data H2O CO2-H2O a) 0 5 10 15 20 25 30 35 40 45 50 270 320 370 420 470 520 570 P re s s u re / M P a Temperature /K data O2 data H2O O2-H2O b) 0 10 20 30 40 50 60 70 270 320 370 420 470 520 570 P re s s u re / M P a Temperature /K < 1 m < 2 m < 3 m < 4 m < 5 m < 6 m > 6 m new < 6 m CO2-H2O-NaCl c) 0 5 10 15 20 25 30 35 40 270 320 370 420 470 520 570 P re s s u re / M P a Temperature /K < 1 m < 2 m < 3 m < 4 m < 5 m < 6 m > 6 m new < 1 m new < 2 m new < 4 m O2-H2O-NaCl d)
2. Experimental
2.1. Literature and measured solubility data of CO2 and O2 in water and brine
In the literature, several reviews of CO2 12-14 and O2 6-8 solubility data in water and brine are available. To list the literature data and those measured in this work, the distribution of these data sets are presentedin Figure 1 as a function of temperature, pressure and NaCl molality. As shown in this figure, data on the solubility of CO2 in H2O+NaCl (Figure 1.a and 1.c) and the solubility of O2 in H2O (Figure 1.b) are widely available. However, the measurements made in this work fill the lack of solubility data in brine at high pressure especially for O2 (Figure 1.d).
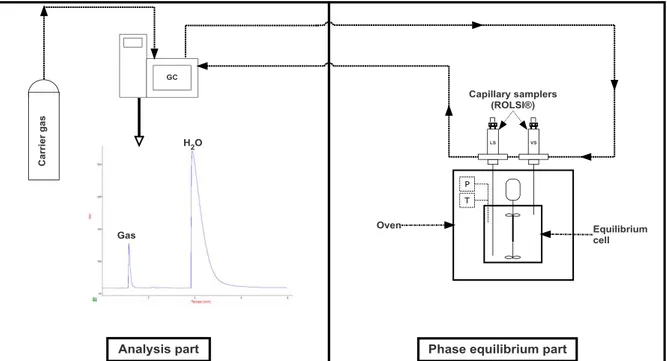
Figure 2 : Simplified schematic representation of the "static-analytic" apparatus for phase equilibria measurement.
Figure 3 : Simplified schematic representation of the "Rocking cell" apparatus for solubility measurement.
2.2. Materials
In Table 1, the suppliers of the chemicals (CO2, O2 and NaCl) and the given purities are listed. Carbon dioxide (CO2, CAS Number: 124-38-9) and oxygen (O2, CAS Number: 7782-44-7) were purchased from BOC with a certified volume purity greater than 99.995%. Sodium Chloride (NaCl, CAS Number: 7647-14-5) was purchased from Fisher Chemical with a
certified purity of 99.6%. Water (H2O, CAS Number: 7732-18-5) was deionized and degassed before the preparation of the brine (H2O + NaCl).
Table 1 : Chemical samples used for experimental work (CAS Registry Number, mole fraction purity and suppliers of chemicals).
Chemicals CAS Reg. No. Purity Analysis method Supplier
CO2 124-38-9 99.995 mol% GCa BOC
O2 7782-44-7 99.995 mol% GCa
BOC / Air Liquide
NaCl 7647-14-5 99.6% None Fisher
Chemical H2O (ultrapure) 7732-18-5 18.2 MΩ·cm
MilliporeTM ( direct-Q5)
a: Gas Chromatography
2.3. Apparatus and method
2.3.1. Static-analytic setup
The first setup used in this work is based on the static-analytic method and is described in detail in our recent work 11. However, in Figure 2, a simplified description of this technique is illustrated. It consists of an equilibrium cell positioned in an oven for temperature control, and equipped with pressure transducers, temperature probes and two ROLSI® (Rapid On-Line Sampler-Injector, French patent number 0304073) capillary samplers for each phase (liquid and vapor). After setting the temperature and charging the cell with the salt solution and the gas up to the desired pressure, the thermodynamic equilibrium is reached in some dozens of minutes after continuous agitation, assuming that the equilibrium is verified by the stabilization of the temperature and pressure in the cell.Several samples are then taken by the liquid ROLSI® and sent through a transfer line to GC (Gas Chromatography) to determine the mole fraction of gas and water.
2.3.2. Rocking cell setup (volumetric technique)
The rocking cell setup illustrated in Figure 3 is based on a volumetric technique. It is the same as that presented by Chapoy et al. 15 and recently used by Ahmadi and Chapoy 14.It consists of a rocking equilibrium cell with a volume of 350 cm3 mounted on an adjustable rotary axis of the pneumatic rocking systemand surrounded by a heating jacket connected to a thermostat bath to maintain a constant temperature. The cell is equipped with a Quartzdyne pressure
transducer and a platinum resistance thermometer placed in the heating jacket of the cell. Since the temperature probe is not placed inside the cell, the real temperature in the cell is determined by calibration with respect to the jacket temperature.
For each measured point, the following procedure was followed: setting the target temperature, introducing 300 cm3 of the saline solution and evacuating the equilibrium cellto remove the air. Then, the gas is introduced until the desired pressure is reached. The gas injection line is disconnected to allow the shaking of the system by the rocking system. Once the pressure and temperature are stabilized,the rocking is stopped and the cell is locked in a vertical position to take a sample of the aqueous phase. The gas injection line is reconnected to the cell, the flash tank is connected to the bottom of the cell to collect the sample, and the gasometer (VINCI TECHNOLOGIES) is connected to the flash tank. During sampling, the gas is injected continuously to maintain a constant pressure. The gas is separated from the liquid at the flash tank and transferred to the gasometer. The volume difference at constant pressure and temperature is then determined using the gasometer and knowing the density of the pure gas, the mass of the gas is deduced. The mass of the brine is determined gravimetrically using a balance. Finally, by knowing the quantities of gas and brine in the sample, the solubility of the gas is obtained. The calculation procedure is described in detail by Ahmadi and Chapoy 14.More gas is added to increase the pressure, and the procedure is repeated to measure another equilibrium point.
3. Thermodynamic modeling
The models used in this work are fully programmed and parameterized, and are described in detail in our recent work 11. Their main equations are presented in Appendix A. These models are based on two thermodynamic approaches:
Asymmetric (gamma-phi) approach:
Being simple and fast, the gamma-phi approach is the most used approach by geochemists for correlating gas solubility data in water and brine. This approach consists of using an equation of state for the gas phase and an activity coefficient model for the liquid phase. Among the best known works are those of Duan et al. 16, 17 and Spycher et al. 18, 19 on the solubility of CO2 in water/brine, and those of Geng and Duan 7 and Valderrama et al. 10 on the solubility of O2 in water/brine.
The geochemical model implemented in CHESS/HYTEC software (Corvisier, 2013 20; Corvisier et al., 2013 21) was used, as well as the model proposed by Zheng and Mao 8 reparameterized by including the new measured data from this work.
Symmetric (phi-phi) approach:
Unlike the asymmetric approach, the symmetric approach consists in representing all the fluid phases (liquid and vapor) of the system with a single equation of state. Using this approach, two types of equations of state (cubic and non-cubic) were used.
The first EoS is the Soreide-Whitson model 22 (revision of the PR model) which is widely used in reservoir engineering (mixture of gas, oil, water, salts, etc.), and is implemented in several modeling and simulation software (Eclipse 300 - Schlumberger, IPM - Petex, Simulis Thermodynamics – Prosim France, etc.).
The second EoS used is the e-PR-CPA (electrolyte Peng-Robinson Cubic Plus Association) model that was presented in our previous work 11. With this model, all molecular and electrolyte interactions are taken into account. In the e-PR-CPA model, the PR cubic EoS has been selected to represent attractive and dispersive interactions, and the Wertheim’s theory (used in SAFT and CPA type EoS) has been considered to account for the association phenomenon. Concerning electrolyte interactions, the long-range interactions (between ions) are taken into account by the MSA (Mean Spherical Approximation) theory, and the phenomenon of solvation of the ions by the solvent (water) is considered by the Born term.
4. Results and discussions 4.1. Experimental results
In this section, measurements concerning the high-pressure solubility of CO2 and O2 in H2O + NaCl are presented. The standard uncertainties u (T), u (P) and u (x) of the measurements performed by the static-analytic setup were calculated by the NIST method 23. The calibration (the polynomial correlation) uncertainty and repeatability uncertainty are the two sources of uncertainties involved in the calculation of u (T) and u (P). The third source of uncertainty was associated with the injection of the pure compound by the syringe during GC calibration, u (x).For the measurements carried out with the Rocking Cell apparatus, the uncertainties for temperature, pressure and composition were calculated in the same way as that of Ahmadi and Chapoy 14, since the same installation and the same calibrations were used. The standard
uncertainties for temperature and pressure are 0.02 K and 0.005 MPa respectively for the static-analytic setup and 0.17 K and 0.068 MPa respectively for the rocking cell setup. The standard uncertainties related to the measurement of the composition u ( ) and u ( ) are listed with the results in Tables 2 and 3. The gas solubility is expressed as "salt-free" mole fractions: , is the gas molality (in mol/kgw), and
is the molecular weight of water (in g/mol) .
4.1.1. CO2 solubility in H2O + NaCl
The experimental measurements of the CO2+H2O+NaCl system were performed by the rocking cell setup at molality of 6 mol NaCl/kgw, temperatures between 303 and 373 K and pressures up to 39.5 MPa and are listed in Table 2. These measurements were used to validate the experimental setup by comparing some obtained results with literature data from Messabeb et al. 13 and Zhao et al. 24 (Figure 4), and also to complement the existing data for this system, especially at high pressure.
Figure 4 : CO2+H2O+NaCl system : Experimental CO2 solubility in 6 mNaCl (mol/kgw) NaCl-brine at 323 K and
373 K. The black symbols are the literature data 13, 24, and the red symbols with dotted lines (to guide the eye) are the measured data.
0 0.002 0.004 0.006 0.008 0.01 0.012 0 5 10 15 20 25 30 35 40 45 x CO 2 (m o le fra ct io n ) Pressure (MPa)
This work (303.55K - 6mNaCl) Literature data (323.15 - 6mNaCl) This work (323.1K - 6mNaCl) Literature data (373.15 - 6mNaCl) This work (373.4K - 6mNaCl)
Table 2 : Measured solubility of CO2 in the H2O + NaCl at 6 NaCl by the rocking cell setup, expressed
as "salt-free" mole fractions and their standard uncertainties .
, and .
4.1.2. O2 solubility in H2O + NaCl
The solubility of O2 in H2O+NaCl was measured with both apparatus (technique 1: static-analytic, technique 2: rocking cell (volumetric)). The experimental results obtained at molalities between 0.5 and 4 mol/kgw, temperatures between 303 and 373 K and pressures up to 36 MPa, are listed in Table 3. For validation purpose, some measurements were made with both techniques under the same experimental conditions (T, P, mNaCl). As shown in Figure 5, the two datasets are consistent and follow similar trends, which validates both measurement techniques (including equipment and calibration).
Equilibrium T (K) P (MPa) Vapor-Liquid (VLE) 303.55 3.6721 0.00572 0.00010 VLE 303.55 7.1333 0.00890 0.00008 Liquid-Liquid (LLE) 303.55 15.1857 0.00936 0.00010 LLE 303.55 24.6777 0.01012 0.00010 LLE 303.55 36.0196 0.01077 0.00010 VLE 323.10 3.5818 0.00418 0.00010 VLE 323.10 8.9744 0.00760 0.00007 VLE 323.10 14.3618 0.00866 0.00009 VLE 323.10 24.5798 0.00939 0.00010 VLE 323.10 39.4477 0.01046 0.00010 VLE 373.29 4.676 0.00333 0.00010 VLE 373.39 12.0603 0.00654 0.00006 VLE 373.39 20.5905 0.00846 0.00008 VLE 373.39 35.0185 0.00978 0.00010
Figure 5 : O2+H2O+NaCl system : Validation of measured O2 solubility data in 1m and 4m (m=mol/kgw)
NaCl-brine at 323 K. The blue and red symbols represent data measured by the Technique 1 and 2 respectively. The solid lines represent a trend line to guide the eye.
Table 3 : Measured solubility of O2 in the H2O + NaCl, expressed as "salt-free" mole fractions and their
standard uncertainties . , for Technique 1: and
; For Technique 2: and .
Technique mNaCl (mol ) T (K) P (MPa)
T ec h n iq u e 1: st at ic -an alytic 0.5 324.00 4.3540 0.00064 0.000020 323.95 9.9310 0.00140 0.000100 323.94 13.6330 0.00180 0.000100 323.93 17.0180 0.00210 0.000100 323.93 20.0710 0.00240 0.000100 1 323.16 3.1210 0.00038 0.000010 323.17 7.3479 0.00085 0.000020 323.14 4.8790 0.00059 0.000010 323.14 11.2857 0.00125 0.000040 323.17 15.2399 0.00160 0.000050 4 323.18 3.0720 0.00018 0.000010 323.16 7.2104 0.00042 0.000010 323.13 15.0404 0.00080 0.000030 323.16 19.6893 0.00098 0.000030 1* 372.92 3.0516 0.00029 0.000010 0.0000 0.0005 0.0010 0.0015 0.0020 0.0025 0.0030 0.0035 0 5 10 15 20 25 30 35 40 x O 2 / m o l f ra ct io n Pressure / MPa 323 K 1 m 4 m Technique 1 Technique 2
373.11 7.2294 0.00070 0.000010 373.07 11.1250 0.00106 0.000020 373.10 15.1719 0.00139 0.000020 373.09 20.2617 0.00175 0.000040 2 333.30 3.1964 0.00029 0.000010 333.53 6.6156 0.00057 0.000010 333.53 10.2178 0.00083 0.000060 333.52 15.2950 0.00118 0.000040 333.53 20.2640 0.00146 0.000080 T ec h n iq u e 2: r oc k in g c ell ( volu m etr ic ) 1 303.74 10.4249 0.00141 0.000050 303.74 16.8653 0.00206 0.000053 303.55 25.9464 0.00290 0.000055 303.55 35.4577 0.00350 0.000058 1 323.20 11.8555 0.00131 0.000050 323.20 20.5567 0.00201 0.000054 323.20 27.9341 0.00256 0.000055 323.20 35.6287 0.00304 0.000056 1 373.10 29.1304 0.00245 0.000054 373.10 21.5461 0.00197 0.000054 373.19 12.3554 0.00129 0.000053 373.19 35.5839 0.00286 0.000055 4 303.26 13.5379 0.00078 0.000050 303.26 20.8808 0.00112 0.000053 303.26 27.9272 0.00134 0.000053 303.64 32.3123 0.00153 0.000054 4 323.10 13.8274 0.00075 0.000050 323.01 21.0325 0.00102 0.000053 323.01 28.4305 0.00125 0.000054 323.01 36.0630 0.00150 0.000054
* Initial NaCl molality must have increased due to experimental error (see explanation in
Section 4.2.).
4.2. Modeling results
4.2.1. CO2 + H2O + NaCl system
The solubility of CO2 in the CO2 + H2O + NaCl system was modeled by the Soreide and Whitson models (SW, with improved binary interaction parameters, see Chabab et al. 11) and the e-PR-CPA model using the phi-phi approach, as well as the geochemical model using the gamma-phi approach.For the e-PR-CPA model the solvation of CO2 by water molecules was
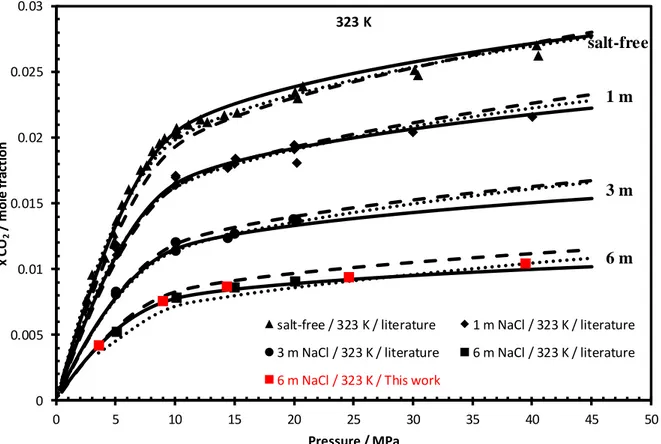
considered by attributing to CO2 a single electron acceptor association site and to H2O four association sites (2 electron donor sites and 2 electron acceptor sites). The predictions were compared with data from the literature and those measured in this work. This was done under geological storage conditions, either in saline aquifers (low or medium salinity) or in salt caverns (saturated brine). An example of modeling results at different salinities (in terms of molality), ranging from pure water to saline water with very high salt concentration (close to saturation ~ 6 mol/kgw NaCl), is shown in figure 6. The model predictions are in good agreement with the literature and measured solubility data. Calculations of CO2 solubility in water and NaCl brine generated by the e-PR-CPA model over a wide range of temperature, pressure and molality are listed in Table S1 in Supporting Information.
Figure 6 : CO2+H2O+NaCl system : Prediction of CO2 solubility at different NaCl molality m (mol/kgw) by
e-PR-CPA (solid line), SW (dashed line) and geochemical (dotted line) models. The black symbols are the literature data 13, 14, 25-31, and the red symbols are the measured data (Table 2).
4.2.2. O2 + H2O + NaCl system
In order to check more or less the consistency of the measured solubilities of O2 in water + NaCl, we verified the linearity of the experimental data in terms of Ln(P/xO2) as a function of P, following the Krichevsky-Kasarnovsky 32 approach. This linearity condition can be easily demonstrated from the gamma-phi approach, by considering the fugacity coefficient of the
0 0.005 0.01 0.015 0.02 0.025 0.03 0 5 10 15 20 25 30 35 40 45 50 x CO 2 / m o le fra ct io n Pressure / MPa
salt-free / 323 K / literature 1 m NaCl / 323 K / literature 3 m NaCl / 323 K / literature 6 m NaCl / 323 K / literature
6 m NaCl / 323 K / This work
323 K
1 m
3 m
6 m salt-free
gas (Li et al. 9) or by neglecting it (assuming that the vapor phase is ideal, see Descamps et al. 33
).
Figure 7 : Solubility of O2 in H2O + NaCl at different NaCl molality m (mol/kgw). The black symbols are the
literature data 34, the red symbols are the measured data (Table 3), and the solid lines are the prediction by e-PR-CPA model.
In Figure 7, the linearity of the experimental data was checked and compared with the predictions of the e-PR-CPA model. All measurements appear to be consistent and linear except for the isotherm at 373 K (1 mol/kgw NaCl). This inconsistency with respect to this isotherm can be explained by the fact that the points were not measured at the same molality, since we used two different techniques. The deviations concern only the measurements made with the technique 1 at 373 K (1 mol/kgw), assuming that the initial molality has increased, since by mistake, after filling the cell with the prepared brine solution (at 1 mol/kgw), we evacuated it at high temperature (373 K). This allowed the water to evaporate more and increase the molality.
7 7.5 8 8.5 9 9.5 10 10.5 0 5 10 15 20 25 30 35 40 Ln ( P/ xO 2 ) Pressure / MPa
Exp Data (323 K, 4m NaCl) Exp Data (333 K, 2m NaCl) Exp Data (323 K, 1m NaCl) Exp Data (373 K, 1m NaCl) Exp Data (323 K, 0.5m NaCl) Literature (323 K, pure water)
Figure 8 : O2+H2O+NaCl system : Prediction of O2 solubility at different NaCl molality m (mol/kgw) by e-PR-CPA (solid line), SW (dashed line) and geochemical (dotted
line) models. The black symbols are the literature data ((a) : 34, (b) : 35), and the red symbols are the measured data (Table 3).
0 0.001 0.002 0.003 0.004 0.005 0.006 0 5 10 15 20 25 30 35 40 45 50 xO 2 / m o l f ra ct io n Pressure / MPa
This work (e-PR-CPA model) This work (SW model) This work (geoch. model) Literature data (O2 in pure water)
T = 323 K
0.5 m 1 m
4 m
Redsymbols: This work (measurements at 50 C)
salt-free (a) 0 0.001 0.002 0.003 0.004 0.005 0.006 0 5 10 15 20 25 30 35 40 45 50 xO 2 / m o l f ra ct io n Pressure / MPa
This work (e-PR-CPA model)
This work (SW model)
Literature data (O2 in pure water)
T = 303 K
Redsymbols: This work (measurements at 30 C) 1 m
4 m salt-free
Figure 9 : Comparison of O2 and CH4 solubilities in pure water (a) and NaCl brine (water+NaCl; b: 1m; c: 4m; d: 0-4m; m=mol/kgw) at 323 K. The symbols represent the
experimental data (O2 in water: 34; O2 in brine: from this work (Table 3); CH4 in water and brine: 36) and the solid lines represent the predictions by the e-PR-CPA model.
0 0.0005 0.001 0.0015 0.002 0.0025 0.003 0.0035 0.004 0.0045 0.005 0 10 20 30 40 50 x / m o l f ra ct io n Pressure / MPa
Solubility in pure water
O2 CH4 0 0.0005 0.001 0.0015 0.002 0.0025 0.003 0.0035 0.004 0 10 20 30 40 50 x / m o l f ra ct io n Pressure / MPa Solubility in 1m NaCl O2 CH4 0 0.0002 0.0004 0.0006 0.0008 0.001 0.0012 0.0014 0.0016 0.0018 0 10 20 30 40 50 x / m o l f ra ct io n Pressure / MPa Solubility in 4m NaCl O2 CH4 0 0.0005 0.001 0.0015 0.002 0.0025 0.003 0.0035 0.004 0.0045 0.005 0 10 20 30 40 50 x / m o l f ra ct io n Pressure / MPa
O2 solubility (e-PR-CPA model) CH4 solubility (e-PR-CPA model)
(a) (b)
The solubility of O2 in H2O + NaCl was also modeled by the three models.The binary interaction parameters of the different models were fitted to the literature and measured data. For the e-PR-CPA model (See Appendix A2), the cross-association (solvation) between O2 molecules and H2O molecules was not considered (no Lewis Acid-Lewis Base interaction), since O2 is not considered as an associative species. Therefore, only the binary interaction parameters were adjusted.As in our previous work 11, we considered temperature dependence in and salt molality dependence in .
(1)
(2)
(3)
The “asymmetric” binary interaction parameters (one for each phase) of the Soreide and Whitson (SW) model (See Appendix A1) depend on temperature (in K) and salt molality. In the original paper of the SW model 22, there is no expression of these parameters for O2. We propose the following expression (the same is used for N2 in the original paper) whose coefficients (Table 4) have been fitted to solubility and water content data:
(4) (5)
Table 4 : Coefficients of the binary interaction parameter
of the SW model (Equation 4)
The geochemical model (See Appendix A3), based on a dissymmetrical approach, solves a large set of mass balances and mass action laws to calculate the whole system speciation (i.e. aqueous, gaseous and solid quantities and activities/fugacities). Equations shall remain generic, in order that the model handles multi-components either for the gas phase and the electrolyte. For the gas phase, the PR-SW EoS is used with the classical mixing rule. For the aqueous solution and particularly for
saline solutions with high ionic strength, activity coefficients can be calculated using Specific Ion Theory (SIT) showing satisfactory results.
It requires a thermodynamic database and simulations presented here are run along with the Thermo em t b se i clu i g He ry’s co st ts p r meters for PR-SW EoS (Blanc et al. 2012 37), and parameters for molar volume of the dissolved gaseous component at infinite dilution (Shock et al. 1989 38; Schulte et al. 2001 39). Gas binary interaction parameters for PR-SW and aqueous binary interactions parameters for SIT have been fitted on experimental data.
and are equal to 0.193 and 0.591 respectively.
and are equal to -0.097 and -0.035 using HCl and NaCl solutions activity measurements (Schneider et al., 2004 40; Sakaida and Kakiuchi, 2011 41; Khoshkbarchi and Vera, 1996 42).
varies with temperature (from 0.085 at 298 K to 0.077 at 473 K) and as well (from 0.124 at 298 K to 0.107 at 473 K) using numerous CO2 and O2 solubility measurements in NaCl solutions.
As shown in Figure 8, comparing with measured and literature 34, 35 data, the models capture qualitatively (salting-out effect) and quantitatively very well the effect of NaCl on solubility over a wide range of pressure and molality. The e-PR-CPA, SW, and geochemical models respectively reproduce the O2 solubility with an average absolute deviation of 2.8%, 2.9%, and 4.3% from the measured data. It should be noted that the geochemical model has been fitted to all literature and measured data, and most of these data are at low pressure and temperature, therefore it is more accurate at low pressure. The e-PR-CPA and SW models have been adjusted on high pressure data (≥1 MPa), hence they estimate the solubility at high pressure more precisely.The calculated values for solubility of O2 in water and NaCl brine estimated using the e-PR-CPA model over a wide range of temperature, pressure and molality are listed in Table S2 (in Supporting Information). In Figure 9, the solubility of O2 in pure water and NaCl brine was compared with that of CH4 under the same conditions of temperature (323 K) and NaCl molality (0, 1 and 4 mol/kg of water).The e-PR-CPA model also predicts well the solubility of CH4 in pure water and brine an average absolute deviation of 1.9% and BIAS of 0.8%. The binary interaction coefficients for CH4–H2O are provided in Equations 6-8.In Figure 9, it is observed that the solubility in pure water and brine of O2 becomes more important than that of CH4 at high pressure, which is not the case at lower pressures (<5 MPa). Moreover, the binary gas/water interaction parameters are more important for O2 (between 0.24 and 0.48 for temperatures between 298 and 373 K) than CH4 (between 0.11 and 0.29 for
temperatures between 298 and 373 K). This can perhaps be explained by the difference in polarizability between the molecules of O2 (1.6 Å3) and CH4 (2.6 Å3) 43: O2 is less polarizable, so the attractive water-gas interactions are less strong for O2 than for CH4.
(6)
(7)
(8)
The difference in solubility of CH4 and O2 can be explained by their size. The critical volume of methane (98.62 cm3/mol 44) is larger than that of oxygen (73.36 cm3/mol 44), which is related to the size of the molecule. Therefore, methane requires more energy than oxygen to form a cavity in the aqueous phase. The same remark was given by Battino and Seybold 45 to explain the mystery of the solubilities of O2 and N2 in water.
The interaction parameters and of the Zheng and Mao (ZM) 8 model have been readjusted by including the new measured data. In Table 5, the old and new parameters are listed, and the comparison of the O2 solubility predictions using the two sets of parameters is shown in Figure 10. With the new parameters, the solubility calculation by the ZM model has been improved by reproducing the new measured data with an absolute average deviation of 4% instead of 11% (with the original parameters).
Figure 10 : O2+H2O+NaCl system : Calculation of O2 solubility at different NaCl molality m (mol/kgw) by the Zheng
and Mao (ZM) model using original (dotted line) and reoptimized (dashed line) parameters (Table 5). The black symbols are the literature data 34, and the red symbols are the measured data (Table 3).
Table 5 : Zheng and Mao model interaction parameters for the O2 solubility in NaCl brine
ZM model parameters AAD (%) a
Original 8 11.23
Reoptimized (this work) 3.97 a AAD %: average absolute deviation (from the data measured in this work),
In Figure 11, one of the isotherms measured in this work was compared with the predictions of the well-known Geng and Duan 7 model. The predictions are somewhat acceptable(underestimation of the O2 solubility in brine), but can be improved by readjusting the model parameters by including the new data.
0 0.001 0.002 0.003 0.004 0.005 0.006 0 5 10 15 20 25 30 35 40 45 50 xO 2 / m o l f ra ct io n Pressure / MPa ZM model (Original parameters)
ZM model (Reoptimized parameters) Literature data (O2 in pure water)
T = 323 K
0.5 m 1 m
4 m
Redsymbols: This work (measurements)
Figure 11 : Geng and Duan 7 model predictions of O2 solubility compared with data measured at 333 K (2 mol/kgw).
The water content in the O2-rich gas phase (O2+H2O system) was also studied. In Figure 12, the water content predictions with the e-PR-CPA, SW, and geochemical models are compared with data from the literature. All three models estimate water content very well, with a slight advantage of models with asymmetric parameters (SW and geochemical), since the gas and liquid phases are not represented by the same parameters (SW) or not by the same method (geochemical model: activity coefficient for the liquid phase and fugacity coefficient for the gas phase).However, the symmetric approach with a consistent model is preferable for reservoir simulation, since it is indispensable to perform stability analysis before each phase equilibrium calculation, especially for multi-component and multiphase systems, and this can only be achieved by consistent equations of state.
0.0000 0.0005 0.0010 0.0015 0.0020 0.0025 0 5 10 15 20 25 30 35 40 45 xO 2 / m o l f ra ct io n Pressure / MPa
This work (333 K / 2m NaCl) Geng and Duan model
Figure 12 : Prediction of the water content in O2 as a function of pressure at different temperatures by e-PR-CPA
(solid line), SW (dashed line) and geochemical (dotted line) models. The data (symbols) are from Wylie and Fisher 46.
0 0.002 0.004 0.006 0.008 0.01 0.012 0.014 0 2 4 6 8 10 12 14 16 w at e r co n te n t in O2 / m o l f ra ct io n Pressure / MPa T = 348 K T = 323 K T = 298 K
Conclusions
The solubility of O2 in NaCl brine was measured using two different techniques:the first one is based on the static-analytic method (liquid phase sampling and GC analysis) and the second one is a rocking cell setup (liquid phase sampling, gas/brine separation, gravimetric and volumetric analysis of brine and gas). For validation purpose, the measurements carried out using both techniques were compared, and consistency of results was verified. The solubility of CO2 in NaCl brine (at high concentration) was also measured using the second technique. These measurements are intended to complement our previous work (on CO2 solubility in brine), and also to validate the measurement technique by comparing some measurements with literature data.
The new measured solubility data were used to evaluate and improve existing or developed models. The e-PR-CPA and SW equations of state (phi-phi approach) were tested, and a geochemical model and the recently proposed model by Zheng and Mao (ZM) (gamma-phi approach) were used to process measured and literature O2 solubility data. The measurements carried out also show the need to readjust the well-known Geng and Duan model by including these new data. The predictions of the water content in the gas phase (O2-rich) by the three models (e-PR-CPA, SW, and geochemical) were evaluated by comparing them with literature data. All three models gave similar results.For CO2, the solubility data were processed by the three models as well, whose parameterization was already done in our previous work.
All models capture very well the effect of temperature, pressure, and NaCl concentration on the solubility of O2 and CO2 with an absolute average deviation less than 5% with respect to the measured data. Each of these models can be used for solubility estimation, criteria such as accuracy, simplicity and speed of calculation can be considered in selecting the appropriate model and approach.Finally, we provided in Supporting Information tables of solubility data of O2 and CO2 in water and NaCl brine, generated by the e-PR-CPA model.
Supporting Information (SI)
Appendix A and tables of solubility data of O2 and CO2 in water and NaCl brine in a wide range of pressure and temperature.
Acknowledgement
Financial support from Agence Nationale de la Recherche (ANR) through the project FluidSTORY (n° 7747, ID ANR-15-CE06-0015) is gratefully acknowledged.
References
1. Tromans, D., Oxygen solubility modeling in inorganic solutions: concentration, temperature and pressure effects. Hydrometallurgy 1998, 50, 279-296.
2. Jamnongwong, M.; Loubiere, K.; Dietrich, N.; Hébrard, G., Experimental study of oxygen diffusion coefficients in clean water containing salt, glucose or surfactant: consequences on the liquid-side mass transfer coefficients. Chem. Eng. J. 2010, 165, 758-768. 3. Ming, G.; Zhenhao, D., Prediction of oxygen solubility in pure water and brines up to high temperatures and pressures. Geochim. Cosmochim. Acta 2010, 74, 5631-5640.
4. Roffey, R., Microbial problems during long-term storage of petroleum products underground in rock caverns. Int. Biodeterior. 1989, 25, 219-236.
5. Kezibri, N.; Bouallou, C., Conceptual design and modelling of an industrial scale power to gas-oxy-combustion power plant. Int. J. Hydrogen Energy 2017, 42, 19411-19419. 6. Battino, R., IUPAC solubility data series. Oxygen and ozone 1981, 7.
7. Geng, M.; Duan, Z., Prediction of oxygen solubility in pure water and brines up to high temperatures and pressures. Geochim. Cosmochim. Acta 2010, 74, 5631-5640.
8. Zheng, J.; Mao, S., A thermodynamic model for the solubility of N2, O2 and Ar in pure water and aqueous electrolyte solutions and its applications. Appl. Geochem. 2019, 107, 58-79.
9. Li, D.; Beyer, C.; Bauer, S. In Solubility of Nitrogen and Oxygen Gas in Aqueous
NaCl Solutions for Elevated Temperatures and Pressures, The Third Sustainable Earth
Sciences Conference and Exhibition, 2015; European Association of Geoscientists & Engineers: 2015; pp 1-5.
10. Valderrama, J. O.; Campusano, R. A.; Forero, L. A., A new generalized Henry-Setschenow equation for predicting the solubility of air gases (oxygen, nitrogen and argon) in seawater and saline solutions. J. Mol. Liq. 2016, 222, 1218-1227.
11. Chabab, S.; Théveneau, P.; Corvisier, J.; Coquelet, C.; Paricaud, P.; Houriez, C.; El Ahmar, E., Thermodynamic study of the CO2–H2O–NaCl system: Measurements of CO2 solubility and modeling of phase equilibria using Soreide and Whitson, electrolyte CPA and SIT models. Int. J. Greenhouse Gas Control 2019, 91, 102825.
12. Mao, S.; Zhang, D.; Li, Y.; Liu, N., An improved model for calculating CO2 solubility in aqueous NaCl solutions and the application to CO2–H2O–NaCl fluid inclusions. Chem.
Geol. 2013, 347, 43-58.
13. Mess beb H. o t mi e . o. c, P.; Serin, J. P.; Gaucher, E. C., Experimental Measurement of CO2 Solubility in Aqueous NaCl Solution at Temperature from 323.15 to 423.15 K and Pressure of up to 20 MPa. J. Chem. Eng. Data 2016, 61, 3573-3584.
14. Ahmadi, P.; Chapoy, A., CO2 solubility in formation water under sequestration conditions. Fluid Phase Equilib. 2018, 463, 80-90.
15. Chapoy, A.; Nazeri, M.; Kapateh, M.; Burgass, R.; Coquelet, C.; Tohidi, B., Effect of impurities on thermophysical properties and phase behaviour of a CO2-rich system in CCS.
Int. J. Greenhouse Gas Control 2013, 19, 92-100.
16. Duan, Z.; Sun, R., An improved model calculating CO2 solubility in pure water and aqueous NaCl solutions from 273 to 533 K and from 0 to 2000 bar. Chem. Geol. 2003, 193, 257-271.
17. Duan, Z.; Sun, R.; Zhu, C.; Chou, I.-M., An improved model for the calculation of O2 solubility i queous solutio s co t i i g N + K+ 2+ Mg2+ l− SO42−. Mar.
Chem. 2006, 98, 131-139.
18. Spycher, N.; Pruess, K.; Ennis-King, J., CO2-H2O mixtures in the geological sequestration of CO2. I. Assessment and calculation of mutual solubilities from 12 to 100 C and up to 600 bar. Geochim. Cosmochim. Acta 2003, 67, 3015-3031.
19. Spycher, N.; Pruess, K., CO2-H2O Mixtures in the Geological Sequestration of CO2. II. Partitioning in Chloride Brines at 12–100 C and up to 600 bar. Geochim. Cosmochim. Acta
2005, 69, 3309-3320.
20. Corvisier, J. In Modeling water-gas-rock interactions using CHESS/HYTEC, Goldschmidt Conference, Florence–Italy, 2013; 2013.
21. Corvisier, J.; Bonvalot, A.-F.; Lagneau, V.; Chiquet, P.; Renard, S.; Sterpenich, J.; Pironon, J., Impact of co-injected gases on CO2 storage sites: Geochemical modeling of experimental results. Energy Procedia 2013, 37, 3699-3710.
22. Søreide, I.; Whitson, C. H., Peng-Robinson predictions for hydrocarbons, CO2, N2, and H2S with pure water and NaCl brine. Fluid Phase Equilib. 1992, 77, 217-240.
23. Taylor, B. N.; Kuyatt, C. E. NIST Technical Note 1297: guidelines for evaluating and
expressing the uncertainty of NIST measurement results; Gaithersburg, MD, 1994.
24. Zhao, H.; Fedkin, M. V.; Dilmore, R. M.; Lvov, S. N., Carbon dioxide solubility in aqueous solutions of sodium chloride at geological conditions: Experimental results at 323.15, 373.15, and 423.15 K and 150bar and modeling up to 573.15 K and 2000bar. Geochim.
Cosmochim. Acta 2015, 149, 165-189.
25. Guo, H.; Huang, Y.; Chen, Y.; Zhou, Q., Quantitative Raman Spectroscopic Measurements of CO2 Solubility in NaCl Solution from (273.15 to 473.15) K at p=(10.0, 20.0, 30.0, and 40.0) MPa. J. Chem. Eng. Data 2015, 61, 466-474.
26. Koschel, D.; Coxam, J.-Y.; Rodier, L.; Majer, V., Enthalpy and solubility data of CO 2 in water and NaCl (aq) at conditions of interest for geological sequestration. Fluid Phase
Equilib. 2006, 247, 107-120.
27. Yan, W.; Huang, S.; Stenby, E. H., Measurement and modeling of CO2 solubility in NaCl brine and CO2–saturated NaCl brine density. Int. J. Greenhouse Gas Control 2011, 5, 1460-1477.
28. Bamberger, A.; Sieder, G.; Maurer, G., High-pressure (vapor+ liquid) equilibrium in binary mixtures of (carbon dioxide+ water or acetic acid) at temperatures from 313 to 353 K.
J. Supercrit. Fluids 2000, 17, 97-110.
29. Hou, S.-X.; Maitland, G. C.; Trusler, J. M., Measurement and modeling of the phase behavior of the (carbon dioxide+ water) mixture at temperatures from 298.15 K to 448.15 K.
J. Supercrit. Fluids 2013, 73, 87-96.
30. Dohrn, R.; Bünz, A.; Devlieghere, F.; Thelen, D., Experimental measurements of phase equilibria for ternary and quaternary systems of glucose, water, CO2 and ethanol with a novel apparatus. Fluid Phase Equilib. 1993, 83, 149-158.
31. Wiebe, R.; Gaddy, V., The solubility in water of carbon dioxide at 50, 75 and 100, at pressures to 700 atmospheres. J. Am. Chem. Soc. 1939, 61, 315-318.
32. Krichevsky, I.; Kasarnovsky, J., Partial Molal Quantities in an Infinitely Dilute Solution. J. Am. Chem. Soc. 1935, 57, 2171-2172.
33. Descamps, C.; Coquelet, C.; Bouallou, C.; Richon, D., Solubility of hydrogen in methanol at temperatures from 248.41 to 308.20 K. Thermochim. Acta 2005, 430, 1-7.
34. Broden, A.; Simonson, R., Solubility of oxygen. Svensk Papperstidning 1978, 17, 541-544.
35. Tan, Z.-Q.; Gao, G.-H.; Yu, Y.-X.; Gu, C., Solubility of oxygen in aqueous sodium carbonate solution at pressures up to 10 MPa. Fluid Phase Equilib. 2001, 180, 375-382. 36. O'Sullivan, T. D.; Smith, N. O., Solubility and partial molar volume of nitrogen and methane in water and in aqueous sodium chloride from 50 to 125. deg. and 100 to 600 atm. J.
Phys. Chem. 1970, 74, 1460-1466.
37. Blanc, P.; Lassin, A.; Piantone, P.; Azaroual, M.; Jacquemet, N.; Fabbri, A.; Gaucher, E. C., Thermoddem: A geochemical database focused on low temperature water/rock interactions and waste materials. Appl. Geochem. 2012, 27, 2107-2116.
38. Shock, E. L.; Helgeson, H. C.; Sverjensky, D. A., Calculation of the thermodynamic and transport properties of aqueous species at high pressures and temperatures: Standard partial molal properties of inorganic neutral species. Geochim. Cosmochim. Acta 1989, 53, 2157-2183.
39. Schulte, M. D.; Shock, E. L.; Wood, R. H., The temperature dependence of the standard-state thermodynamic properties of aqueous nonelectrolytes. Geochim. Cosmochim.
Acta 2001, 65, 3919-3930.
40. Schneider, A. C.; Pasel, C.; Luckas, M.; Schmidt, K. G.; Herbell, J.-D., Determination of hydrogen single ion activity coefficients in aqueous HCl solutions at 25 C. J. Solution
Chem. 2004, 33, 257-273.
41. Sakaida, H.; Kakiuchi, T., Determination of single-ion activities of H+ and Cl–in aqueous hydrochloric acid solutions by use of an ionic liquid salt bridge. J. Phys. Chem. B
2011, 115, 13222-13226.
42. Khoshkbarchi, M. K.; Vera, J. H., Measurement and correlation of ion activity in aqueous single electrolyte solutions. AlChE J. 1996, 42, 249-258.
43. Hohm, U.; Kerl, K., Temperature dependence of mean molecular polarizability of gas molecules. Mol. Phys. 1986, 58, 541-550.
44. Lemmon, E.; Bell, I. H.; Huber, M.; McLinden, M., NIST Standard Reference Database 23: Reference Fluid Thermodynamic and Transport Properties-REFPROP, Version 10.0. National Institute of Standards and Technology 2018.
45. Battino, R.; Seybold, P. G., The O2/N2 ratio gas solubility mystery. J. Chem. Eng.
Data 2011, 56, 5036-5044.
46. Wylie, R. G.; Fisher, R. S., Molecular interaction of water vapor and oxygen. J. Chem.