Abstract—Elia, the Belgian TSO, is aiming to minimize curtailment of wind power plants connected to its 70kV rural network to the absolute minimum by using Dynamic Line Rating in combination with advanced flow simulation. This combination allows Elia to use its network assets to their real time maximum, without increasing risk and decreasing the security of supply. In situations like the one described below, where it’s possible to control the flow in near real-time via curtailment it becomes possible to use all of the extra capacity available via Dynamic Line Rating. On average more then 30% extra capacity is available but this figure can easily increase to 100% extra capacity as soon as there is more then 4 m/s wind perpendicular to the line.
Index Terms— ANM (Active Network Management), Curtailment, Dynamic Line Rating (DLR), Elia, Onshore Wind power integration, Overhead Line Monitoring, Real Time Thermal Rating (RTTR) , smart grid
I. INTRODUCTION
ONNECTING wind power plants to the grid is one of the key issues holding back the growth of this promising sector. In many cases the geographic areas that are well suited for wind power plants have limited connection capacity available from the grid. In many countries and in particular in Europe it is very difficult and slow to extend the grid due, to a large extend, to the long and difficult process to obtain the necessary permits. Therefore more and more wind farms are connected with a limited capacity below the requested capacity and the right for the TSO to curtail the production when grid security requires it. This obviously reduces the operational margin of the windfarm and so "destroys" economic value for the society at large. Dynamic Line Rating (DLR) can offer an interesting solution to address this problem. Today high voltage overhead lines (HV OHL) are operated either based on a static limit or on seasonal limits where this makes sense (significant difference between summer and winter climate). This approach is very conservative as it uses worst case weather assumptions (low wind, high ambient temperature and incident solar radiation) to determine the thermal rating (the maximum power that can be transmitted without
C
P. Schell is with Ampacimon SA, Angleur Belgium (e-mail: [email protected] ).
J. –J. Lambin is with Elia, Brussels Belgium, (e-mail: [email protected] ).
B. Godard is with ULG Montefiore institute, Liège Belgium, (email: [email protected])
H-M. Nguyen is with ULG Montefiore institute, Liège Belgium, (e-mail: [email protected])
J-L. Lilien is with ULG Montefiore institute, Liège Belgium, (email: [email protected])
infringing sag and cable temperature limits) of the HV OHL. DLR will replace this static or seasonal limit with a dynamic limit based on the conditions experienced by the lines. Using this method can increase the thermal rating of the OHL by 30% or more especially on days where the lines are cooled by the wind.
Based on this reasoning, Elia the Belgian TSO has decided to implement DLR on its 70 kV network in south-east Belgium to minimize the curtailment of the wind farms and other DGUs (Distributed Generation Units) that are coming on-line in this region, that is characterized by interesting wind statistics but a weak rural grid.
The following paper will highlight the details of the chosen DLR solution provided by Ampacimon SA a spin-off of the University of Liège, Belgium and focus on the first operational experiences gathered. The paper will also highlight the economic gains made, i.e. the amount of curtailment that was avoided and the operational processes that are used to operate the grid safely in this new dynamic way.
II. THE PROBLEM
Elia, the Belgian TSO, has been requested to connect significant amounts of wind-power to its 70kV network in the Ardennes region in south-east Belgium (see Fig. 1). The connection capacity of the existing network, calculated the traditional way, is already fully utilized and it has become impossible to connect new wind power plants. Extending the capacity of the grid in this area is not possible in a reasonable timeframe and budget and refusing the connection of new wind farms in this location was not an option either, therefore it was chosen to implement an ANM (Active Network Management) solution and connect the plants with the right for the TSO to curtail the output as needed to guarantee safe network operations at all times. Curtailment provides the desired solution but destroys economic value for the operator of the wind power plant and reduces the amount of wind-energy in the energy-mix. It is therefore a suboptimal solution in this respect. To reduce the amount of curtailment required to the very strict minimum, Elia decided to implement an innovative solution using Dynamic Line Rating to maximize the use of the existing 70kV network and at the same time minimize the total cost1
towards the energy consumers.
1 Here we mean with total cost the cost per kWh of wind energy production and transport. Specifically maximizing the output (or minimizing the curtailment) of the wind-power plant, while minimizing the required investment in the transport network.
Using Dynamic Line Rating to minimize
curtailment of Wind power connected to rural
power networks
Authors:P. Schell (Ampacimon, Belgium) J-J. Lambin (Elia, Belgium) B. Godard (University of Liège, Belgium) H-M. Nguyen (University of Liège, Belgium) Prof. J-L. Lilien (University of Liège, Belgium)
France Germany Flanders
Fig. 1 The target area for the solution is the “east-loop” in the south-east of Belgium near the German border.
III. THE SOLUTION
Based on its past experience with Dynamic Line Rating as described in [1] and [2], Elia decided that it made sense to apply the same solution to the problem described above and enhance their ANM solution: Instead of using the static seasonal rating as described in [3] to calculate the required curtailment, the idea is to base the calculations on the real, dynamic line rating2 to: in a first step minimize the amount
of curtailment of existing wind power plants in real-time operation and in a second step increase the available connection capacity for new (wind) power plants.
Combining the DLR and ANM solutions makes a lot of sense as they complement each other well. The DLR solution provides the real thermal limits of the network which, in this case (and in many cases), is the main bottleneck that determines system capacity and ANM provides the tool to use all of this dynamic capacity in a secure and controlled way.
A. Location and Line type
A section of line was selected (see Fig. 2) to install an Ampacimon sag measurement module to validate the concept on the 70kV network. Further modules will be installed at a later stage to equip all critical spans.
Fig. 2 The equipped line is situated in southern Belgium, in the Ardennes region about 60 km north-west of Luxemburg.
2 Also called Real Time Thermal Rating or Real Time Ampacity
The equipped line is of the type AMS95 and has a 12.5 mm diameter. The static rating of the line is 370 A in winter and 320 A in summer.
B. The Solution Architecture
The overall solution architecture has 3 main tiers: 1. The Module(s)
2. The Ampacimon DLR application 3. The EMS and optimal flow simulator
The data is transferred by GSM/GPRS from the module to the Ampacimon server, which computes the DLR based on the various inputs (including line loading from the EMS system) and transfers the result to the EMS and OPF (= Optimal Power Flow). The EMS system will determine if there is an overload and trigger the OPF to calculate the required curtailment to solve the overload. The OPF will then determine the new set points for the wind farms. The whole process is done every 15 minutes. (see Fig. 3)
Fig. 3. Overall architecture showing hi-level data-flow
C. The Sag measurement Module
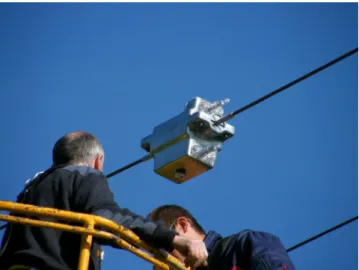
To calculate the DLR of the different lines involved Elia decided to use Ampacimon direct sag monitors and software [4]. The module (see Fig. 4) detects the mechanical movements induced by the wind on the conductor to determine its fundamental frequency, which is a direct image of the conductor’s sag3.
3 without the need for any additional data Belgium Orgeo
Fays-Les-Veneurs
Fig. 4. Ampacimon module installed on the 70 kV line.
The accurate sag measurement allows the software to “calibrate” the ambient weather conditions and use the effective conditions to determine DLR (see Fig. 5). This method removes the uncertainty related to point measurement of these important variables4 and provides the
operator with a trustworthy rating.
Fig. 5. By comparing the conductor temperature based on the sag measurement to the theoretical conductor temperature as computed using the IEEE thermal equilibrium equation, it is possible to determine the effective weather parameters that justify the measured sag.
D. The ANM solution
Renewable productions from wind and sun are seldom at their maximum power, therefore it is possible for the TSO to soften the connection criteria. TSO and DSO can accept more renewable production if they have the possibility to quickly reduce this production if necessary using a dynamic network management or ANM solution.
Instead of the maximum allowed installed capacity determined on a (static) deterministic N-1 calculation, the injection limit of wind farms is calculated for N-situation, so that they can inject significantly more (see § IV) but this injection can be curtailed in case an overload of the network occurs. (Note : it’s important to make a clear difference between the connection criteria and exploitation criteria)
This overload can be due to N-1 situation (Note : this covers the incidents and planned outages as well), in this
4 wind and solar radiation in particular
case we speak about N-1 curtailment, or in the future the overload can be due to high injection volumes and/or low local consumption and in this case we will talk about N curtailment. As already mentioned, the EMS system has the task to identify local overloads either on the network when the measured current exceeds the DLR values as received from the Ampacimon system (see Fig. 3) or due to the transformers when these are the limiting factor. The EMS system then triggers the OPF system that will calculate the maximum allowable wind production to resolve the identified overload. The optimized power flow calculation will take into account all elements that influence the network including the dynamic thermal ratings as well as the agreed principles of conditional access5 [3]. Based on this
criteria’s the OPF will determine the new set points for the wind power plants and send those out via the EMS system.
IV. FIRST FINDINGS
The latest results will be presented during the conference as the project is still ongoing. In the mean-time preliminary results based on prior DLR installtions within the Elia Network allow us to have a first idea on the extra available capacity
Fig. 6 Histogram of available dynamic capacity (green) as percentage of static rating for October 2010. 150 kV line Brugge-Slijkens
5 Many possibilities exist to decide which producers will be curtailed when needed. This can be based on a typically technical optimum for the transmission network and combined at substation level, for example, with shared equally across all relevant power plants or using the LIFO principle where the last power plant connected to the network is curtailed first. This largely depends on the regulatory framework in place.
Fig. 7 Histogram of available dynamic capacity (green) as percentage of static rating for April 2011. 150 kV line Brugge-Slijkens
The situations are not fully comparable but the results indicate that significant increases in capacity are to be expected. It is also interesting to note that a relatively low perpendicular wind speed (near 2 m/s) is required to achieve significant (>150%) capacity gain on either fig. 6 (October) or 7 (April).
It must be emphasized that the real time values used have a validity of at least 15 minutes due to the thermal time constant of the conductors. The Ampacimon software is also capable of extrapolating the measured data to provide reliable 1 and 4 hour forecasts, but these are not currently in use in this project because set points are evaluated every 15 minutes.
These increases in available capacity come on top of the gains that are already obtained by using the ANM solution due to the fact that this solution allows Elia to use the full capacity available and curtail only when incidents occur, instead of statically adhering to the N-1 principle. This approach alone already increases the available connection capacity by nearly 75%.
V. CONCLUSIONS
The dynamic, real-time nature of the solution presented is the key. Determining the real, dynamic limit of the conductor and having the ability to control the flows on the network in near-real time allows Elia to operate its asset at significantly increased efficiency6. This is definitely a very
valid and quick solution to allow more (wind) produced power to the existing, saturated networks (Note : connection and operation decisions have to be distinguished). It raises the question if connecting intermittent power sources like wind and sun at their full nominal capacity should remain the norm or if the dynamic approach described in this paper including a minimum of curtailment can also be taken into account in the connection criteria and become the standard in all areas where network capacity is scares or particularly expensive/valuable. The investment cost saved and therefore spend elsewhere with potentially more added value seems substantial compared to the very slight reduction in return on investment due to the limited curtailment of the wind
6 in terms of investment and operational cost per MWh transported
farms. It is still too early to quantify this qualitative conclusion, but the initial data available sure does point in this direction.
The authors of this paper are actually participating in the European project TWENTIES [5] including two demos (Spain and Belgium) on DLR and wind farms opportunities.
VI. ACKNOWLEDGMENT
The authors gratefully acknowledge the contributions of Smarter Grid Solutions Ltd. (Glasgow, UK) and V. De Wilde (Elia) to the ANM project in general and the information provided for this paper in particular.
VII. REFERENCES
[1] E. Cloet, JL. Lilien, P. Ferrières. Experiences of the Belgian and
French TS0s using the « Ampacimon » real-time dynamic rating system. CIGRE 2010 Session papers, Group C2, C2-106
[2] E. Cloet, J.L. Lilien. Uprating Transmission Lines Through the Use
of an Innovative Real-Time Monitoring System. IEEE Power &
Energy Society, ESMO conference. IEEE PES 12th International
Conference on Transmission and Distribution Construction, Operation and live-line maintenance, Providence, Rhodes Island, 16-19 May 2011.
[3] O.Durieux, V. De Wilde, J-J Lambin, S. Otjacques, M.Lefort. Smart Grid Technologies Feasibility Study: Increasing decentralized
generation power injection using global active network
management. CIRED 21st International Conference on Electricity
Distribution. Frankfurt, 6-9 June 2011. [4] www.ampacimon.com
VIII. BIOGRAPHIES
Peter Schell was born in Brussels , Belgium, on July
15, 1970. He studied at the University of Stuttgart, Germany and graduated in 1995 as Dipl. Ing. Luft- und Raumfahrttechnik. His employment experience includes large-scale IT projects at amongst other Deutsche Bahn Cargo and the French distributor Auchan. After that he specialized in Utilities and worked for more then 10 years for different Belgian Utilities helping them adapt to the liberalized market and prepare for the roll-out of smart meters. Since February 2011 he is the CEO of Ampacimon.
Jean-Jacques Lambin , 1953, Ind. Ing, Associate
Expert Network Security Analysis at Elia (Belgian TSO) started his career in the electrical sector in 1977. Head of the Control Centrum of Brussels from 1990 till 2000, Responsible of operational security at Elia from 2000 till 2008. Since 2009, Associate Expert Security Analysis and integration renewable energy.
Bertrand Godard received his degree in civil
engineering (physics and continua) from the University of Liège (Belgium) in 2004. He is now a PhD student at the same University (Dept. Electricity, Electronics and Computer Sciences, Unit of Transmission and Distribution of Electrical Energy). He is also a member of the Ampacimon team and his work relates to the real-time monitoring of overhead transmission lines. He has been an F.R.I.A scholarship holder in 2008.
NGUYEN Huu-Minh graduated from University of Liège, Belgium, as a
physics engineer. He has been working as a teaching assistant and PhD student for 4 years in the Transmission and Distribution of Electrical Energy Unit at the Montefiore Institute of Technology, University of Liège, Belgium. His main activity has been to deal with real-time High-voltage overhead lines maximum carrying-current capacity (known as “ampacity”). He has been working on the development and implementation of algorithms for this purpose at the University of Liège, and is now working on 48-hour ahead ampacity prediction, using learning machine and statistic algorithms. He is actually supported by European project TWENTIES.
Professor J. L. Lilien, PhD., is the head of the unit
Transmission and Distribution of Electrical Energy at the Montefiore Institute of Technology, University of Liège, Belgium. He has over 30 years experience solving the electrical and mechanical engineering problems of power systems. His work involves analysis of problems in “cable dynamics” in general and on overhead power lines in particular. His major activities were devoted to (i) vibrations on transmission lines, in particular galloping, including its control (ii) large movements of cables, like short-circuit (both in substations and power lines), (iii) health monitoring of power lines (sag and vibrations) and last, but not least (iv) low-frequency electric and magnetic field effects on human beings. Jean-Louis is a long-time active member of IEEE and CIGRE, where he has served as convenor of several task forces of CIGRE study committee B2, “overhead lines” and B3 “susbstations”. He has published over 100 technical papers in peer reviewed publications. He is the initiator and organiser from 1995, of the CABLE DYNAMICS conference.