YANPING CHEN
From physics to application of
^lamentation in air
Thèse présentée
à la Faculté des études supérieures de l'Université Laval
dans le cadre du programme de doctorat en Physique
pour l'obtention du grade de Philosophiae Doctor (Ph. D)
DEPARTEMENT DE PHYSIQUE, GENIE PHYSIQUE ET D'OPTIQUE
FACULTÉ DES SCIENCES ET DE GÉNIE
UNIVERSITÉ LAVAL
QUÉBEC
2010
Résumé
La fïlamentation dans l'atmosphère est devenue un sujet de recherche des plus attrayants à cause de ses applications possibles à la télédétection de polluants, au contrôle de la foudre, à la génération d'impulsion laser de quelques cycles et à la génération de terahertz à distance. La fïlamentation d'une impulsion laser femtoseconde intense induit non seulement une transformation significative dans le profil spatio-temporel de l'impulsion laser, mais elle brise en plus la centro-symétrie du milieu de propagation. Le mécanisme physique derrière la fïlamentation est donc complexe. Plusieurs processus non linéaires intéressants se produisent simultanément au cœur du filament. L'objectif de cette thèse est d'étudier les effets principaux non linéaires qui surviennent pendant la fïlamentation d'une impulsion laser femtoseconde intense dans l'air. Les impulsions laser utilisées dans ces expériences proviennent d'une chaîne laser Ti : saphir commerciale.
L'évolution complète d'un filament dans l'air est systématiquement étudiée. L'émission de fluorescence du filament, son diamètre et son contenu spectral sont mesurés. Nous montrons qu'un filament peut être vu comme une colonne « auto-guidée » avec deux sections d'ionisation: une première où l'ionisation est efficace suivie par une seconde, faiblement ionisée. Le diamètre du cœur du filament demeure quant à lui presque constant. L' « auto-conversion » vers les basses fréquences est observée en fonction de la longueur du filament et elle est causée par la réponse Raman moléculaire.
Il est aussi démontré que l'intensité élevée au cœur du filament dans l'air induit une forte biréfringence instantanée due à la modulation de phase croisée d'origine électronique et une forte biréfringence retardée due à la réponse Raman. Cette dernière mène à la génération d'un séparateur de polarisation gazeux ultrarapide sans seuil de dommage ni limitation spectrale.
De plus, on observe expérimentalement que l'émission terahertz provenant soit d'un filament à une couleur dans l'air, soit d'un filament à deux couleurs, a une polarisation
elliptique. Ceci est attribué au bris de la symétrie de l'air dans le filament. Finalement, nous étudions la polarisation de la radiation terahertz provenant d'un filament soumis à un champ électrique DC. On montre qu'une nouvelle source de terahertz, différente de l'émission terahertz provenant d'un filament à une couleur sans champ externe, est générée en appliquant un champ électrique externe. La polarisation linéaire de cette source de terahertz est parallèle au champ DC.
Abstract
Fïlamentation in the atmosphere has become one of the most attractive research topics due to its promising potential applications, such as remote atmospheric pollutants detection, lightning control, few-cycle laser pulse generation and remote terahertz generation, etc. The fïlamentation process of an intense femtosecond laser pulse not only induces significant transformations in the spatio-temporal profile of the laser pulse but also breaks the centro-symmetry of the propagation medium. Thus, the physical mechanism of the fïlamentation process is quite complex. Many interesting nonlinear processes take place simultaneously inside the filament core. The aim of this thesis is to investigate key nonlinear processes occurring during the fïlamentation of intense femtosecond laser pulses in air. The laser pulses used in the experiments are delivered by a commercial Ti-Sapphire femtosecond laser system.
A full evolution of a femtosecond laser filament in air is systematically investigated, including the emitted fluorescence signal, the diameter of the filament core and the spectrum of the filament. It is found that a filament could be regarded as a self-guided column with two ionizing sections: one with efficient ionization followed by the other weakly ionized. The diameter of the filament core stays almost constant, and continuous self-frequency down shift in the spectrum is observed as a function of the filament length, which is due to molecular Raman response.
It is also demonstrated that the high intensity within the core of an air-filament induced an instantaneous strong birefringence thanks to electronic cross phase modulation and a delayed strong birefringence due to rotational Raman response, the latter leading to the generation of an ultrafast gaseous polarization separator that is free from damage threshold and spectral bandwidth limitation.
Moreover, it is experimentally observed that terahertz emission from either a one-color air-filament or a two-color air-filament is elliptically polarized due to symmetry-breaking of air in the filament zone. Finally, we investigated the polarization
of the terahertz radiation from a DC-biased filament. It is demonstrated that a new terahertz source, apart from the terahertz emission from a one-color filament without DC-bias, is generated by applying a DC bias to a one-color filament. The linear polarization of this terahertz source is parallel to the DC field.
Résumé court
Dans cette thèse, nous présentons quelques effets non linéaires qui surviennent lors de la fïlamentation d'une impulsion laser intense dans l'air. Nous montrons expérimentalement l'évolution complète d'un filament unique, l'auto-conversion vers les basses fréquences dans un filament dans l'air, la biréfringence induite par un filament dans l'air et les caractéristiques de l'émission terahertz d'un filament à une couleur, à deux couleurs où avec un champ électrique externe appliqué.
Acknowledgements
The work presented in this thesis is realized in the ultra-short intense laser laboratory led by Prof. Chin in Laval University. I appreciate very much that Prof. Chin has provided me the great opportunity to join this group, which is always working at the forefront of the field in laser science. He has taught me so much about the physics and led me to an exciting scientific world. I want to express to him my sincere thankfulness for his direction, his encouragement and his support during my study as a Ph. D student. His insight and his passion for Science will be a model for me throughout my career. I would like to gratefully acknowledge my co-director, Dr. Francis Théberge, who gave me lots of training in the laboratory. I appreciate very much the time during which I had opportunity to work together with him. Through him, I made my first step on the field of laser fïlamentation.
I would like to express my deep gratitude to Mr. Mario Martin for his technical support in the lab. His kind assistance helped me a lot in performing the experiments. I would next thank Mr. Claude Marceau for many kind helps during the experiments, especially in computer programming. I would also thank Dr. Tiejun Wang, Dr. Zhendong Sun and Dr. Weiwei Liu for their suggestions and fruitful discussions. It is my greatest pleasure to get to know them and work with them closely. I express my sincere gratitude to all the staffs in the physics department and COPL. I would like to acknowledge those whom I have been fortunate to know and work in proximity with in the laboratory. Moreover, during my study I have received generous helps from Dr. Olga Kosareva, Prof. Valerii P. Kandidov and Dr. Neset Akôzbek. They are excellent scientists in computation physics. The collaboration with them helps me get insight into many interesting physical phenomena.
Table of Contents
Résumé ii Abstract iv Résumé court vi Acknowledgements vii Table of Contents ix List of Figures xi Chapter 1 Introduction 11.1 The beginning of fïlamentation nonlinear optics 1
1.2 Potential applications 3 1.3 About this thesis 4 Chapter 2 Physics of fïlamentation 6
2.1 Kerr self-focussing of a CW beam 6
2.2 Moving focus model 8 2.3 Intensity clamping 10 2.4 Spectral broadening and conical emission 12
2.5 Self-spatial mode filtering 16
Chapter 3 Laser chain 19 Chapter 4 Evolution of a single filament in air 23
4.1 Introduction 23 4.2 Experimental setup 23 4.3 Results and discussions 25
4.4 Conclusion 30 Chapter 5 Filament ation-i nduccd continuous self-frequency down shift in air 31
5.1 Introduction 31 5.2 Experimental setup 32 5.3 Results and discussions 33
5.4 Conclusion 39 Chapter 6 Polarization separator created by a filament in air 40
6.1 Introduction 40 6.2 Experimental setup 40 6.3 Results and discussions 41
6.4 Conclusion 48 Chapter 7 THz emission from one-color filament 50
7.1 Introduction 50 7.2 Experimental setup 51 7.3 Results and discussions 53
7.4 Conclusion 57 Chapter 8 THz emission from two-color filament 59
8.1 Introduction 59 8.2 Experimental setup 60 8.3 Experimental results 62 8.4 Four-wave mixing model 66
8.5 Discussions 70 8.6 Conclusion 72 Chapter 9 THz emission from DC-biased filament 74
9.1 Introduction 74 9.2 Experimental setup 74 9.3 Results and discussions 75
9.4 Conclusion 83 Chapter 10 Conclusion 85 Appendix Electro-optic sampling detection 87
List of Figures
Figure 2-1 : Power dependent self-focusing distance 7 Figure 2-2: Schematic diagram of the moving focus model 9 Figure 2-3: Moving focus location as a function of time and input pulse power 10
Figure 2-4: Schematics of multiphoton ionization and tunnel ionization 11 Figure 2-5: Beam pattern of a filamenting pulse at far field 13 Figure 2-6: Simulated intensity distribution of an initially distorted pulse profile at two
propagation distances in air 17 Figure 3-1 : Schematic layout of the laser chain 19
Figure 3-2: Schematics of the regenerative amplifier 21
Figure 4-1 : Schematic experimental setup 24 Figure 4-2: Characterization of the filament zone 26 Figure 4-3: Typical beam patterns along the propagation axis 27
Figure 4-4: Numerical simulations on plasma density and intensity profile of a
filamenting laser pulse 29 Figure 5-1 : Schematic experimental setup 32
Figure 5-2: Spectral evolution as a function of laser energy 33 Figure 5-3: Spectral evolution as a function of propagation distance 35
Figure 5-4: Schematic setup with a 4.5-m-long chamber for air and argon 36 Figure 5-5: Comparison of spectra formed by fïlamentation in air and in argon 37 Figure 5-6: Beam profile of the laser beam at propagation distance of 6 m 38
Figure 6-1 : Schematic illustration of the experimental setup 41 Figure 6-2: Integrated fluence of the central spot in the probe beam 42
Figure 6-3 : Typical probe profiles after interaction with the pump 42 Figure 6-4: Typical beam profiles of the probe after interaction with the pump in air
taken at varied polarizer orientations 43 Figure 6-5: Polarization analysis of the central spot, the ring in Flower Pattern and the
outer ring 45 Figure 6-6: Polarization analysis of the central spot of the probe 46
Figure 6-7: Measured alignment of 1 atm of N2and O2 at room temperature 48
Figure 7-1: Schematic illustration of the experimental setup 51 Figure 7-2: Typical experimental THz electric field waveform and the corresponding
amplitude spectrum 52 Figure 7-3: Measured and simulated intensity evolution of the THz electric field 53
Figure 7-4: Measured and simulated THz polarization 54 Figure 7-5 : Polarization of the THz pulses at varied pump orientation 56
Figure 8-1 : Schematic illustration of the experimental setup 61 Figure 8-2: Intensity evolution of the THz electric field 61
Figure 8-3: Typical experimental THz electric fields obtained at two orthogonal directions, corresponding THz amplitude spectra and THz polarization 63
Figure 8-4: Polarization of the THz pulses measured at different angle 9 65
Figure 8-5: Coordinate Systems defined in this work 66
Figure 8-6: Variation of E*HJ'EYTH. as a function of or. 67
Figure 8-7: THz polarization trajectory obtained when a = 140° 68 Figure 8-8: Energy dependence of the polarization of the THz pulses 72
Figure 9-1 : Schematic experimental setup 75 Figure 9-2: Polarization of THz emission from a filament with a DC field 76
Figure 9-3 : Peak-to-peak amplitude of THz Y component, THz spectral amplitudes and
THz waveforms 77 Figure 9-4: Energy dependence of peak-to-peak amplitude of the THz signal 79
Figure 9-5: Normalized spectral amplitudes for linearly polarized THz emission from
DC-biased filaments 81 Figure 9-6: Transmission of Teflon film ~0.1 mm-thick 82
Figure Al-1 : Power absorption coefficient (cm"1) for ZnTe crystal 87
Figure Al-2: Definition of the optical axis of the ZnTe crystal 88 Figure A1 -3 : Schematic setup for EOS detection of the THz pulses 92 Figure A1-4: A typical complete waveform of a THz pulse obtained by scanning the
Chapter 1 : Introduction
1.1 The beginning of fïlamentation nonlinear optics
Filamentation was first observed with a Q-switched laser beam focused into a solid by Hercher in 1964 [1]. Due to technical limitations when producing high peak power laser system, the filamentation in atmosphere was not obtained until the development of the chirped pulse amplification (CPA) technique that permitted the generation of femtosecond laser pulses with peak power higher than GW [2]. In 1995, Braun et al. observed self-channeling of a GW laser in air for more than 20 m [3]. The laser beam remained focused over several meters along the propagation axis. This type of propagation was called filamentation. Here, the term "filamentation" denotes an extended light string whereas the beam contracts and maintains a narrow diameter in the transverse diffraction plane over extended distances much longer than the Rayleigh length without the help of any external guiding mechanism. This propagation regime was identified as a balance between Kerr self-focusing effect and laser-induced plasma defocusing effect. The onset of the filamentation process can be manipulated by controlling the initial beam diameter and pulse duration [4, 5].
In the filamentation process, several effects (Kerr-induced self-phase modulation [6], plasma defocusing [5, 7] and group velocity dispersion) compete in a rich dynamics of many nonlinear processes. During the propagation, the laser pulse reorganizes itself in space and in time and splits into several sharp peaks [8-10]. One of the important consequences of the self-transformation of the laser pulse through filamentation is the generation of few-cycle pulses with high quality beam profile (M2 < 1.07) [11-13].
Besides, strong spectral broadening (supercontinuum) is generated (more details in chapter 2) which covers the entire visible part of the spectrum when propagating in air [5]. A nice application of the unique properties of the filament is illustrated by the possibility of designing optical parametric amplifiers where a filament acts as a pump source. Théberge et al. have shown that a few-cycle signal beam tunable over the entire
Chapter 1 Introduction
visible spectrum is obtained with a self-improved beam quality [14]. It was found that the transverse partem of the signal beam was circularly symmetrical around the propagation axis, while the initial beam profile was distorted. It is very close to a diffraction-limited Gaussian beam (M2 < 1.01). This self-improvement of the beam
quality translates the self-spatial mode filtering of a filament [15-17]. When compared to an OPA output operating with the same laser as a pump (but not in a filament form), the signal beam from the filament features a shorter pulse duration. This interprets the self-compression effect of a filament [10, 11, 18]. Energy fluctuations of the generated signal beam were also stabilized [14] during the nonlinear propagation, translating the intensity clamping effect inside a filament [5]. Such nice self-actions were also reported in the case of conical emission [15, 19]. These improvements of the laser pulses are contrary to the normal wisdom that any non-resonant, nonlinear interaction will result in a large fluctuation of the signal as compared to linear interaction. We call these new phenomena 'filamentation nonlinear optics' [16].
Filamentation nonlinear processes are nonlinear interactions within the filament core, essentially isolated from the inhomogeneous background reservoir [16]. The filament core has two important advantages. One is its stable intensity due to intensity clamping through the interplay between Kerr self-focusing and plasma induced defocusing [20], and another is the self-improvement of the beam spatial profile through self-spatial mode filtering [15-17]. Therefore, any nonlinear process sampling only the filament core features high conversion efficiency (owing to high intensity inside the filament core), high stability (due to intensity clamping inside the filament core) and high spatial quality (thanks to self-spatial mode filtering of the pulse during filamentation) [14, 16]. Several interesting experimental observations on nonlinear interaction during filamentation in air, such as self-phase modulation (continuum generation) [15], few-cycle pulse generation through four-wave mixing [14, 21], third-harmonic generation [22, 23] and singe-cycle terahertz pulses generation [24, 25], have already been reported in the past several years.
Chapter 1 Introduction
Recently, it was demonstrated that a laser filament can polarize the propagating gas medium (both atomic gases and molecular gases) and break its symmetry [26-28]. Thus, the dynamics of many nonlinear interactions involved in the filamentation processes become more and more complex. This interesting observation will surely open a new page in filamentation nonlinear optics.
1.2 Potential applications
Self-phase modulation and self-steepening during filamentation process leads to a supercontinuum spanning from the UV (250 nm) [23, 29-33] to the IR (experimental observation of a broadening up to 13 pm) [5, 34, 35]. Due to its coherent property, this supercontinuum could be used for optical pulse compression to produce shorter and shorter pulses in gases (typically in Argon or Neon) down to the single cycle regime (2.66 fs at 800 nm) [11, 12, 21, 36-44]. Besides, through optical parametric amplifications with the filament as a pump, it is possible to obtain a tunable few-cycle signal pulse covering a very wide spectrum with very nice beam quality and high energy stability [14, 45]. Moreover, the applications for the detection and identification of pollutants present in the atmosphere using a LIDAR (Light Detection And Ranging) have sparked great interest [46-49].
Self-guided filaments can induce substantial birefringence in gases. In atomic gases such as argon, due to the electronic cross-Kerr process, a filament can work as a half-wave plate for a co-propagating beam by controlling the gas pressure [26]. This allows the realization of a Kerr-gate with ultrafast switching time which is limited by the pulse duration of the filamenting beam. In molecular gases such as nitrogen and oxygen, apart from the electronic effect, delayed modification in refractive indices is obtained, which is contributed by laser induced rotational molecular wave packet [27, 28]. The molecules can be partially aligned in the presence of the filament. As a consequence, there is a positive change in the refractive index along the molecule's aligned direction and a negative change along its orthogonal direction. Thus, for a co-propagating probe, one probe component is guided inside the filament zone due to
Chapter 1 Introduction
the focusing effect of the positive change in the index of refraction while its orthogonal component is diffracted out due to defocusing effect. Therefore, a filament can work as a gaseous polarization separator which is free from damage threshold and spectral bandwidth limitation.
The onset of a filament can be manipulated by the beam diameter and pulse duration of an initial pulse [4, 5]. Therefore, a filament can be used as a carrier for other light sources which are not suitable for long-distance propagation in the atmosphere. For instance, long-range propagation of terahertz (THz) wave in air is highly limited by the strong absorption of THz by water vapor in air. THz radiation from a filament seems to be one solution to this propagation problem since the THz pulses can be generated close to the remote target by the filament [24, 25, 50, 51].
1.3 About this thesis
When femtosecond laser pulses propagate in air, they collapse into a filament which features a clamped intensity and a constant diameter over a propagation distance much longer than the Rayleigh range. All these interesting features are expected to play an important role in nonlinear processes inside the filament. Aiming to contribute to the understanding of the nonlinear processes during filamentation, this thesis identifies the characteristics of some nonlinear processes involved during the nonlinear propagation of femtosecond laser pulses in air. The thesis is organized as follows:
Chapter 2 (Physics of filamentation) outlines the physics of filamentation based on a moving focus model.
Chapter 3 (Laser chain) illustrates the laser system used for the experiments presented in this thesis.
Chapter 4 (Evolution of a single filament in air) characterizes the full evolution of a single filament by measuring the diameter of the filament core and the fluorescence signal from the side of the filament.
Chapter 1 Introduction
Chapter 5 (Filamentation-induced continuous self-frequency down shift in air) demonstrates continuous self-frequency down shift inside the filament zone during the propagation of a femtosecond laser pulse in air.
Chapter 6 (Polarization separator created by a filament in air) demonstrates that a femtosecond laser filament acts as a polarization separator for a co-propagating probe pulse in molecular gases.
Chapter 7 (THz emission from one-color filament) presents that elliptically polarized THz emission is observed from a single filament.
Chapter 8 (THz emission from two-color filament) diagnoses the polarization characteristics of THz emission from a two-color femtosecond laser filament when the polarizations of co and 2co beams are orthogonal.
Chapter 9 (THz emission from DC-biased filament) demonstrates that the THz emission from a DC-biased filament can be regarded as a sum of an elliptically polarized THz source (generated by a filament without external electric field) and a linearly polarized THz source induced by the external electric field applied to the filament.
Chapter 2: Physics of filamentation
2.1 Kerr self-focusing of a CW beam
The phenomenon of Kerr self-focusing was observed in 1960s [1, 52]. The refractive index of air n in the presence of an intense laser beam does not only depend on its frequency, but also on the spatial distribution of the laser intensity I(r) according to the relation:
n = n0 + Ankr=n0 + n2I(r), (2-1)
where no is the linear index of refraction; «2, termed as the coefficient of the Ken-nonlinear index of refraction, relates to third-order Ken-nonlinear susceptibility x- by [5]
f} = 4eocn2n02/3. (2-2)
In Eq. (2-2), eo is the permittivity of vacuum and c is the velocity of light in vacuum. In most optical medium, the coefficient «2 is positive. If we consider a laser beam with a transverse Gaussian distribution in intensity propagating in an optical medium, the resulting index of refraction at the center of the laser beam is higher than that at the outer zone. Thus, the velocity at the center of the beam is lowest, and it increases radially from the center to the outer edges. As a result, a curvature of the wavefront is induced, which is similar to that of a lens [5, 53]. Thus, this type of phenomenon is called self-focusing. In principle, the laser beam starts to self-focus provided that (1) there is a non-uniform transverse spatial distribution in intensity of the laser beam across the wavefront and (2) the power of the laser beam is higher than the critical power Per for self-focusing, which is suggested by numerical simulations beyond the paraxial approximation as [54]
Chapter 2 Physics of filamentation
Figure 2-1 : Self-focusing distance as a function of the initial power of the laser pulse according to Eq. (2-4).
where A is the central wavelength of the laser beam. The critical power is around a few GWs for the gas media. When the initial power of the laser beam is lower than the critical power Pcr, linear diffraction of the laser beam dominates the propagation process.
Thus, the intensity of the laser beam quickly decreases and becomes negligible. When the initial power of the laser beam equals to the critical Pcr, the linear diffraction of the
laser beam is balanced by the self-focusing effect. When the initial power of the laser beam is higher than the critical power Pcr, the laser self-focusing effect overcomes the
laser linear diffraction effect, i.e., the laser beam collapses. The focusing effect will get stronger and stronger during the propagation if there is no saturation mechanism. The self-focusing distance is determined by [54]:
0.367*an2 f o "\
ypc j
-0.852 -0.0219
Chapter 2 Physics of filamentation
where a0 is the beam radius defined at Me level of intensity, Pin is the initial power of
the laser beam and k is wave number of the laser beam. According to Eq. (2-4), Fig. 2-1 shows the energy dependence of the self-focusing distance Zf as a function of the initial power of the laser beam. The self-focusing distance decreases by one order of magnitude with the increase in the initial power of the laser beam from P = 1.1 Pcr to P
= 50Pcr.
In many experiments, an external lens is often used to force the beam to self-focus earlier due to the limited length of the propagation medium. The new self-focusing distance z'f is predicted by the lens transformation equation:
1 1 1
-r- = — + - , (2-5)
zf zf f
where/is the geometrical focal length of the external lens.
2.2 Moving focus model
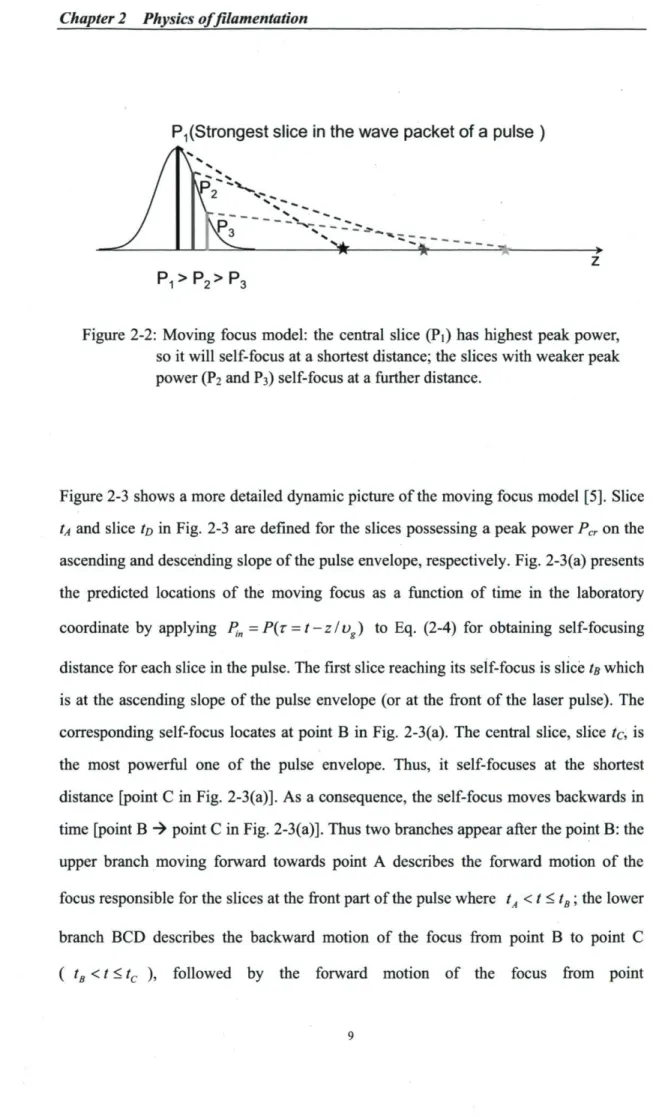
In the case of a pulsed laser, the steady-state regime discussed in the last section is not sufficient to explain the features. The self-focusing process of a laser pulse can be interpreted by the moving focus model [19, 55, 56], in which the laser pulse is considered as a stack of successive thin slices in time (or in space along the propagation axis) that are independent from each other. Each slice contains a specific power and its thickness is at least CT ( T is an optical cycle of the electromagnetic wave) [57]. This is because the intensity of an electromagnetic wave is represented by the Poynting vector averaged over at least one optical cycle. All the slices inside the pulse envelope with peak power higher than the critical power Pcr self-focus at distances predicted by
Eq. (2-4), as shown in Fig. 2-2. Thus, a series of self-foci, coming from the self-focusing of different slices of the pulse (with peak power above the critical power Pcr), is produced on the propagation axis. This constitutes what we call a filament. The
Chapter 2 Physics of filamentation
P.,(Strongest slice in the wave packet of a pulse )
*
P
1>P
2>P
3Figure 2-2: Moving focus model: the central slice (Pi) has highest peak power, so it will self-focus at a shortest distance; the slices with weaker peak power (P2 and P3) self-focus at a further distance.
Figure 2-3 shows a more detailed dynamic picture of the moving focus model [5]. Slice tA and slice to in Fig. 2-3 are defined for the slices possessing a peak power Pcr on the
ascending and descending slope of the pulse envelope, respectively. Fig. 2-3(a) presents the predicted locations of the moving focus as a function of time in the laboratory coordinate by applying Pin = P(z = t - z l vg) to Eq. (2-4) for obtaining self-focusing
distance for each slice in the pulse. The first slice reaching its self-focus is slice tg which is at the ascending slope of the pulse envelope (or at the front of the laser pulse). The corresponding self-focus locates at point B in Fig. 2-3(a). The central slice, slice t& is the most powerful one of the pulse envelope. Thus, it self-focuses at the shortest distance [point C in Fig. 2-3(a)]. As a consequence, the self-focus moves backwards in time [point B -> point C in Fig. 2-3(a)]. Thus two branches appear after the point B: the upper branch moving forward towards point A describes the forward motion of the focus responsible for the slices at the front part of the pulse where tA< t <tB; the lower
branch BCD describes the backward motion of the focus from point B to point C ( tB <t <tc ), followed by the forward motion of the focus from point
Chapter 2 Physics of filamentation
Figure 2-3: (a) Moving focus location as a function of time and (b) input pulse power. The slice with maximum peak power collapses at the shortest distance from the laser pulse. The slices with lower peak power self-focus at a farther distance on the propagation axis.
C to point D corresponding to the slices in the trailing part of the pulse (tc < t <tD).
2.3 Intensity clamping
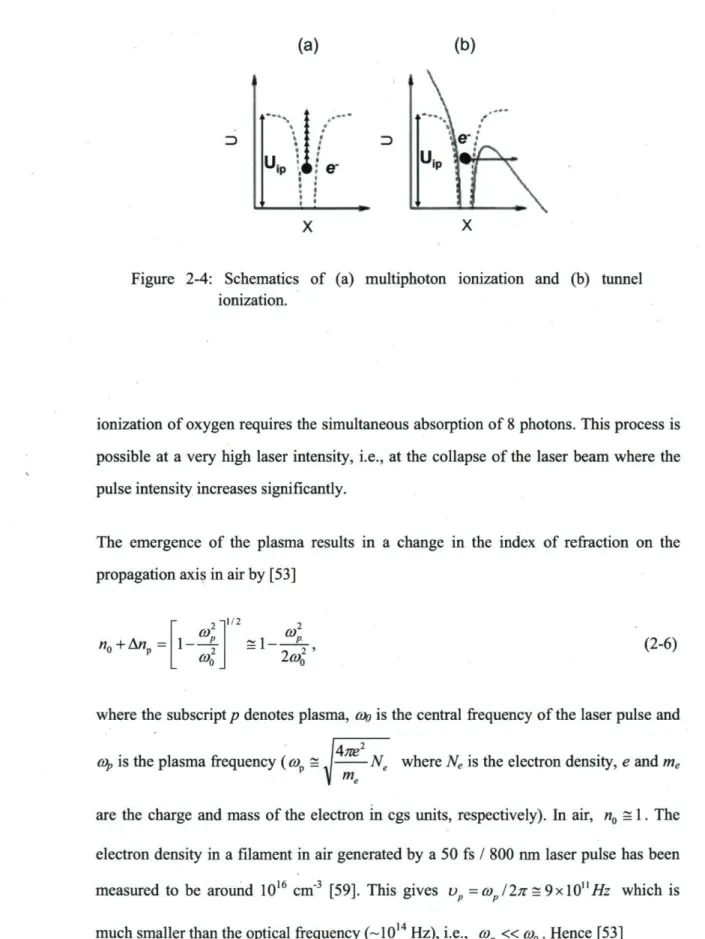
Now we know when an intense laser pulse propagates in air, it will self-focus at a certain distance following the moving focus model. During this process, the intensity of this laser pulse becomes higher and higher. As a result, it induces a weak plasma on the propagation axis through tunnel/multiphoton ionization (TI/MPI) of the air molecules [5, 53], as Fig. 2-4.
The ionization potential Uip is 12.063 eV for oxygen and 15.576 eV for nitrogen [58]. In
the case of an 800 nm laser beam, the energy of the laser photons (ha)0 =1.5 eV ) is far
lower than the ionization potential UiP in both oxygen and nitrogen. For instance,
Chapter 2 Physics of filamentation
(a)
UipUfe-(b)
Figure 2-4: Schematics of (a) multiphoton ionization and (b) tunnel ionization.
ionization of oxygen requires the simultaneous absorption of 8 photons. This process is possible at a very high laser intensity, i.e., at the collapse of the laser beam where the pulse intensity increases significantly.
The emergence of the plasma results in a change in the index of refraction on the propagation axis in air by [53]
n0 + Anp - i l l 2 ( O n I " T con = 5 1 — Icol (2-6)
where the subscript p denotes plasma, coo is the central frequency of the laser pulse and \4ne
cop is the plasma frequency {a>• = I Ne where Ne is the electron density, e and me
V me
are the charge and mass of the electron in cgs units, respectively). In air, n0 = 1. The
electron density in a filament in air generated by a 50 fs / 800 nm laser pulse has been measured to be around 1016 cm'3 [59]. This gives vp = copl2n = 9-x.\0n Hz which is
much smaller than the optical frequency (~1014 Hz), i.e., a> « a>0. Hence [53]
Chapter 2 Physics of filamentation
<o„ 4m1N (t)
* »
P= - z
JT = - ™ ' I ' - (2-7)
2o)0 2mecoQ
Therefore, in the presence of the plasma, the total index of refraction on the propagation axis is contributed by two nonlinear components:
n = n0+Ank r+Anp. (2-8)
Introduce Eq. (2-1) and Eq. (2-7) into Eq. (2-8), the total index of refraction can be noted as:
r 4ne2N(t)
n = n0+n2I ^ . (2-9)
2meo)0
The effect of the plasma saturates self-focusing locally. The shrinking of the laser beam stops when
4ne2N (t)
»J= , T ■ (2-10)
In this case, the Kerr self-focusing effect balances the plasma induced defocusing effect. This balance leads to a confined minimum beam diameter and a limited peak intensity at the self-focal zone. This phenomenon now is known as intensity clamping [60, 61]. In air, an intensity of 4X 10¹³ W/cm2 was obtained by using the Eq. (2-10) for a laser pulse
with 100 fs pulse duration [60].
2.4 Spectral broadening and conical emission
Filamentation process is always accompanied by a strong spectral broadening which is contributed by self-phase modulation and the ionization of the propagation medium [5, 53]. Figure 2-5 shows a typical transverse pattern of a Ti-sapphire filamenting laser pulse.
Chapter 2 Physics of filamentation
Figure 2-5: Beam pattern of a 7 mJ, 800 nm, 45 fs free propagating laser beam at far field (after filamentation).
During filamentation, the temporal shape of the laser pulse is strongly reorganized [5, 53]. The temporal variation of the laser intensity induces a temporal variation in the index of refraction as
n = n0 + n2I(t). (2-11)
This in turn involves the appearance of new frequencies in the laser spectrum by modulation of the phase of the wave. The frequency shift can be noted as [62]
Au) _d <t > N L dt
dt{
o)0An(t)dt{
c co0z d[An(t)} c dt (2-12)This effect is termed as self-phase modulation (SPM). The generated new frequencies depend on the slope of the pulse, the propagation distance z in the Kerr medium and its nonlinear index coefficient «2.
Chapter 2 Physics of filamentation
The front part of the laser pulse always sees a neutral gas, i. e., no contribution from plasma. By introducing Eq. (2-1) into Eq. (2-12), the frequency shift in the front part of the pulse can be noted as [7]
coz dljfront part)
Aco = —°—n2 . (2-13)
c dt
Thus the self-phase modulation at the front part of the laser pulse generates redder frequencies because the front part of the pulse has a positive temporal slope, i. e.,
dI(front part)
dt >0,
The back part of the laser pulse will see both the neutral gas and the laser induced plasma since the medium is only partially ionized. So the nonlinear refractive index consists of two factors: Kerr effect and the laser induced plasma effect. By introducing Eq. (2-1), Eq. (2-6) and Eq. (2-7) into Eq. (2-12), the frequency shift in the back part of the pulse can be noted as [7]
co0z dl (back part) 2xze2 dNe ,_ , .,
Aco = ——n2 + - . (2-14)
c dt cmeû)0 dt
Generally, the free electron generation through MPI/TI could be approximated by [61]:
Nez N0w j lm( t ) d t , (2-15)
—ao
where No is the density of the neutral air, w is the effective empirical tunnel ionization rate of nitrogen (and oxygen), Im is the empirical power law of the ionization and m is
the empirical slope of the experimental ion yield versus intensity curve in the log-log scale [63]. Substituting Eq. (2-15) into Eq. (2-14), one obtains [7]
Chapter 2 Physics of filamentation
^ dliback part) + 2 j B e iN0w / m ( / ) ^
c dt cm„û)n
The first term in Eq. (2-16) gives the self-phase modulation induced frequency shift in the neutral, which indicates the generation of bluer frequencies due to the negative
dHJback part)
temporal slope at the back part of the laser pulse, i. e., < 0. In the real case, the presence of the plasma generated by the front part of the laser pulse will reshape the temporal profile in the back part of the laser pulse [5, 53]. So the intensity distribution at the back part of the pulse becomes very steep, which gives rise to a large blue shift of the frequency. The second term corresponds to the plasma contribution which also predicts a positive blue shift. Thus, self-phase modulation at the back part of the laser pulse provides large broadening towards the blue side of the pump frequency. The rainbow-like conical emission in Fig. 2-5 is due to self-phase modulation in the radial direction of the laser pulse [53]. The discussion on spectral broadening above is based on the assumption that the laser pulse has a plane wave. So we only considered the wave vector kz which is along the propagation axis z. For a laser pulse with a curved
wave front, the general wave vector k contains a transverse part of the wave vector kr
as well [7]:
k = kzz + krr = kz0z + Ak2z + kr0r + Akrr, (2-17)
where z and r are unit vectors parallel and orthogonal to the propagation direction z; kz0 and kr0 are the initial wave vectors along z and r , respectively. In the r
direction, the electron density gradient will give rise to the blue shift of the laser spectrum by [64] 15 d<f>NL ~ dN. dr dr ~ dN. dr
Chapter 2 Physics of filamentation
This radial electron density gradient varies continuously from zero to a maximum. The divergence of the general wave vector k will be larger when the electron density gradient is larger. Also, the larger the frequency shift is, the larger the divergence will be.
2.5 Self-spatial mode filtering
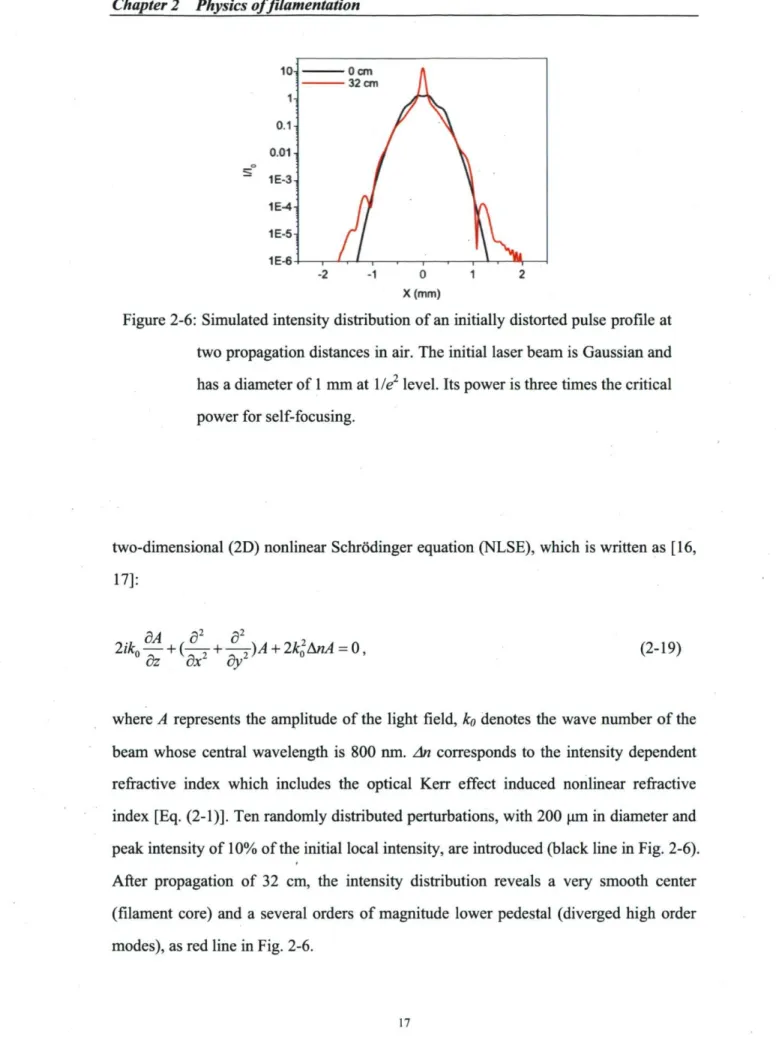
In any experimental cases, the transverse intensity and fluence distribution of a real laser pulse will never be perfect even though great efforts are made to favor the production of a fundamental mode. Essentially, any real pulse we are using nowadays is the superposition of a fundamental mode (with higher peak power and intensity) and other high order spatial modes (with much lower peak power and intensity). Since the peak intensity of the fundamental mode is higher than those of the other spatial modes, the fundamental mode will self-focus towards the propagation axis first and produces a fundamental mode profile at the self-focal zone; i.e. the filament core has high quality beam profile. Also, it will reach the clamped intensity earlier. This high intensity is high enough to tunnel/multiphoton ionize the air molecules and create a weak plasma at the self-focal zone. However the filament core will preserve the beam high quality because of the low plasma density (about 1016 cm"3 [65, 66]), three orders of magnitude lower
than the density of air. In fact, there is very little energy consumption for ionization [56] and the resulting homogeneous electron distribution would not disrupt the homogeneous intensity and fluence distribution of the fundamental mode at the self-focal zone. At the position where intensity clamping of the fundamental mode occurs, the higher order modes have diameters much larger than that of the fundamental mode and their self-focusing would be interrupted by plasma defocusing induced by the fundamental mode. Therefore, the intensity of the high order modes would be much lower. They would constitute part of the background reservoir and would not destroy the high quality of the filament core. Figure 2-6 shows the numerically simulated normalized intensity distribution across the diameter of an assumed CW beam propagating in air at two distances [16, 17]. The model used to describe the propagation is based on the
Chapter 2 Physics of filamentation
Figure 2-6: Simulated intensity distribution of an initially distorted pulse profile at two propagation distances in air. The initial laser beam is Gaussian and has a diameter of 1 mm at lie2 level. Its power is three times the critical
power for self-focusing.
two-dimensional (2D) nonlinear Schrôdinger equation (NLSE), which is written as [16, 17]:
2ik0^- + (-fT + ^I) A + 2k2AnA=0,
dz dx dy (2-19)
where A represents the amplitude of the light field, ko denotes the wave number of the beam whose central wavelength is 800 nm. An corresponds to the intensity dependent refractive index which includes the optical Kerr effect induced nonlinear refractive index [Eq. (2-1)]. Ten randomly distributed perturbations, with 200 um in diameter and peak intensity of 10% of the initial local intensity, are introduced (black line in Fig. 2-6). After propagation of 32 cm, the intensity distribution reveals a very smooth center (filament core) and a several orders of magnitude lower pedestal (diverged high order modes), as red line in Fig. 2-6.
Chapter 2 Physics of filamentation
In the filamentation process, only the fundamental mode of the pulse will self-focus to a smaller diameter than all the other high order modes and contribute to the high quality filament core, similar to the linear geometrical focusing of a laser beam with high order modes. But it is not possible to filter out the fundamental mode by using a pinhole at the focal point as in the case of linear geometrical focusing. Each self-focus in the filament comes from the self-focusing of a slice of the laser pulse. A pinhole placed at the focal position will block further propagation of the background reservoir, stopping further self-focusing [67]. Therefore, the only way to "filter out" the fundamental mode in the case of self-focusing of an intense laser pulse is to sample the filament core through a nonlinear process [14].
Chapter 3: Laser chain
The laser facility in our lab is a commercial Ti:sapphire laser system (Spectra Physics) based on chirped pulse amplification (CPA) technique. The CPA technique, invented by Gérard Mourou and Donna Strickland in 1980s [2], can amplify an ultrashort laser pulse by spectrally chirping the laser pulse which means temporally lengthening the laser pulse. Our laser system can simultaneously emit three intense femtosecond laser beams.
Layout
The schematic layout of the laser system is presented in Fig. 3-1. The system consists of a mode-locked Ti-sapphire oscillator (Tsunami, 40 fs at 74 MHz, 400 mW) which is pumped by a 532 nm laser (Millenia, continuous-wave, 4.2 W), followed by a stretcher and a regenerative amplifier which is pumped by a fraction (8 W) of output from a 527nm laser (Evolution 30, -150 ns at 1 kHz, 16 W) and works at 1 kHz repetition rate.
< Output 3; 10 Hz 75 mJ <50fs Vacuum :ompressoi
t
"
-l— — "**— " Telescope _ J 530 nm 1kHz 10 Hz 74 MHz — ■ — continuous - / / ■I
■-vr
4 pass amplifiert
6:33?
i. _ Quanta Ray 1 Quanta Ray 2 ..J
F
j 2 pass (amplifie: < -Output 2: 10 Hz 13 mJ 40 fs Portable compressor ■ / / • Output 1: 1 kHz 2 m J 40 fsT
Chapter 3 Laser chain
A two-pass amplifier pumped by the remaining energy from Evolution 30 enhances the output from the regenerative amplifier. The amplified beam is compressed to 40 fs and gives a maximum energy of 2 mJ/pulse at 1 kHz (Output 1). In the meanwhile, a pulse slicer after the regenerative amplifier picks up one pulse every 100 ms. This 10 Hz laser beam is evenly split into two beams which serve as the seed beams for a 10 Hz two-pass amplifier and a four-pass amplifier, respectively. A 532 nm laser (Quanta-Ray 1, 15 ns at 10 Hz, 1200 mJ/pulse) is split into 2 beams. One beam (500 mJ/pulse) is used as pump for the 10 Hz two-pass amplifier. The other beam (700 mJ/pulse), together with another 532 nm laser (Quanta-Ray 2, 15 ns at 10 Hz, 910 mJ/pulse), pumps the four-pass amplifier. The output pulses from the 10 Hz two-pass amplifier are compressed to 40 fs by a portable compressor, with energy of 13 mJ/pulse (Output 2). The output beam from the four-pass amplifier, after compression by a vacuum compressor, has a maximum energy of 75 mJ/pulse with pulse duration of 50 fs (Output 3). The typical spectrum of all three beams is centered around 800 nm with a spectral width of 32 nm (FWHM: full width at half maximum).
Spitfire (Spectra Physics)
The spitfire is a typical Ti:sapphire-based chirped-pulse amplifier which is composed by a Faraday isolator, a grating-based stretcher, a regenerative amplifier (regen), a two-pass amplifier and a grating-based compressor, as shown in Fig. 3-1. Before the invention of the CPA technique, the peak power of laser pulses was limited because laser pulses with high intensities damage the gain medium and the laser components inside the amplifier through Kerr self-focusing effect.
In the Spitfire, the seed from the oscillator first passes through the Faraday isolator to prevent back-reflected light from the amplifier system to return into the oscillator. Prior to introducing the seed into the regenerative amplifier, it is stretched out to about 200 ps (positively chirped) in time through chromatic dispersion by the grating in the stretcher.
Chapter 3 Laser chain To two-pass amplifier, - 1.5 W Pump'from Evolution 30 M5 Seed beam from stretcher
Figure 3-2: Schematics of the regenerative amplifier.
The regenerative amplifier is the core of the Spitfire, as detailed in Fig. 3-2. One of the stretched seed pulses is trapped inside the regen cavity by activating Pockel cell 1 (PCI) which works as a quarter waveplate after activation and changes the polarization of the seed from vertical to horizontal. This seed pulse is amplified each time when it passes through the gain medium (Ti:sapphire). After travelling about 16 round trips inside the regen cavity, the seed pulse reaches its maximum energy due to gain saturation of the Ti:sapphire crystal. The amplified seed pulse is extracted by activating Pockel Cell 2 (PC2) which works as a quarter waveplate and changes the polarization of the seed from horizontal to vertical. This vertically polarized seed is reflected out of the regen cavity by the polarizer. The power of this output beam is ~1.5 W. Then this extracted pulse is further amplified by a two-pass amplifier. After being compressed by the grating-based compressor, the pulse reaches a maximum energy of 2 mJ with pulse duration of 40 fs. This output has a repetition rate of 1 kHz.
10 Hz high power amplifiers
To achieve high pulse energy, 10 Hz high power amplifiers were built, as shown in Fig. 3-1. A pulse sheer is used just after the regenerative amplifier for extraction of a 10 Hz
Chapter 3 Laser chain
seed beam. Half of the seed is sent to a 10 Hz two-pass high power amplifier which amplifies this seed and delivers 13 mJ/pulse after compression. Another half of the seed works as the seed pulse for the 10 Hz four-pass high power amplifier which delivers the energy as high as 75 mJ/pulse after the vacuum compressor.
In these two high power amplifiers, the output energy is controlled by changing the energy of the input seed, realized by a combination of a half waveplate and a polarizer mounted in the input pathway of the seed.
Chapter 4: Evolution of a single filament in air*
4.1 Introduction
Filamentation has sparked considerable interest owing to its novel properties such as intensity clamping [68], self-spatial filtering [14, 16], self-stabilization [14, 16, 33] and self-steepening [8]. Efficient third harmonic generation and four-wave mixing due to self-group-phase locking inside a filament were observed [14, 16, 68]; the generation of high quality few-cycle pulses tunable from the UV [21] to the microwave becomes a possibility. Potential applications include remote pollutant detection [46], single-cycle pulse generation [39], lightning control [68], etc. These and other unforeseen possibilities constitute an emerging frontier called "filamentation nonlinear optics" [16]. The definition of a filament, however, is still puzzling. Liu et al. [69] found that multiple filamentation terminates prematurely due to diffraction by the plasma inside the filaments. Méchain et al. observed stable nonionizing channels extending over the distance of kilometers in air [70]. Ruiz et al. proposed the spontaneous generation of a filament without ionization in air due to soliton propagation for laser power lower than the collapse threshold [71]. The confusion is evident. What constitutes a filament?
In this chapter, we study the full evolution of a single filament in air both experimentally and numerically. It shows that filamentation consists of two ionizing sections, one with "efficient ionization" and the other, "weakly ionized" followed by the linear diffraction of a single fundamental mode pulse.
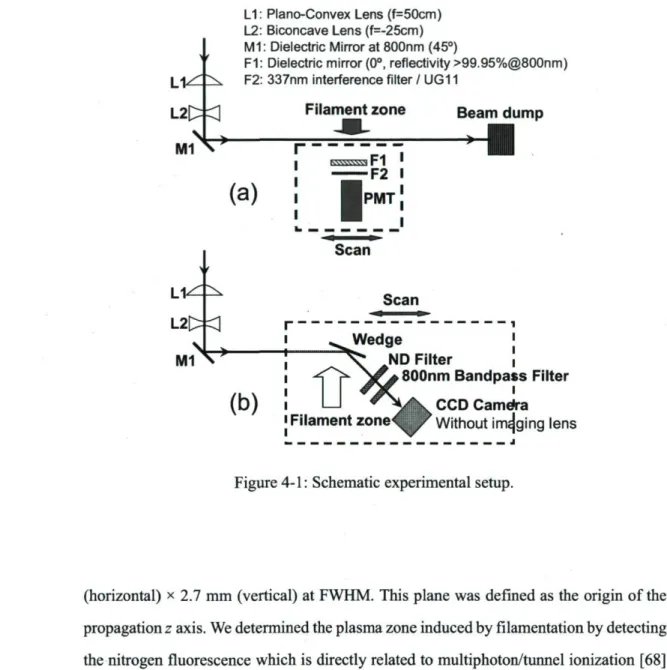
4.2 Experimental setup
Figure 4-1 shows the schematic experimental setup. A 10 Hz, 45 fs, 3.2 mJ, 800 nm Ti-sapphire laser beam was collimated by a telescope formed by a convex and a concave lens. The elliptical beam cross section at the exit plane of the telescope was 2.6 mm * The results presented in this chapter are based on the following article: Y. Chen, F. Théberge, O. Kosareva, N. Panov, V.P. Kandidov, S.L. Chin, "Evolution and termination of a femtosecond laser filament in air", Opt. Lett. 32, 3477 (2007).
Chapter 4 Evolution of a single filament in air
L 1 ^ ^ L 2 «
M1
LI: Piano-Convex Lens (f=50cm) L2: Biconcave Lens (f=-25cm) M1: Dielectric Mirror at 800nm (45°)
F t Dielectric mirror (0°, reflectivity >99.95%@800nm) F2: 337nm interference filter / UG11
Filament zone ft
(a)
L I ^ : ^L2C=<
ft-M1 ESSSSSO \ l F2 I | P M T | Scan Scan Beam dump—*-(b)
Filament zone Wedge .ND Filter > 800nm Bandpass Filter CCD CamefraWithout imaging lens
Figure 4-1 : Schematic experimental setup.
(horizontal) x 2.7 mm (vertical) at FWHM. This plane was defined as the origin of the propagation z axis. We determined the plasma zone induced by filamentation by detecting the nitrogen fluorescence which is directly related to multiphoton/tunnel ionization [68] with a photomultiplier tube (PMT) from the side along the filament [69], as Fig. 4-1 (a). A high reflectivity mirror at 800 nm and an interference filter at 337 nm were put in front of the PMT for measurement from z = 150 to 350 cm. Thereafter, the fluorescence signal became very weak; a bandpass filter (UG 11,2 mm thick, bandwidth of 200-400 nm) replaced the 337 nm filter. The UG11 filter transmits all the nitrogen fluorescence. The white light contamination is negligible because the spectral blue broadening in this experiment stops at 650 nm [inset of Fig. 4-2(a)]. We measured the background signal at z = 970 cm where there was no plasma. This value was subtracted from the weak
Chapter 4 Evolution of a single filament in air
fluorescence signal using the UG11 filter and then normalized to the 337 nm data. Later, a wedge was set inside the filament at a near grazing angle (-15°) to avoid damage, and a CCD camera measured the diameter of the reflected beam [Fig. 4-1(b)]. A bandpass filter centered at 800 ± 20 nm and neutral density (ND) filters were used in front of the CCD camera. The whole detection setup was installed on a breadboard, which could be translated parallel to the z axis.
4.3 Results and discussions
In the simulations, the system of Eqs. (6)—(13) of [72] corresponding to single filamentation is used.+ It includes diffraction, group-velocity dispersion, instantaneous
and delayed response of the Kerr nonlinearity, and plasma generation via multiphoton/tunnel ionization. The spatiotemporal integration domain consisted of 8192 grid points in time and 4096 grid points in the radial domain. The initial beam diameter was smaller (1.7 mm FWHM instead of 2.6 mm) so as to fit the earlier filament formation in the experiment caused mainly by the slightly convergent wavefront and imperfect beam shape, which are enhanced during the transmission of the laser pulse inside the glass telescope.
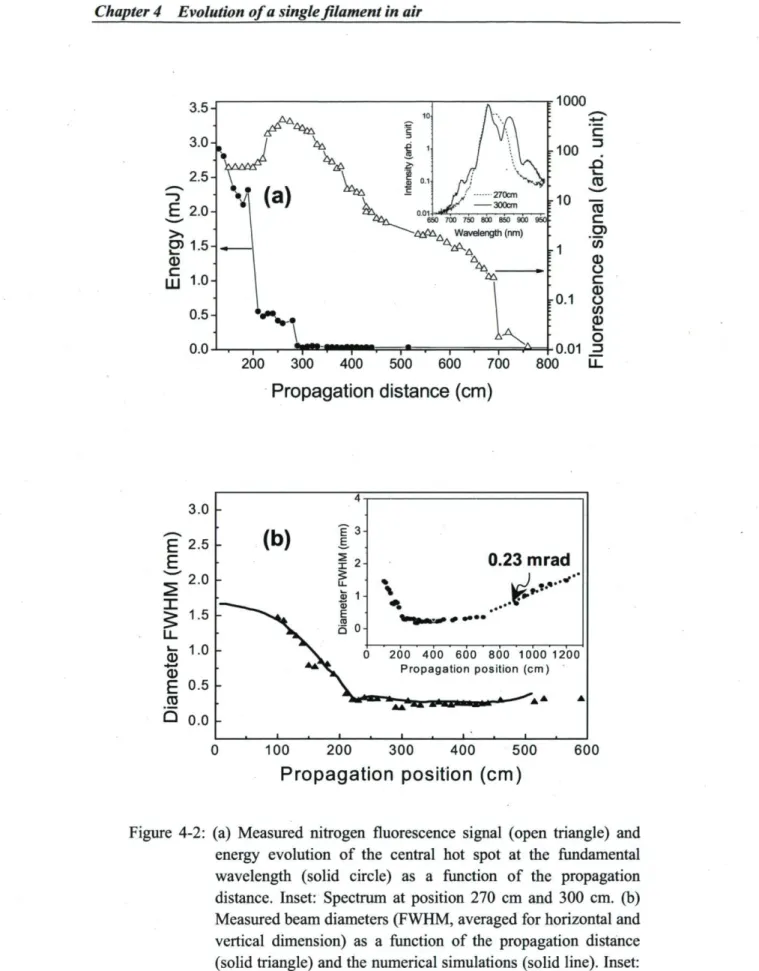
Figure 4-2(a) shows the fluorescence signal (log scale) and the energy evolution of the central hot spot at the fundamental wavelength as a function of z. The energy of the central hot spots taken by the calibrated CCD camera (Fig. 4-3) was obtained by integrating the fluence over the transverse area defined by lie2 level of the signal
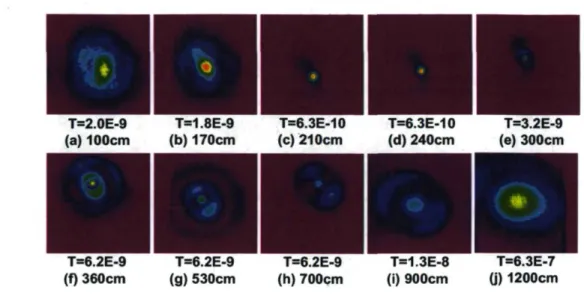
maximum. The integration area is either the whole beam profile [Figs. 4-3(a) and 3(b)] before the collapse at z « 200 cm, or just the central hot spot as soon as the filament is formed [from 210 to 280 cm, Figs. 4-3(c) and 3(d)]. At further distances, several diffraction rings around the central hot spot appeared [Figs. 4-3(f)-3(i)]; however the energy integration area still includes the hot spot only. Sharp decrease in the energy [Fig. 4-2(a)] from 100 to 190 cm is associated with the beam's self-contraction and filament
+ The simulation in this chapter was done by Olga Kosareva and Nikolay Panov in M. V. Lomonosov Moscow State University.
Chapter 4 Evolution of a single filament in air 3.5 3.0 2.5 E^2.0-OÎ 1.5 CD LU 1 0 0.5 0.0 < / %
w'(a)
4A 2$ %'"V
\ * ■ f ^ ^ F 1000 r100 c JZ\ I — CO - 1 0 - = 7 X 750 800 850 900 950-/ W & A Wavelength (nm) " A A^V. ■A MK,
*&• -0.1 0.01 200 300 400 500 600 700Propagation distance (cm)
800 CD c g) 'to CD Oc
CD O CO o zz 4 n 3.0 4 n "E 2.5F
-
(b)
? 3-EÏ2-
0.23 mrad
J 2.0
LL » 1-«5 E â o-V c cn 1 U » 1-«5 E â o-V c 200 400 600 800 1000 1200 0 * « Propagation position (cm) £ 0.5 • i i CDb 0.0
• i i ■ i i i i i ■ 100 200 300 400 500Propagation position (cm)
600Figure 4-2: (a) Measured nitrogen fluorescence signal (open triangle) and energy evolution of the central hot spot at the fundamental wavelength (solid circle) as a function of the propagation distance. Inset: Spectrum at position 270 cm and 300 cm. (b) Measured beam diameters (FWHM, averaged for horizontal and vertical dimension) as a function of the propagation distance (solid triangle) and the numerical simulations (solid line). Inset: Divergence of a nonlinear propagated beam (with filament,
Chapter 4 Evolution of a single filament in air T=2.0E-9 (a) 100cm T=1.8E-9 (b) 170cm T=6.3E-10 (c) 210cm T=6.3E-10 (d) 240cm T=3.2E-9 (e) 300cm T=6.2E-9 (f) 360cm T=6.2E-9 (g) 530cm T=6.2E-9 (h) 700cm T=1.3E-8 (i) 900cm T=6.3E-7 U) 1200cm
Figure 4-3: Some typical pictures taken by CCD camera along the propagation axis. T is the transmission of the beam before reaching the CCD.
formation. The latter is confirmed by a steep rise of the fluorescence signal within the region of 190-210 cm. From 280 to 300 cm in Fig. 4-2(a), there is a sudden drop in energy because it corresponds to the beginning of the significant spectral broadening [inset of Fig. 4-2(a)]. This white light is blocked by the 800 nm bandpass filter. The fluctuation of some data points [filled circles in Fig. 4-2(a)] in the energy could be due to the laser energy fluctuation. Between 210 to 280 cm, the energy of the collapsed central hot spot was -475 uJ showing little tendency to decrease. Its peak power is -10.6 GW assuming 45 fs pulse duration, while in reality, it should be higher, considering self-compression of the pulse. This peak power is still above the measured critical power for self-focusing of 8-10 GW in air [73]. The fluorescence signal underwent a strong decrease by 2 orders of magnitude from 250 to 450 cm, followed by a decrease by 1 order of magnitude from 450 to 690 cm. From 690 to 700 cm, the signal dropped sharply and fluctuated at noise level thereafter.
The evolution of the beam diameter (FWHM of the fluence distribution) is shown in Fig. 4-2(b). A sharp decrease until -190 cm is followed by the slower one. The minimum of
Chapter 4 Evolution of a single filament in air
0.18 mm is reached at -300 cm. The beam diverges very slowly from a diameter of 0.25 to 0.37 mm at 450 cm< z < 700 cm. This is the zone where the fluorescence (ionization) is weak [Fig. 4-2(a)].
In the simulations, the calculated diameter of the filament [Fig. 4-2(b), solid curve] is in good agreement with the experimental data. To compare with the fluorescence signal which is roughly proportional to the electron density, we first follow the peak power of the whole pulse regardless of pulse splitting [Fig. 4-4(a)]. The peak power is compared with the critical power Pc r for self-focusing for a Gaussian beam given by
3 11 A2
Pcr = —'■ in SI units [54]. As suggested in [74], we use the effective value n ^ o f
^m0n2 e f f
the nonlinear Kerr coefficient to fit the experimentally measured critical power o f - 1 0 GW [73].
At 200 cm< z <300 cm, the leading subpulse (peak power s 3Pcr) dominates [Fig. 4-4(b),
z = 252 cm] and the core energy is -520 uJ, close to the experimental value of 475 uJ. For z>300 cm the leading subpulse depletes, the trailing subpulse sustains the core energy, and the intermediate part diverges strongly due to the plasma left behind by the leading subpulse [Fig. 4-4(b), z = 308 cm and z = 510 cm]. As a result, the core energy decreases, while the peak power still exceeds the Pcr. The calculated peak intensity in the region of
200-450 cm is clamped to - 5 * 1013 W/cm2 [68], and the peak electron density is ~0.3x 10"4
of the atmospheric density. The filament is represented by the "efficiently ionized" zone untill z « 450 cm [Fig. 4-4(a)]. The region 450 cm< z <620 cm is characterized by the preservation of the peak power above Pc r but dominated by the trailing subpulse. The
leading subpulse would no longer produce a plasma. In this case, the integrated electron density falls down an order of magnitude within 20 cm (440-460 cm). This decrease in electron density is similar to the decrease in fluorescence in Fig. 4-2(a). We call the filament in this region "weakly ionized". It is important to note that the defocusing effect by plasma in this zone, the dispersion and the diffraction are still able to dynamically interplay with the self-focusing effect to sustain a self-guided column [75]. Later on, by
Chapter 4 Evolution of a single filament in air 200 400 600 Propagation distance, cm z = 0 cm z = 252 cm z = 308 cm z = 510 cm - M i m A11111 | TpW^TT.TiiTTTT!. n 11 >»■ iVÎ> i % |
-60 -40 -20 0 20 40 60 z = 620 cm 60 -40 -20 0 20 40 60
Time, fs
Figure 4-4: (a) Linear electron density (filled squares) and power in the most intense slice (solid curve) as a function of the propagation distance. Horizontal line shows Ppeai/Pcr = 1. Dashed zone represents the
weakly-ionized filament. Note non-monotonic power behavior at pulse splitting position z « 300 cm. (b) Curves with filled pattern are on-axis temporal intensity profiles at z = 252 cm, z = 510 cm, z = 620 cm, solid curve in each plot (not filled) indicates initial distribution of a Gaussian pulse. Curve, marked by squares, shows pulse splitting at z=308 cm. Note change in the intensity scale for the plots at each propagation distance.
Chapter 4 Evolution of a single filament in air
z » 700 cm, material dispersion and diffraction overcome self-focusing [Fig. 4-4(b), z=620 cm] and ionization becomes negligible.
During filamentation, the initial pulse undergoes self-spatial filtering [14, 33] [Fig. 4-3(c)-3(h)]. The central part of the beam stays round throughout the filament zone (200-700 cm) and is always surrounded by the reservoir. After the filament zone, the laser pulse propagates linearly with a divergence of 0.23 mrad (FWHM) between 900 and 1200 cm [inset of Fig. 4-2(b)]. Our simulation yields 0.26 mrad.
We can now understand the observation of Méchain et al. [70]. The so-called "nonionizing channels" at long distances might very well be the local self-spatially filtered fundamental modes of various hot zones that diverge out slowly after the end of the plasma filament.
4.4 Conclusion
In conclusion, the evolution of the so-called single filamentation can be defined as follows: pulse contraction in the quasi-stationary regime (and self-spatial filtering) —» efficiently ionized filament dominated by the leading subpulse -> weakly ionized filament dominated by the trailing subpulse —► linear diffraction of the self-filtered fundamental mode.
Chapter 5: Filamentation-induced continuous
self-frequency down shift in air*
5.1 Introduction
Now it is known that a filament is a long ionization column with clamped intensity (around 5X10¹³ W/cm2 in air) and a diameter of-100 um over a propagation distance
much longer than the Rayleigh range. Therefore, any interaction by sampling this filament core results in high conversion efficiency (owing to high intensity inside the filament core), high stability (due to intensity clamping inside the filament core) and high spatial quality (thanks to spatial self-filtering of the pulse during filamentation) [14, 16, 68]. Several interesting experimental observations on third-order nonlinear interactions during filamentation in air, such as self-phase modulation (continuum generation), four-wave mixing [14, 21] and third-harmonic generation [22, 23], have already been reported. All these nonlinear processes during filamentation in bulk media such as air are very similar to those that occur in optical waveguides/fibers, since both of them provide a self-guided intense light column that is important for inducing efficient nonlinear interactions.
Continuous Raman self-frequency shift after the propagation of an intense pulse in an optical waveguide/fiber has already been extensively studied during the past several decades [76-78]. Physically, this can be understood by a combined action of self-phase modulation due to the optical Kerr effect and stimulated Raman scattering during the propagation of an intense ultra-short laser pulse inside a waveguide/fiber [79]. In the case of filamentation in air, spectral broadening towards infrared (IR) components has also been studied in the past several years [34, 80-82]. For example, Nibbering et al. observed red shift in spectra after filamentation in air, which is a consequence of molecular response to impulsive excitation of rotational coherences [80]. Bernstein et al. * The results presented in this chapter are based on the following article: Y. Chen, F. Théberge, C. Marceau, H. Xu, N. Akôzbek, O. Kosareva, S.L. Chin, "Observation of filamentation-induced continuous self-frequency down shift in air", Appl. Phys. 5 91, 219 (2008).
Chapter 5 Filamentation-induced continuous self-frequency down shift in air also observed spectral red-shift and its continuous red shift when increasing the input pulse energy [81]. However, all of the previous works investigated the spectral characteristics at a certain distance after the filamentation has terminated. To our knowledge, there is no paper reporting the spectral characteristics of the pulse propagating inside the filament zone. In this paper, we studied the spectral evolution inside the filament zone of a near IR femtosecond laser propagating in air. We observed that red-shifted spectral components will continuously self-frequency down shift with respect to the propagation distance when the pulse propagated in the filament zone, with its spectral envelope almost untouched. This will provide a new and cost-effective way in the generation of tunable IR pulses with good spatial beam quality.
5.2 Experimental setup
In our experiment, a 10 Hz, 800 nm, 50 fs Ti-sapphire laser beam was focused by a plano-convex lens. The beam diameter at the input plane of the convex lens was 4 mm (FWHM). This plane was defined as the origin of the propagation z axis. The schematic experimental setup is shown in Fig. 5-1. A wedge was set inside the filament core at a near grazing angle (roughly 15°) to avoid damage and directed the laser beam into an
On the rail for changing position
ïïinr"
Filament zone
I;:;::;;;);::;;; ■Integration sphere
Spectrometer
Figure 5-1: Schematic experimental setup.
Chapter 5 Filamentation-induced continuous self-frequency down shift in air integration sphere which was coupled with a liquid nitrogen-cooled spectrometer by a bundle of multimode optical fibers. The whole detection setup was installed on a breadboard which could be translated at different positions parallel to the z axis to measure the spectral evolution of the laser pulse. Three convex lenses with different focal lengths (1.5 m, 3 m and 4 m) were used for comparison. Due to the finite size of the lab, two plane gold coated mirrors were used to fold the beam for propagation distance above 600 cm. As this distance was longer than the focal length, the mirrors were not damaged.
5.3 Results and discussions
Figure 5-2(a) shows the spectral evolution of the laser pulse propagating in air, focused by a 3 m focal length lens, for input energy ranging from 0.35 mJ to 3.8 mJ.
0.35 m j / \
700 800 900 1000
Wavelength (nm)
700 800 900 1000
Wavelength (nm)
Figure 5-2: (a) Spectral evolution as a function of laser energy, focused by 3 m lens, measured at distance of 370 cm; (b) Spectral evolution as a function of laser energy, focused by 1.5 m lens, measured at distance of 320 cm. The dotted line is centered at 800nm.
Chapter 5 Filamentation-induced continuous self-frequency down shift in air The measurement was carried out at the propagation distance of 370 cm, around the end of the filament (2 mJ). Compared with the spectrum obtained at 0.35 mJ (whose power is smaller than the critical power, 10 GW, for self-focusing in air [73]), the spectrum of the pulse red-shifts a little at the energy of 0.7 mJ, splits into two peaks at the energy of 1.0 ml and into three peaks at higher energies. Figure 5-2(b) shows the spectral evolution with a shorter 1.5 m focal length lens for input energy ranging from 0.35 mJ to 5.8 mJ. The spectra were taken at the propagation distance of 320 cm, beyond the filament. No obvious spectral splitting of the pulse can be observed except for a slight red-shift of the central wavelength with the increase of the input pulse energy.
Figure 5-3(a) displays the spectral evolution when measuring the spectrum along z, with pulse energy of 2.4 mJ focused by the 3 m lens. Two new IR peaks started to appear inside the filament zone (around z=300 cm). They continuously shifted to longer wavelength when z increased. We now follow the continuous wavelength shift of the dominant new IR peak. The wavelength shift as a function of z is shown in Figure 5-3(b) (squares). A strong red-shift (roughly from 800 nm to 865 nm) occurred during propagation inside the filament zone and saturated around 865 nm for propagation beyond the filament zone. The conversion efficiency, defined as the ratio of the resolved dominant new IR peak over the whole spectrum through integration in frequency scale, is about 22%. Figure 5-3(b) also shows the wavelength shift with input pulse energies of 1.0 mJ (circles) and 3.6 mJ (triangles). The wavelength shift for 1.0 mJ is about 35 nm, and 100 nm for 3.6 mJ. By comparing the three curves in Fig. 5-3(b), we can conclude that, at higher pulse energies (3.6 mJ), the self-frequency down shift starts earlier (around 260 cm) because filamentation begins at shorter z, which results in a longer self-guided column. In this case, the wavelength shift is more pronounced (about 100 nm). Figure 5-3(c) shows the spectral evolution when the laser pulses were focused by 4 m lens with pulse energy of 2.4 mJ. And the corresponding wavelength shifts are displayed in Fig. 5-3(d). Compared to the situation with 3 m lens, the red-shift is stronger (about 100 nm for 2.1 mJ and 130 nm for 3.6 mJ). This is due to a longer filament (self-guided column) generated in the case of 4 m lens. It is important to note
Chapter 5 Filamentation-induced continuous self-frequency down shift in air 700 750 800 850 900
Wavelength (nm)
940 ^ 9 2 0£
S
9 0 01)880
c 0> 860 O CD 8 4 0(b)
J
t
**7S *
8 0 0 > A -—•—1.0 mJ 2.4 mJ 3.6 mJ 600 900 1200 300Distance (cm)
700 750 800 850 900 950Wavelength (nm)
940 920E
c 900 880-c 860-O CD > CD ^ 820-I 840- 800-—•—1.0mJ -■-2.1 mJ — A - 3.6 mJ 300 600 900 1200Distance (cm)
Figure 5-3: Spectral evolution as a function of propagation distance (a) at the pulse energy of 2.4 mJ focused by 3 m lens and (c) at the pulse energy of 2.1 mJ focused by 4 m lens; Wavelength shift as a function of propagation distance (b) with 3 m lens at the pulse energy of 1.0 mJ (circles), 2.4 mJ (squares) and 3.6 mJ (triangles); (d) with 4 m lens at the pulse energy of 1.0 ml (circles), 2.1 mJ (squares) and 3.6 mJ (triangles).
Chapter 5 Filamentation-induced continuous self-frequency down shift in air that the transmission of the laser pulse through the lens did not affect the current observations since by using reflective concave mirror we observed similar IR spectral shift.
In order to further investigate the underlying physical mechanism of the generation of the red-shifted new IR peaks, experiments were carried out in a 4.5 m chamber filled with either air (Raman active) or Argon (non Raman). Figure 5-4 shows the schematic experimental setup. The 4.5 m chamber was put in the pathway of the filament zone which was formed by a 2.75 mm (FWHM) collimated beam with pulse energy of 3.2 mJ. To avoid the generation of white light in the windows of the chamber, a small hole was made on both the input and the output window. In Figure 5-5, we present the measured spectrum of the pulse at the output of a gas chamber first filled with air (Raman-active medium, solid line) and then with Argon (non-Raman-active medium, purity -90%, dashed line). It is important to note that, in intensity clamping of filaments in air, the ionization of O2 contributes more to the overall ionization of air [60]. Therefore, the clamped intensity reached in air is lower than in Argon since the ionization potential of
L 1 ^ ^
L2£tt
800nm Input
4.5m
Filament zone is inside the chamber
Wedge
/Xlntegration sphere
Spectrometer Figure 5-4: Schematic experimental setup with a 4.5-m-long chamber filled
with air or Argon.
Chapter S Filamentation-induced continuous self-frequency down shift in air
40 -,
c
ZJ -Qc
0
30-
20-
10-Air
Argon
700 750 800 850 900 950
Wavelength (nm)
Figure 5-5: Comparison of spectra formed by filamentation in air (solid line) and in Argon (dash line).
O2 (12.1 eV) is lower than that of Argon (15.6 eV). Thus, we expect more pronounced spectral broadening during the filamentation in Argon if the Raman response were not a reason. However, a pronounced new IR peak as shown in Figure 5-5 was observed during the filamentation in air and no IR peak was observed when the chamber was filled with Argon gas. Therefore, the generation of the separated new IR peaks is due to the contribution of the Raman effect. The red-enhanced spectral shift similar to those measured here has been attributed to a purely rotational Raman process [80, 83]. The first Stokes shift due to rotational effect from N2 (12 cm"1) and O2 (8.4 cm"1)
corresponds approximately to a wavelength shift of 1.5 nm and 1.1 nm, respectively. These Stokes shifts are much smaller than the initial spectral bandwidth of the laser pulse, and thus, we cannot resolve them. During filamentation, cascaded Stokes shift [79] occurred and the generated IR pulse continuously shifted towards longer wavelength. Because the spectral bandwidth of the newly generated IR pulse is much wider than the first Stokes shift due to rotational effects from N2 and O2, the