1
Analysis of Longitudinal Data for Selection and Management
N. Gengler
1,2and P. Mayeres
21
National Fund for Scientific Research, B-1000 Brussels, Belgium
2Animal Science Unit, Gembloux Agricultural University, B-5030 Gembloux, Belgium
Abstract
Until recently the description of dynamic biological processes was done using static models even if those biological processes such as lactation or growth provided us with longitudinal data. A classical example was the use of lactational milk yields even if individual test-days describing the underlying lactation curves were available. Similarly for growth, weights were corrected phenotypically to fit into categories like weaning or yearling weights. Several recent developments stimulated the research on alternative methods describing the evolution of the mean and the variances of continuos dynamic biological processes. These developments were especially the extension of repeatability models towards random regressions and the development of the (co)variance function approach, but the development of better computers allowing the storage and the processing of a huge quantity of data. Despite this the analysis of certain types of longitudinal data as test-day yields in large populations and/or international settings is still a major challenge. But a very important aspect of the analysis of longitudinal data is often forgotten: they give us other information than the one classically extracted from genetic evaluation systems. In fact, the detailed modeling of dynamic biological processes provides opportunities for the development of advanced management tools. This may have a large influence on the way genetic evaluation systems may evolve in the future, making them integrated systems for the management and selection of animals.
Introduction
A lot of biological processes provide naturally longitudinal data (e.g. depending on time: age, lactation stage) but until recently only static models were used because this dynamic aspect was considered more a nuisance than a natural feature that deserves modeling. Foe example daily milk yields were aggregated into lactation yields and weights were standardized to a certain age or transformed into traits as weight gains. On the other hand recent advances in the field of analysis of longitudinal data have been enormous and therefore the way people think about modeling such data have dramatically. We will focus in this paper on milk production as a typical example and our objective is to put forward how current and future developments in modeling of longitudinal data will interact with selection and management purposes. Milk recording reports that are transmitted to breeders are generally limited to already performed yield and estimated breeding values. Considering the general situation of animal production, extending the use of the milk recording results is highly desirable. This desire has been generally evolving independently from the development of genetic evaluation systems and we will show that there is a big potential to achieve co-evolution of both.
Current use of longitudinal data for management: example milk yield
The dynamic, time dependent aspect of longitudinal data is generally eliminated by trivial methods as the
computation of a weighted average or a sum or by adjusting to standard time (age). t Important is that one stays strictly on a phenotypic level and generally raw values are transmitted to farmers. History methods are the Test Interval (TIM) and Centering Date Methods (CDM). Recently alternative methods were developed to replace TIM and CDM. An interesting example is the multiple trait prediction (MTP) method by Schaeffer and Jamrozik (1996) that combines a priori information with observed test-day yields The Best prediction (BP) method proposed by VanRaden (1997) uses multiple regression techniques to obtain estimates for the yields at non-observed test-days. One characteristic is that the assumed variance structures regressed the unknown test-days and computed the lactation yield as the sum of unregressed known and regressed unknown test-days. In reality this methods does therefore only interpolate the missing test-days. The question if observed test-days should also be regressed could be considered nearly a philosophical one. However it should be noticed that other methods such as MTP do assumes this and regresses also known test-days towards the expected values.
Use of test day models for management
Contrary to 305-d lactation models, which consider that all effects (e.g. contemporary group) are the same during the entire lactation, test day models (TDM) allow for variation during lactation by accounting for the effects at the day of test.
Numerous advantages of this approach were given in the literature (Swalve et al, 2000). However one advantage often neglected and seldom developed is
2 the possibility to use test day model results for herd management purposes. Results from milk recording transmitted to breeders are still limited to simple reports of the performed yields (milk, fat, protein and eventually somatic cell score and/or urea) of the last test together with cumulative records. Additionally estimated breeding values (EBV) are also reported. With test day data, a lot of additional information is available. However, geneticist are mostly thinking of reporting EBV for new traits as persistency, longevity or rate of maturity. However interest of milk producers is broader. Interest in breeding values, especially on the cow side, may be rather low, however other results are computed but have then to be communicated to the farmer. Furthermore recording organizations must justify the costs for milk recording.
Several potential additional informations can be extracted on a cow/or herd level but we will focus here on another point the potential ability of TDM to predict future test day yields. These results were already shown by Mayeres et al. (2002). The predicted values can then be used in different ways. First this values can be compared with the real values measured at the farm by using advanced decision making theory (e.g., Kalman Filter, Van Bebber et al, 1999). Then out of the prediction for a given day of a given cow, a prediction for a larger time period could be developed that would permit management decisions on an individual and/or herd level. Historically this purpose is somewhat linked to the estimation of lactation yields using TIM or CDM methods TDM should be a clear improvement over those old methods as they should model optimally the mean and variance structures among known test days, e.g. accounting for cow specific lactation curves. Predictions would then be obtained directly from the solutions. As long as we are interested into deviations of animals from mean yields this should work well but fixed effects and especially contemporary group definition may be more problematic. Since early days of test day model research (Ptak and Schaeffer, 1993) use of a herd-test date fixed effect (HTD) was considered optimal as it allows theoretically unbiased comparison of animals because of the theoretically unbiased estimation of contemporary groups yield levels. Therefore most TDM contemporary groups are based on this effects. One might however identify and especially in the context of prediction of future yields, different shortcomings. First future HTD can not simply be predicted because this effect does not model any time or seasonal trends. Secondly, current definition of HTD is not very robust against low number of animals in contemporary groups. Especially with seasonal calvings, even large herds may have from time to time very few animals that just freshened or were not yet dry.
Materials and Methods
Data
Data were extracted by the VIT (Vereinnigte Informationssysteme Tierhaltung Germany) who manages Luxembourgish data and contained 499524 first lactation test day records (between days in milk 4 and 330) for milk, fat and protein yields from 58881 Holstein and Red and White cows. The pedigree file contained 106896 animals.
Model 1
The precorrected data set was then introduced in the following random regression model (RRM):
e
p)
Za
Q(Wh
Xb
y
c=
+
+
+
+
where b vector of HTD fixed effects, h vector of common herd period of calving environmental random regression coefficients, a vector of genetic random regression coefficients, p vector of permanent environmental random regression coefficients, e vector of residual effects, X, W, Z are incidence matrices, Q is the covariate matrix for the second order Legendre polynomials. This model is very close to the classical RRM used currently except for the common herd environmental effect. This effect was introduced as preliminary research showed that its introduction improved consistency of heritabilities and genetic correlations during the lactation as parts of the formerly genetic (co)variances were considered environmental (Rabier, 2002). The common herd effect was defined inside 5 periods of calving of 2 years (<1992/04/01, 1992/04/01-1994/03/31, 1994/04/01-1996/03/31, 1996/04/01-1998/03/31, >1998/03/31).
Study of fixed HTD solutions
HTD solutions obtained from Model 1 were studied. At population level means were computed for every month across all the herds and years.
Model 2
If predictability of future tests is a major issue, replacing the fixed HTD effect by alternative fixed effects spanning over several test days with an additional HTD random effect could be a promising modification. The prediction of a given herd mean at a given test day would then simply be the sum of solutions of the new fixed effects. Therefore an alternative model was defined:
e
p)
Za
Q(Wh
Xb
t
T
Um
y
c=
+
+
+
+
+
+
where m vector of herd test month period (HTMp) fixed effects, t vector of herd test year (HTY) fixed effect, b vector of herd test day random effects (HTDr), U, T, X, are incidence matrix, all the other symbols stay the same.
3 In order to allow stable predictions for current test years, the HTY effect spanned the two last years. The HTMp effect was defined inside time periods of four, respectively five years for newer years allowing for major changes inside a herd over the years.
Comparison of solutions from Model 1 and Model 2.
Possible bias in rankings due to the use of Model 2 were studied by comparing breeding values for lactation yields obtained by integration of the Legendre polynomials for each animal from 0 to 305 days in milk. Comparison of fixed effect solutions from Model 2 (HTY + HYMp) with fixed HTD solutions from Model 1 allowed to access the potential for predictability of herd test day mean effects.
Variance components
The variance components used in this study were based on those computed by Rabier (Rabier, 2002) using subsamples of the same data, Model 1 EM-REML. For Model 1 and Model 2 the same variance components were used, only for Model 2, error variance was artificially subdivided into two parts, a part considered linked to HTDr and a part considered being the reduced error variance. The 1/1 ratio was chosen for this preliminary study.
Results and Discussion
Analysis of the HTD effects from Model 1
HTD solution showed a large dispersion. This underlines the large differences among herds. Figure 1 gives the evolution of monthly HTD solutions for milk. -3 -2 -1 0 1 2 3 1/90 1/91 1/92 1/93 1/94 1/95 1/96 1/97 1/98 1/99 Date H T D m e a n d e v ia ti o n ( k g )
Figure 1: Evolution of the monthly HTD milk solutions across time.
Two trends are visible in these HTD solutions. First overall production is progressing over time. Secondly, over time monthly HTD means show very similar patterns within year, where the maximum corresponds generally to pastern release and the minimum to the month of November.
Comparison of solutions from Model 1 and Model 2.
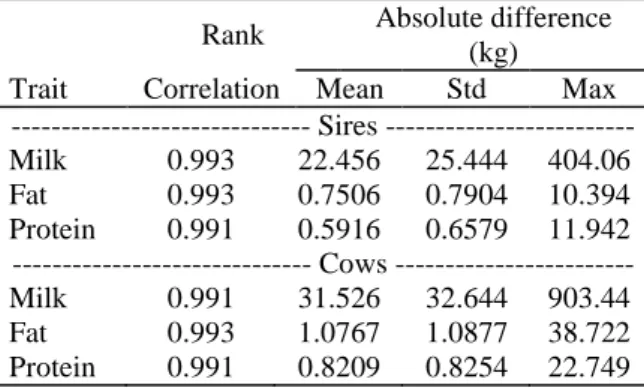
The comparisons of EBVs from both models showed that the new modeling proposition lead to few rerankings. Table 1 gives the Spearman rank correlation for all the cows in the pedigree file. Values were consistently over 0.99. Table 1 gives also the distribution parameters of the absolute difference and this for milk, fat and protein yields Table 1: Comparison of 305 day lactation EBVs from both models.
Rank Absolute difference (kg) Trait Correlation Mean Std Max --- Sires --- Milk 0.993 22.456 25.444 404.06 Fat 0.993 0.7506 0.7904 10.394 Protein 0.991 0.5916 0.6579 11.942 --- Cows --- Milk 0.991 31.526 32.644 903.44 Fat 0.993 1.0767 1.0877 38.722 Protein 0.991 0.8209 0.8254 22.749 Figure 2 and 3 show the frequency distribution of the absolute difference for milk for the sires and for the cows (cows with records and female ancestors) in the pedigree file. 0 ,0 0 0 ,1 0 0 ,2 0 0 ,3 0 0 ,4 0 0 1 0 2 0 3 0 4 0 A b s o lu te d iffe r e n c e (x 1 0 k g )
Figure 2: Frequency distribution of the absolute EBV differences for sires.
0 . 0 0 0 . 1 0 0 . 2 0 0 . 3 0 0 . 4 0 0 1 0 2 0 3 0 4 0 A b s o l u t e d i f f e r e n c e ( x 1 0 k g ) F re q u e n c y
Figure 3: Frequency distribution of the absolute EBV differences for cows.
Rerankings were surprisingly rare showing that potential bias in rankings is limited.
4 Table 2: Comparison of HTY + HTMp from Model 2 with HTD from Model 1.
Absolute difference Trait Correlation Mean Std Max
Milk 0.918 1.00 0.91 17.6
Fat 0.919 0.046 0.042 0.87
Protein 0.919 0.037 0.032 0.49 Table 2 gives details about the comparison of the absolute difference between the contemporary group solution defined as (HTY + HTMp) and HTD. Absolute differences were generally very small with some exceptions.
The highest difference, 17.6, occurred for a test date in which only one test day yield was recorded (Figure 4). In such a situation the fixed HTD solution from Model 1 makes anyway not much sense.
Table 2 gives also the Pearson correlations comparing solutions from HTY + HTMp (Model 2) with those from HTD (Model 1). Results here showed that prediction of HTD results from the sum of HTY + HTMp solutions would have been possible. As shown in Figure 4 most larger differences that were observed are simply due to the fact that original HTD classes were small.
0 2 4 6 8 1 0 1 2 0 2 4 6 8 1 0 1 2 1 4 1 6 1 8 2 0 A b s o lu t e d if f e r e n c e ( 0 .1 k g c la s s ) N u m b e r o f H T D r e c o rd s
Figure 4: Dispersion diagram plotting the mean number of HTD records within 0.1 kg classes of absolute difference for milk yields.
Conclusions
Additional research will be needed as we reported only for first lactation yields and we did bnot reestimated (co)variance components. However the present results are highly encouraging. The alternative modeling of fixed effects to increase their usefulness for daily herd management can be done inexpensively and give very interesting results. The expected bias in the EBVs was extremely small and nearly no reranking occurred. Differences between fixed HTD effects and new HTY + HTMp effects were generally small and were mostly due to the small size of some HTD classes. Obviously one might doubt on the usefulness of very small HTD classes.
The introduction of the new model allows a better predicting of the herd mean performances over time. This is somewhat unusual thinking, because genetic
evaluation systems are setup actually in a way to try to predict only unbiased EBVs. However in the future alternative use of results from genetic evaluation systems will become an important issue. Especially the possibility to model the data in a correct manner and to obtain jointly estimates of environmental and genetic effects having the desired (BLUE and BLUP) properties. Progress in this field is very important in order to justify the rising costs of present and future milk recording schemes.
Implications for the Future
Analysis of longitudinal data could provide optimal results for use in selection and management. Contrary to current praxis where management and selection are totally separated in a rather near future one might imagine integrated systems allowing optimal use of statistical methods, computing power and resources. In general this could “re-conciliate” farmers with and give the evolution genetic evaluation systems a new direction.
Acknowledgments
Nicolas Gengler who is Chercheur qualifié of the FNRS (Brussels, Belgium) acknowledges his financial support. The authors gratefully acknowledge the financial support of the Luxembourgish Herdbook Federation, a breeders cooperative.
References
Mayeres, P. Stoll; J., Reents R; and Gengler N. 2002. Alternative modeling of fixed effects in test day models to increase their usefulness for management decisions. INTERBULL Bull. 29:
http://www-interbull.slu.se/bulletins/bulletin29/Mayeres.pdf.
Rabier, F. 2002 personal communication
Schaeffer, L.R. and Jamrozik, J. 1996. Multiple-Trait Prediction of lactation yields for dairy cows . J.Dairy Sci. 79:2044-2055
Swalve, H.H. 2000. Theoretical basis and computational method for different test-day genetic evaluation methods. J.Dairy Sci. 83:1115-1124
Ptak, E. and Schaeffer L.R. 1993. Use of test day yields for genetic evaluation of dairy sires and cows. Livest. Prod. Sci. 34:23-34
Van Bebber, J., Reinsch, N., Junge, W. and Kalm E. 1999. Monitoring daily milk yields with a recursive test day repeatability model (Kalman Filter). J.Dairy Sci. 82:2421-2429
VanRaden, P. 1997. Lactation yields and accuracies Computed from test day yields and (co)variances by best prediction . J.Dairy Sci. 80:3015-3022