HAL Id: hal-02475333
https://hal.archives-ouvertes.fr/hal-02475333
Submitted on 9 Feb 2021HAL is a multi-disciplinary open access archive for the deposit and dissemination of sci-entific research documents, whether they are pub-lished or not. The documents may come from teaching and research institutions in France or abroad, or from public or private research centers.
L’archive ouverte pluridisciplinaire HAL, est destinée au dépôt et à la diffusion de documents scientifiques de niveau recherche, publiés ou non, émanant des établissements d’enseignement et de recherche français ou étrangers, des laboratoires publics ou privés.
Two-scale study of the fracture of an aluminum foam by
X-ray tomography and finite element modeling
Clémence Petit, Éric Maire, Sylvain Meille, Jérôme Adrien
To cite this version:
Clémence Petit, Éric Maire, Sylvain Meille, Jérôme Adrien. Two-scale study of the fracture of an aluminum foam by X-ray tomography and finite element modeling. Materials and Design, Elsevier, 2017, 120, pp.117-127. �10.1016/j.matdes.2017.02.009�. �hal-02475333�
Two-scale study of the fracture of an aluminum foam by X-ray tomography and finite
element modeling
Clémence Petit1, Eric Maire1*, Sylvain Meille1, Jérôme Adrien1
1 Université de Lyon, INSA de Lyon, MATEIS, CNRS UMR5510, F-69621 Villeurbanne, France
* Corresponding author: eric.maire@insa-lyon.fr, phone: +33 (0) 4 72 43 88 61
Abstract
An aluminum foam can be characterized by its architecture and by the solid phase’ microstructure. Our aim is to link the foam’s morphological and microstructural features with its mechanical properties thanks to X-ray tomography and finite element (FE). An approach combining X-ray tomography at different resolutions, image processing, and FE modeling was developed to take into account the influence of the intermetallics on the foam’s fracture. First, the samples were scanned with "local" tomography, where the specimen is placed close to the X-ray source. These images allowed for observing intermetallics. Then an in situ tensile test was performed in the tomograph to follow the sample’s deformation at low resolution. The images obtained from local tomography were processed to create one low-resolution image of the initial sample including details from high resolution. This was done by a series of thresholding and scaling of the high-resolution images. This image was used to generate a FE mesh. A FE input file was obtained thanks to Java programs associating the elements to the phases. At the local scale, the calculated stress distribution and the images of the struts were analysed. Our work confirms that the presence of inclusions can explain the fracture of struts.
Highlights
- Iron-rich inclusions were identified in an aluminum foam in high-resolution images obtained with local tomography.
- A tensile test followed by X-ray tomography showed that struts fracture mainly occurred in inclusions-rich regions.
- The finite element model taking into account the inclusions was based on image processing of the high-resolution images.
- The model with the inclusions resulted in local stress concentrations explaining the early fracture of some struts.
1. Introduction
Cellular metals have received more and more attention due to their unique combination of properties (i.e., lightness, shock and sound absorption) [1]. Aluminum cellular samples are particularly of interest due to the low weight and low melting point of aluminum alloys. Among them, Duocel® foam is an open-cell aluminum sample made of 6101 alloy. The relation between the architecture of this foam and its mechanical behavior was extensively studied in the literature [2, 3, 4, 5]. However only few studies [6, 7, 8] focused on the influence of the microstructural features of the solid phase on the mechanical properties of such foams. In the case of 6xxx Al alloys, the presence of Fe-rich intermetallic inclusions [7, 8] is known to possibly have an influence on the macroscopic behavior of porous aluminum foams. As an example, in situ tensile tests with scanning electron microscope (SEM) showed a brittle intergranular rupture in the struts containing Fe-rich precipitates [6].
non-destructive technique which provides 3D visualization and enables a 3D characterization of a sample. The architectural parameters (e.g., relative density, distribution of pores size) can be determined with 3D images having resolutions of few microns. The deformation of the samples can also be followed with this technique through in situ mechanical tests [12]. Moreover, the 3D images can be meshed to build finite element (FE) models [11, 13, 14, 15]. Recently, 3D microstructural characterization at a higher resolution was made possible using the so-called "local tomography" mode [16, 17]. In this mode, the sample is placed near the X-ray source and a high-resolution image of the irradiated part of the sample is obtained. These high-resolution images can be analysed to characterize the mechanical behavior of the samples, especially the initiation and the propagation of cracks [16]. This approach has been developed initially for the study of the tensile fracture of Duocel foams. The authors noticed the link between the presence of inclusions and the fracture of the slightly loaded struts [17].
The aim of this paper is to refine this first approach by building a FE model including the microstructural features of the Duocel foams obtained from local tomography. Our work is based on the use of X-ray tomography at two scales, i.e., at two resolutions. A Duocel foam was characterized thanks to local tomography, enabling to observe the Fe-rich inclusions. Then an
in situ tensile test was performed in the tomograph. Compression test is often chosen for
metallic foam to study the capacity of these samples to absorb energy [1, 2, 5]. But, the fracture behavior of these materials is also of interest. In this work, a tensile test was chosen to follow the progressive fracture of the foam and to make the link with its microstructural features. During the test, the sample was scanned at a low resolution. Finally, the high-resolution images obtained from local tomography were processed to create a FE model at low resolution, including the presence of the inclusions in the calculation. The comparison between high and low-resolution 3D images finally shows that the struts’ fracture mainly occurs in the inclusion-rich regions. The stress fields calculated by FE taking into account the inclusions enable us to
explain the fracture of some struts in which no architectural feature was found.
2. Material and methods
2.1. Material
The Duocel foam considered in this study is an open-cell aluminum foam kindly provided by ERG Aerospace (Oakland, CA, USA). Its composition, as determined by inductively coupled plasma atomic emission spectroscopy by Zhou et al. [18], is presented in Table 1. The Duocel foams are fabricated by investment casting as described in detail in [19]. An open-cell polyurethane foam is first infiltrated by a ceramic slurry. After heat treatment, a porous ceramic having the negative shape of the polyurethane foam is obtained. Then the pores of the ceramic are infiltrated by liquid aluminum. After removal of the ceramic by pressurized water, a porous metallic sample is obtained and is a replication of the initial polyurethane foam. After fabrication, the Duocel foams were heat treated by ERG with a T6 strengthening heat treatment: the samples were first heat treated at a temperature of 527°C for 8 hours and then quenched in water at room temperature. Finally, they were aged at 177°C during 5 hours.
Al Mg Si Fe Cu Zn B Mn Others
99.3 0.2-0.29 0.2-0.25 0.1-0.14 0.03 0.01 0.03 0.01 - Table 1: Chemical composition of the Duocel foam (wt %) [18]
A square prism shaped sample (thickness: 4.1 mm, width: 9.6 mm, and height: 22 mm, dimensions referred hereafter as in directions 1, 2 and 3 respectively) was cut from a foam block. The thickness was the thickness of the initial foam block. The width and the length were imposed by the tensile loading device, which will be described in the next section. The entire approach developed in this paper, from the in situ testing to the FE modeling was applied to this sample, used for illustration in the paper. This is due to the difficulty to reproduce this time-consuming approach for a large number of samples. Therefore, our goal was to develop a
qualitative approach to determine the influence of artificial defects on the macroscopic behavior of scaffolds.
2.2. Characterization by X-ray tomography
A laboratory X-ray tomograph (Phoenix vTomeX / X ray, Germany) located in the MATEIS lab, described in detail in [12] was used. It operated at a voltage of 80 kV and an intensity of 280 µA with no filtering on incident X-rays. The spot size of the source was approximately 1 µm in these conditions. The detector (Varian Paxscan) has an active surface of 200 x 250 mm with a matrix of 1920 x 1536 pixels (pixel size 127*127 µm2). Each scan was performed with the following conditions: 900 projections, scan timing of 333 ms for each angular position. The distance from X-ray tube to the detector is 577 mm. The 3D final images were reconstructed thanks to a standard filtered back projection algorithm implemented in the software coupled to the tomograph [20]. Firstly, the whole sample was scanned at a low resolution (20 µm per voxel). In this configuration, the X-ray tube/object distance was 90.8 mm. Then high-resolution 3D images (voxel size of 3 µm) were obtained thanks to local tomography. In that experiment, the sample was placed near the ray source and only a part of the sample was irradiated by X-rays under all the viewing angles. The X-ray tube/object distance was then 13.6 mm. Some authors proved that high quality images can be obtained in this mode when the sample is homogeneous outside of the field of view of the detector [13, 16]. It was observed that the images reconstructed by local tomography have a lower signal to noise ratio than in conventional tomography. However, due to their low density, porous samples are particularly adapted to local tomography [17].After the high-resolution scan of the irradiated part of the sample, it was necessary to physically displace the specimen on the rotating stage to scan another part of the sample. Finally, 18 3D images, each representing a different region of the sample were acquired to have a full description of the sample at high resolution.
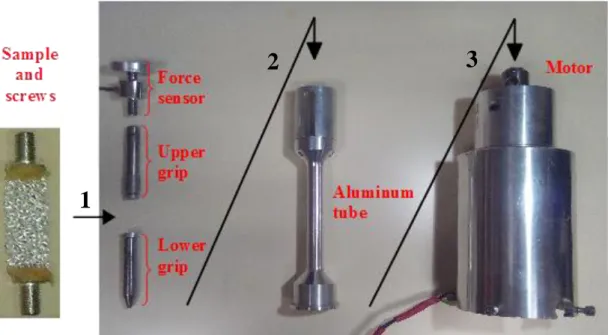
After the initial characterization, the sample underwent an in situ tensile test in the tomograph. For this purpose, a custom-made device described in [17] was inserted on the rotating stage. This device is shown in Fig. 1 as unmounted. First, the sample was glued to two screws, the alignment of the screws was maintained thanks to a device designed for this purpose. Then, the sample was screwed to two grips (Fig. 1, arrow 1). The upper grip was attached to a force sensor. The set {force sensor, grips and sample} was placed into an aluminum tube (Fig. 1, arrow 2). This tube has an inner diameter of 15 mm and a thickness of 1 mm. It does not affect the reconstruction because it is almost transparent to the X-rays. The inner diameter of the tube imposed to have a sample’s width lower than 10 mm. Then, the aluminum tube containing the set {force sensor, grips, and sample} was attached to the driving axis of the motor (Fig. 1, arrow 3). Finally, the assembly was placed onto the rotating stage in the tomograph. The length of the sample was imposed by the entire length of the device to scan the entire sample. A uniaxial tensile test was applied: the vertical displacement of the lower grip was applied by the motor via a custom-made software with a speed of 0.01 mm.s-1. The displacement of the upper grip was totally constrained. The reaction force was measured as a function of time by the force sensor and recorded by the software. The test was interrupted fifteen times to scan the sample at different applied strains with the same voltage and intensity as for the initial characterization and using a voxel size of 20 µm (referred to hereafter as "low-resolution"). The mean applied strain at different loading steps was determined from the displacement obtained from the comparison of the images of initial and deformed states. It was calculated relatively to the total height of the initial sample. Between two interruptions to scan the sample, the linear applied displacement varied between 0.13 and 0.4 mm (i.e., between 7 and 20 voxels with a voxel size of 20 µm). This corresponds to incremental strains between 0.6% and 1.8 %. To calculate the mean engineering stress, the applied force was simply divided by the initial section of the sample. The logarithmic differential method was used to calculate the uncertainties on the
stress, taking into account an uncertainty of 2 N for the force and 0.05 mm for the sample’s dimensions.
Fig. 1: Loading device used to load the sample (the arrows indicate the different steps to mount the device)
To complete the characterization of the microstructure by X-ray tomography, some struts of aluminum foam were scanned with another tomograph operating at higher resolution (Easy Tom
Nano, RX Solutions, France, equipped with a Hamamatsu X-ray tube and a Hamamatsu
detector). In this case, different struts were cut from a foam block and scanned. Higher resolution images of these particular struts with a voxel size of 0.4 μm were obtained without using local tomography. The scans were made using a voltage of 60 kV and an intensity of 150 µA.
2.3. Image processing steps
As previously mentioned, the 18 high-resolution 3D images of the initial sample were acquired and then processed with the ImageJ software [21]. ImageJ is a public domain, open-source Java-based software for image processing and analysis and is extensible via plugins and macros.
1
2
3
Image processing steps described below were performed on reconstructed volumes. First, the quality of each volume was improved by the adjustment of contrast and brightness and by the application of median filtering over neighbours of two voxels. Fig. 2a shows a slice of a high-resolution 3D image after treatment. Next, two thresholding operations separated the three different phases: voids, aluminum matrix and intermetallic inclusions (see Fig. 2b). At this stage, it could have been possible to stitch the 18 volumes together to obtain a high-resolution 3D image of the whole sample. However, the result would have been a large volume which could not be easily used for analysis and FE modeling. Instead, each thresholded image was down-scaled to change its voxel size from 3 to 20 µm. The segmentation made at high resolution was preserved after scaling as shown in Fig. 2c. However, scaling blurred the images by spreading out the grey levels around the initial value especially at the interface between the phases. Thus, a second thresholding was made using a conservative value of the grey level to make sure that no inclusion was lost during this step (Fig. 2d). The 18 initial high-resolution 3D images (Fig. 2a) were transformed into 18 low-resolution thresholded 3D images. Finally, these tomograms were stitched together until the image of the whole sample was created. It must be clearly stated that the second thresholding step results in a non-physical increase of the size, thus of the volume fraction of intermetallics (see Fig. 2b and 2d). For this reason, the final 3D image should be considered as "containing the information" of the presence of the inclusions in different locations inside the sample, rather than actually describing their morphology in detail.
(a) (b)
(c) (d)
Fig. 2: (a) Slice of a local tomography 3D image of a part of the foam (voxel size: 3 µm): pores in dark grey, aluminum in medium grey and inclusions in light grey, (b) the same slice after thresholding into three different phases (voxel size: 3 µm): pores in black (grey level of 0), aluminum in white (grey level of 255) and inclusions in grey (grey level of 128), (c) the slice after scaling (voxel size: 20 µm): pores in black, aluminum in white and inclusions with a gradient of grey and (d) the down-scaled slice after the second thresholding (voxel size: 20 µm)
2.4. Image analysis
The final 3D image of the initial sample (Fig. 2d) was used to quantify the sample’s architecture using Java programs implemented in ImageJ software. Three parameters were calculated to characterize the scale of the architecture: the relative density and its variation in the sample, the pore size distribution and the strut size distribution. For highly porous materials, 3D data are needed to obtain a complete characterization. The principle of these quantifications is described in [22]. We give here below a brief summary of this procedure.
The relative density was determined as the ratio of the number of voxels belonging to the solid phase (i.e., white voxels in the thresholded 3D images) as compared to the number of voxels in
the entire volume. Moreover, the local variations of density in the sample are given by plots of the relative density in each slice as a function of the slice position in a given direction. Three plots are obtained, each corresponding to one direction. For comparison, the geometric relative density of the sample was also determined from the weight and the dimensions of the samples, considering a density of 2.7 g.cm-3 for the fully dense aluminum alloy. The uncertainty on this measurement was calculated considering the uncertainties in the measurements of the scale and of the caliper.
The reconstructed volume was also used to measure the characteristic size distribution of each phase (i.e., solid and voids). The method used in this work can be considered as a virtual granulometry technique and is comparable to sieving of a powder [22]. It consists in the application of a sequence of three-dimensional erosion and dilation operations to the phase of interest. The sequence is repeated with increasing size of the structural element, spherical in the present study. A histogram was obtained giving the amount of the phase as a function of the structural element size. This operation was applied to the voids and the solid phase to obtain the pore size and the strut size distributions. Because the sample is an open-cell foam, the characteristic size of the solid phase is described in terms of strut size. We also applied this technique to the 3D images of single struts (voxel size of 0.4 μm) to measure the inclusion size distribution.
2.5. Building of the FE model
First, the solid phase (i.e., intermetallics and aluminum) was meshed using Avizo 8 software with 1 228 000 tetrahedral elements having an average edge size of 76 µm. Because the goal of this study was to take into account the inclusions on the fracture properties, the calculation was performed with the finest mesh which could be used in relation with the computer capacity (Dell, Intel Xeon, RAM 100 Go). That is why no specific convergence study was performed in
this work, dedicated to the comparison of calculations including or not the presence of inclusions. To mesh the volume, the first step consisted of the generation of a surface meshing. A triangulated closed surface separating the volume from the voids was obtained thanks to a marching cube algorithm [23] implemented in Avizo [24]. After different steps of optimization of the triangulated surface, the three-dimensional mesh was created by the advancing front method implemented in Avizo [25]. The 3D mesh generated by Avizo was made of tetrahedra with four nodes (at each corner).
Then, the Avizo generated mesh had to be transformed into an input file readable by Abaqus. The presence of the intermetallics in the solid phase had to be taken into account in the model. For this purpose, a special Java program was developed to create an Abaqus input file. This procedure is similar to what was done in [26] to model a fatigue test of a stainless steel hollow sphere structure by associating each shell element of a mesh to the local thickness of the hollow spheres. The Java program first calculated the barycentre coordinates of each tetrahedral element of the mesh. Then it associated each element to the grey level located at its barycentre as indicated in the tomographic image. As the grey level represented a specific phase (i.e., 128 for inclusions and 255 for aluminum), each element was associated to a phase. Therefore in the Abaqus input file, two element sets were defined: one for elements corresponding to the aluminum phase and the other for elements corresponding to the inclusions or to a zone containing inclusions. Some inclusions could be larger than 76 µm, the size of the elements. Some elements could be then associated to an inclusion whereas they correspond to a zone containing inclusions and aluminum matrix. Each element set was subsequently associated to one of the two material behaviors described in the following section. A second calculation was performed as a reference neglecting the presence of the inclusions: for this, all the elements were considered as having the constitutive law of the aluminum matrix.
all the information required. The element type used was first-order tetrahedral element with linear interpolation. For this type of element, the degrees of freedom are the translations. They are fully integrated elements (i.e., there is one point of integration). The FE analysis, performed with Abaqus/Explicit, was a dynamic and nonlinear analysis due to the nonlinearity of the material constitutive law (see section 2.6). The total volume of the sample tested experimentally was meshed and used for the calculation. To reproduce the experimental conditions in the FE model, a positive displacement equivalent to the vertical displacement reached during the in
situ test was applied to the nodes on the top surface of the sample. On the bottom face, the nodes
were totally constrained. The stress was calculated making the sum of the reaction forces at each node of the top face divided by the section of the sample. The strain was calculated dividing the displacement of the top face by the total height of the initial sample. The presence of the glue in the experimental device was not taken into account in the modeling because the zone of interest (i.e., where the fracture occurred) is far from the sample’s borders.
2.6. Material constitutive laws defined in the FE model
For the aluminum matrix, an elasto-plastic behavior was considered and was identified from the work of Zhou et al. [27] (Fig. 3). The main mechanical properties were a Young's modulus of 70 GPa, a Poisson's ratio of 0.3, a yield strength of 192.5 MPa and an ultimate tensile strength of 205.3 MPa.
Fig. 3: Engineering stress/engineering strain curve of the 6101 aluminum alloy used to model the aluminum phase in the FE model (plot built from data from [27])
The damage behavior of the sample was modelled using the "Metal porous plasticity" model from Abaqus material library. This behaviour is based on Gurson-Tvegaard-Needleman (GTN) model [28, 29]. For ductile materials, the damage mechanism is linked to the nucleation, growth and coalescence of voids. The Von Mises yield condition Φ is thus modified by the introduction of a variable defining the volume fraction of pores. Gurson [28] proposed a yield condition which was later modified by Tvegaard and Needleman [29] (equation (1)):
𝛷 = (𝜎𝑒𝑞 𝜎𝑦) 2 + 2 𝑞1𝑓𝑐𝑜𝑠ℎ (−3 2 𝑞2 2 𝑝 𝜎𝑦) − 1 − 𝑞3𝑓 2 = 0 (1)
where σeq is the Von Mises equivalent stress, p is the hydrostatic stress, σy is the yield stress of the fully dense material, f is the volume fraction of pores in the materials and q1, q2 and q3 are fitting parameters. f is generally considered as lower than 0.1 in Abaqus [30]. The values generally reported in the literature for metallic alloys for q1, q2 and q3 are 1.5, 1 and 2.25 respectively (q3 = q12) [31].
The model implemented in Abaqus assumes that nucleation rate increases with plastic strain rate following equation (2) proposed by Chu et al. [32]:
where ḟ is the nucleation rate, 𝜀̇pleq is the plastic strain rate, and A is a proportionality coefficient which follows the normal distribution given by the equation (3):
𝐴 = 𝑓𝑁 √2𝜋 𝑠𝑁 exp [− 1 2 ( 𝜀𝑝𝑙−𝑠𝑁 𝑠𝑁 )] (3) where εN is the mean value of the normal distribution, sN is the standard deviation of the normal distribution, and fN is the volume fraction of nucleated voids. The following values are generally reported in the literature for metallic alloys: εN = 0.3, sN = 0.1 and fN = 0.04 [30, 33].
No data were found in the literature to describe the mechanical behavior of the elements containing inclusions. Nanoindentation was therefore performed in several inclusions to estimate the Young's modulus of the inclusions, using a G200 apparatus (Agilent Technologies,
USA) equipped with a Berkovich tip. A series of 10 indents was made with a speed of 10 nm.s- 1, a dwell time of 10 s and a maximum penetration depth of 300 nm. The Young's modulus was determined thanks to the Oliver-Phar method [34]. Before the measurements, the precise location of the tip was calibrated by indenting a fused silica reference sample. This depth was chosen to characterize only the inclusions (having a size between 20 and 120 μm). A Young's modulus of 160 GPa was determined and used in the FE model. An elasto-plastic constitutive law obtained from the one of the aluminum phase (Fig. 3) was assumed. The values of stresses were arbitrarly multiplied by 1.5 and the values of strains were divided by 1.5 to obtain a slightly stronger and less ductile behavior than the one of aluminum. For the damage behavior, the same values of the criterion were used for the aluminum phase and the inclusions.
In this simulation, two materials models were defined: one for the aluminium matrix and one for the inclusions. The interfaces between the two phases were assumed to be perfect.
3. Results
3.1. Architecture of the sample
cells are made of struts connected by nodes. The elongation of the cell in a preferred direction during processing is also visible.
Fig. 4: 3D image of a cell of a Duocel foam, the red arrow indicates the direction of the elongation of the cell
The sample is characterized by a geometric density of 0.090 ± 0.004. Fig. 5 presents the variation of relative density along the three directions obtained by 3D image analysis. The relative density in each direction is 0.07 ± 0.02, which is a bit lower than the measured apparent density. The difference can be related to the modifications of the image caused by the resolution of the images. During thresholding, some voxels at the interface between the phases can be assigned to the air whereas they belong to the solid phase or inversely. An error on few voxels leads to a larger error on the measurement of the volume fraction of a phase, especially for the thinnest struts [35]. The variations of relative density are similar along the three directions, highlighting a random distribution of pores in the sample.
Fig. 5: Relative density in slice profiles along the three main directions of the sample obtained from tomographic image analysis
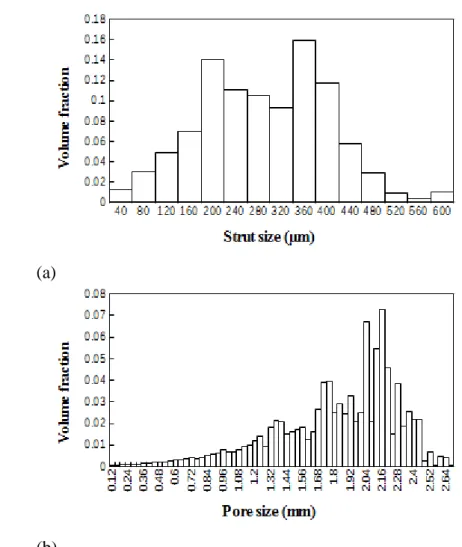
Struts and pores size distributions as determined by the granulometry technique are presented in Fig. 6a and 6b. The struts have a size between 100 and 500 µm with two main peaks around 200 µm and 360 µm generally associated to struts and nodes between struts respectively. The pore size ranges between 500 µm and 2.5 mm with the highest peak at 2.16 mm.
(a)
(b)
Fig. 6: (a) Strut size and (b) pore size distributions measured by the granulometry technique applied respectively to the solid phase and the voids of the thresholded 3D image
3.2. Characterization of the solid phase
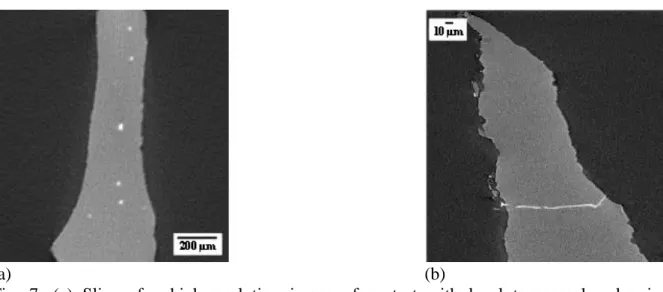
Local tomography images with a voxel size of 3 µm enable to reveal the presence of Fe-rich rounded inclusions in the matrix as found in the literature (see Fig. 7a). The strong contrast between the inclusions and the aluminum matrix indicates that the inclusions contain at least one element heavier than aluminum. Fig. 7b presents a slice of a higher resolution 3D image (voxel size of 0.4 µm) obtained on a single strut. Elongated particles are also present in the sample in the same quantity as the rounded ones. These latter ones have been already observed along the grain boundaries in ERG aluminum foams [6, 27].
(a) (b)
Fig. 7: (a) Slice of a high-resolution image of a strut with local tomography showing intermetallic inclusions (voxel size of 3 µm) and (b) higher resolution image (voxel size of 0.4 µm) showing an elongated inclusion
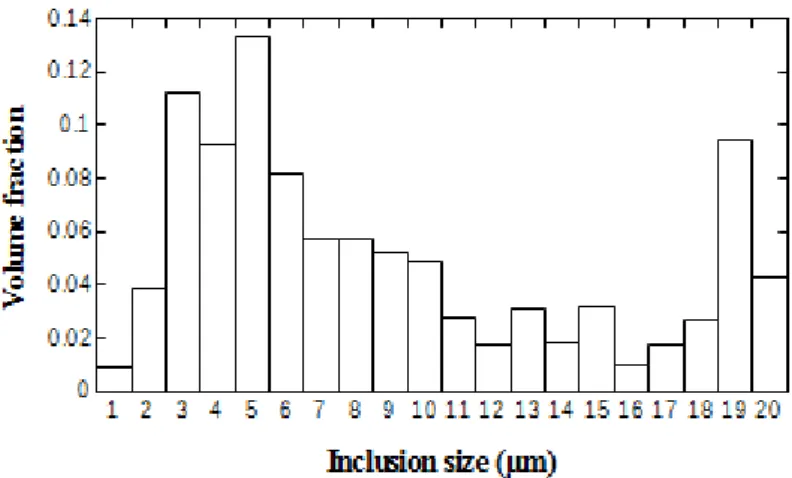
The inclusion size distribution (Fig. 8) determined with the highest resolution images of single struts (Fig. 7b) is between 10 and 160 μm. This distribution is explained by the different shapes of the inclusions. Observation of the tomographic slices (Fig. 7) proves that the rounded inclusions have a size of around tens of microns and the elongated ones have a length of hundreds of microns and a thickness of less than 10 μm. The volume fraction of inclusions in a single strut is 0.06 ± 0.02 %. The value was calculated from four high-resolution 3D images of single struts. The standard deviation is high because the number, shape and size of inclusions are variable from one strut to another.
Fig. 8: Inclusion size distribution measured by the granulometry technique on the 3D image of single struts
3.3. In situ tensile test
The sample was tested in uniaxial tension along the direction 3, parallel to the cell elongation. The mechanical properties of the sample as determined from the stress/strain curves are the following ones: Young’s modulus of 135 MPa, and ultimate tensile strength of 1.54 MPa. The experimental values of Young's modulus and tensile strength are in the range of those obtained in the literature. The experimental tensile stress/strain curve of the sample is given in Fig. 9: each point of the curve represents a strain at which the test was stopped to perform a scan. Error bars represent the uncertainties on the engineering stress calculated from the uncertainties on the load measurement. It is typical of a porous metallic sample with an elastic part followed by a plastic domain. Once the ultimate tensile strength is reached, the stress gradually decreases, due to the progressive rupture of the struts which reduces the effective number of struts carrying the load.
Fig. 9: Tensile engineering stress/engineering strain curve of the sample (error bars represent the uncertainties in the load measurement)
Fig. 10a to 10c present a part of the sample at increasing applied strain during the tensile test. The images show the progressive alignment of the struts in the tensile direction (direction 3, see the black arrows in Fig. 10) and the progressive fracture of struts with increasing applied strain. The comparison of the images of the deformed sample and of the initial sample at high resolution enables to check the presence of inclusion in the broken struts. The broken struts were found by manual inspection of the 3D images of the deformed sample. It was found that 20 out of the 25 broken struts contained an inclusion located in the fracture path. It is not possible to treat in detail the 25 broken struts. Therefore, it was decided to focus on four broken struts, which are pointed out by red rectangles in Fig. 10.
(a) (b)
(c)
Fig. 10: 3D image of the sample during the in situ test (voxel size of 20 µm): (a) at initial state, with no applied strain, (b) at an applied strain of 4.4 % and (c) at an applied strain of 5.7 %. The black arrows point out one strut which undergoes a progressive alignment in the tensile direction.
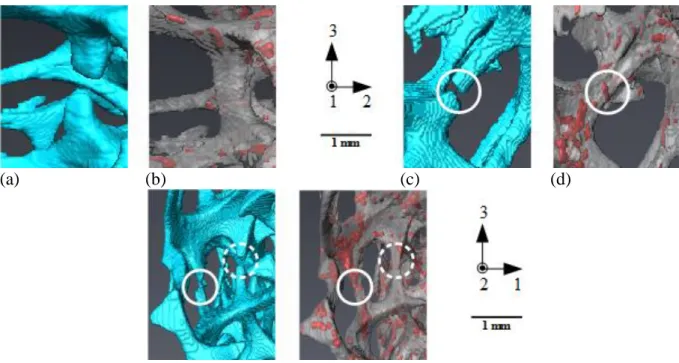
These four broken struts are presented in Fig. 11. Fig. 11a and 11b show one of the first struts to break (Fig. 11a) in which no inclusion can be detected (Fig. 11b). In this case, the favourable orientation of the strut is responsible for its early fracture. The three struts shown in Fig. 11c (one strut) and 11e (two struts) also broke at the beginning of the tests. However, they were all inclined relatively to the loading direction. These fractures are therefore difficult to link with architectural features. In the three cases, the corresponding high-resolution 3D images (Fig. 11d and 11f) show the presence of inclusions at the location of the fracture of the struts. In Fig. 11c and 11d, the strut broke at one of its extremity and not in its thinnest section. At the exact
fracture location, an inclusion is present along the strut thickness (see the white circles in the images). In Fig. 11e and 11f, a big inclusion runs along the upper part of the strut on the left side and is present in the whole strut thickness. The strut rupture occurred where the inclusion was slightly less thick (see the white circles in the images). The strut on the right side broke at the location of a small inclusion which is not centred relatively to the strut thickness (see the white dotted circles in the images). In the three latter cases, these inclusions then appear to be clearly responsible for the fracture of the struts.
(a) (b) (c) (d)
(e) (f)
Fig. 11: (a, c, e) Magnified views of different broken struts localized by red rectangles in Fig. 10b and 10c (voxel size of the images: 20 µm): these struts fractured at an applied strain of 4.4% (a, e) and 5.7 % (b), (b, d, f) same struts from the image of the initial sample (voxel size of 20 µm, obtained thanks to the image processing from local tomography described in section 2.4) showing the inclusions in red: (b) no inclusion is present in the broken strut and (d, f) inclusions are present in the struts, at the fracture location. In Fig. 11c, 11d, 11e and 11f, circles represent the zones where the struts broke.
Fig. 12 reports the experimental and the two numerical stress/strain curves considering or not the presence of the inclusions. The calculated stress/strain curve with aluminum only reproduces well the shape of the experimental curve. This means that the elasto-plastic behavior and the Gurson-Needleman-Tvegaard model seem to be adapted to the Duocel foam behavior. The calculated Young's modulus (266 MPa) is overestimated in comparison with the experimental one (134 MPa). This overestimation has already been observed with FE modeling of cellular materials [26, 36, 37] and will be discussed in the next section. An experimental point around a strain of 1% would have been interesting as a supplementary information to compare the experimental and calculated curves. The calculated curve determined from the FE model with the inclusions has the same general shape as for the calculation with pure aluminum alloy but it is shifted to higher stresses. The Young's modulus of this curve (305 MPa) is slightly higher than the one obtained with the previous calculation.
Fig. 12: Experimental and calculated stress/strain curves: the curve "FE - Only aluminum phase" refers to the FE calculation which takes into account only the aluminum phase and the curve "FE - Aluminum & inclusions" refers to the FE calculation including the intermetallic inclusions
Fig. 13 presents the calculation of the stress field (normal stress in the loading direction) in the struts shown in Fig. 11a, 11c and 11e. Fig. 13a and 13b correspond to the strut shown in Fig.
11a whereas Fig. 13c and 13d correspond to the strut shown in Fig. 11c. For the strut shown in Fig. 11a, the FE calculation without inclusions (Fig. 13a) confirms that this strut broke mainly due to its alignment in the loading direction. The calculation taking into account the inclusions (Fig. 13b) gives similar stress fields. Maximum stresses appear where the strut section is reduced. The strut presented in Fig. 11c is not favourably aligned in the tensile direction and no local reduction in the section is detected. The FE calculation without consideration of the inclusions (white circle in Fig. 13c) does not show a stress concentration at the location of the fracture of the strut. Thus, it confirms that the architectural features of the foam are not sufficient to explain the rupture of this strut. The stress distribution determined using a specific constitutive law for the inclusions (white circle in Fig. 13d) shows a stress concentration around the inclusion at the location of the fracture of the strut. Fig. 13e and 13f show the case of the two struts shown in Fig. 11e. In these two cases, the calculations with inclusions result in important modifications of the stress fields (see white circles). High stress concentrations are found in the vicinity of the inclusions, which can explain the struts’ fracture.
(a) (b)
(c) (d)
(e) (f)
Fig. 13: (a) and (b) Normal stress σ33 contours predicted for the strut shown in Fig. 11a bythe FE models (a) without and (b) with inclusions, (c) and (d) normal stress σ33 contours predicted for the strut shown in Fig. 11c bythe FE models (c) without and (d) with inclusions, (e) and (f) normal stress σ33 contours predicted for the struts shown in Fig. 11e bythe FE models (e) without and (f) with inclusions. In Fig. 13c, 13d, 13e and 13f, circles are placed at the same location as in Fig. 11. For all figures, the loading is applied along direction 3.
4. Discussion
A previous study proved the possibility to observe microstructural features thanks to local tomography in aluminum foams [17]. This work confims the relation between the location of these features and the fracture of some struts. In addition, tomography images have been processed to build a FE model. For this purpose, different image processing steps were developed to create a low sized image from the high-resolution images. This allows for using this low sized image as an input for FE meshing. However, the image scaling step overestimates the inclusions size and volume fraction. Consequently, the morphology and size of the inclusions are not precisely described by the low sized image. Moreover, the voxel size of 3 μm reached with the local tomography does not enable to distinguish the different inclusions: all of them have the same grey levels.
The calculated Young's moduli are higher than the experimental one (fig. 12). Caty et al. [26] also noticed this overestimation and pointed out the presence of different defects in the solid phase such as some pores as a possible reason. Otherwise, the choice of the material constitutive law can explain the phenomenon. An elasto-plastic law of a bulk 6101 aluminum alloy was used to model this sample. But, Zhou et al. [27] performed in situ tensile tests of Duocel foam struts in a SEM. In particular, they obtained a lower Young's modulus than the one of the aluminum bulk alloy. These tests tend to indicate that the mechanical behavior of an aluminum strut is different from that of an aluminum bulk alloy. The authors related it to some differences of microstructure (i.e., chemical composition and type of inclusions) in the aluminum struts and in the bulk alloy. It can also be noted that the small size of the tested struts can explain their results. The measurement of the cross sectional area of a strut is also delicate easy. For these reasons, we preferred using the data of a bulk alloy. Moreover, the measured weight fractions of the alloying elements (and especially of Mg and Si) in the foam are low compared to the nominal composition of the 6xxx alloys [18]. It is possible that the elasto-plastic law of a bulk
6101 alloy is not the most adequate behavior for this sample. Performing different calculations with different elasto-plastic constitutive laws for aluminum alloys would be necessary.
The experimental plastic domain is well reproduced by the FE model which does not take into account the inclusions (Fig. 12). It indicates that the choice of the material behaviors (i.e., elasto-plastic law combined with a GTN model) enables to model the tensile test of this sample. However, an optimization of the parameters (especially for the GTN model) is still needed to understand better their respective influence on the calculations. The calculated macroscopic stress is increased when the inclusions are present in the model. It is due to the constitutive law chosen for this phase. In the absence of data from the literature, we "built" a constitutive stress/strain law from the one of aluminum. For simplicity, we used the same Gurson parameters for the elements containing inclusions. A better choice would have been to promote damage in these elements. Gurson's model being mostly deformation-driven, damage is obviously underpredicted in these elements in our model compared to reality. A deeper study would be necessary to test different damage behaviors for this phase or to characterize better the mechanical properties of the inclusions.
The analysis of the local stress distributions given by the FE calculation brings important information to explain the local struts fracture. The local stress distributions obtained by the two calculations are different. It allows for explaining the fracture of some struts for which no architectural feature was found (Fig. 13b and 13d). The analysis of the 3D images and the stress distributions in the struts evidence the importance of taking into account the two characteristic scales of the cellular samples (i.e., mesoscale and microscale).
It is important to note that the approach presented here is more qualitative than quantitative. To perform calculations with a reasonable time, the image was meshed with tetrahedra having an average size of 76 μm. This size is slightly high compared to the inclusions size (between 10 and 160 μm, Fig 8). As already mentioned, the image processing steps artificially increase the
inclusions size and volume fraction in the final image. As explained in section 2.6, when associating an element to a grey level of the image, each element is represented by its barycentre. For these reasons, some elements may be associated to the inclusions although they physically correspond to zones containing both inclusions and aluminum matrix. 0.3% of the elements were associated to the inclusions whereas the volume fraction of inclusions in the struts was evaluated to 0.06%. This large difference could be partly corrected by a refinement of the mesh, but it would be detrimental to the duration of the calculation. Scanning the initial samples at higher resolution would also bring a finer characterization of the inclusions shape and size. The high-resolution scans of the struts (Fig. 7b) show that a scan with a voxel size smaller than 1 μm can provide a precise characterization of the inclusions size and morphology. In the model presented here, the tetrahedra are separated in two groups, i.e., the ones associated to the aluminum phase and the ones associated to the inclusions. This means that all the inclusions are modelled by a unique material behavior. However, a careful examination of the high-resolution 3D images shows that slight variations of grey levels appear in some inclusions (Fig. 14a), which are related to a local difference of volume fraction or of composition of inclusions. This can be preserved in the thresholded 3D image by a series of different thresholding. This resulted that thresholded 3D image would contain a gradient of grey levels to describe the inclusions (Fig. 14b). By assigning a different material constitutive law to each grey level, it would be possible to obtain a finer description of the sample behavior. Higher resolution images and characterization of the local properties of the inclusions could also result in a classification of the inclusions according to their chemical composition.Different types of Fe-rich inclusions have already been identified in the AlMgSi alloys [6, 7, 8], that could be taken into account in the model.
Our approach needs to be validated with experimental data at local scale to better characterize the local constitutive laws of the different phases considered. Some authors have already
performed local mechanical tests on aluminum foams [6, 27] or on FIB-machined samples in fibers of 10 µm diameter [38], smaller than the inclusions found in the present study. To go further, it could be possible to perform in situ tensile tests of a single strut using our approach. The use of Digital Image Correlation could also improve our approach to evaluate the strains in the struts and to compare it with simulated ones [39, 40].
(a) (b)
Fig. 14: Illustration of a possible improvement of the FE models including a gradient in inclusions properties: (a) slice of a high-resolution image (voxel size of 3 μm) showing differences in grey levels in the inclusions and (b) slice of a thresholded high-resolution image where the difference of grey levels in the initial image can be taken into account by a change of grey levels thanks to different thresholding steps.
5. Conclusion
This paper reports an original approach based on X-ray tomography to characterize and model the mechanical behavior of an aluminum foam taking into account its microstructural features at two length scales. The architecture and the microstructure of the solid phase were characterized thanks to scanning of the samples at two resolutions. The higher resolution 3D images (voxel size of 3 µm) were obtained from local tomography and reveal the presence of
intermetallic inclusions typical of 6xxx aluminum alloys. Then the progressive deformation of the sample was followed thanks to an in situ tensile test. The comparison between the 3D images of the deformed sample and the high-resolution 3D images of the initial sample showed the presence of inclusions along the fracture path for most broken struts. For this reason, FE models including the presence of these inclusions were built. The model was based on the meshing of a low sized 3D image containing the inclusions and processed from the high-resolution images. The model used specific constitutive laws for the aluminum matrix and the inclusions. A classical elasto-plastic law combined with a GTN model was chosen to model the damageable behavior of the aluminum matrix. The Young's modulus of the inclusion was determined using nano-indentation. Inclusions were considered as stiffer and less ductile than the matrix. The presence of the inclusions in the model resulted in local stress concentration explaining the early fracture of some struts where no architectural specific features were noticed. It showed the importance of the microstructural features to explain the macroscopic properties of the cellular samples. The approach we propose in this paper could complete previous works on cellular samples where the intermetallic inclusions were not considered. However, it is important to note that our results are mainly qualitative at this stage. A better fitting between the experimental and simulated stress/strain curves could be obtained. Different improvements were proposed in the paper to improve the quantification of properties (use of higher resolution 3D images, consider gradients in properties).
Funding sources
This work was supported by the French Ministry of Education and Research (grant for C. Petit PhD, 2012-2015).
The authors acknowledge José Ferreira (MATEIS laboratory, INSA Lyon) who developed the softwares used for the in situ mechanical test and ERG Aerospace® which kindly provided the samples.
References
[1] J. Banhart, Light-metal foams - history of innovation and technological challenges, Adv. Eng. Mater. 15 (2013) 82-111.
[2] E. Andrews, W. Sanders, L.J. Gibson, Compressive and tensile behavior of aluminum foams, Mater. Sci. Eng. A 270 (1999) 113-124.
[3] E. Amsterdam, J.H.B. De Vries, J.T.M. De Hosson, P.R. Onck, The influence of strain induced damage on the mechanical response of open-cell aluminum foam, Acta Mater. 56 (2008) 609-618.
[4] G. Gioux, T.M. McCormack, L.J. Gibson, Failure of aluminum foams under multiaxial loads, Int. J. Mech. Sci. 42 (2000) 1097-1117.
[5] T.G. Nieh, K. Higashi, J. Wadsworth, Effect of cell morphology on the compressive properties of open-cell aluminum foams, Mater. Sci. Eng. A 283 (2000) 105-110.
[6] E. Amsterdam, P.R. Onck, J.T.M. De Hosson, Fracture and microstructure of open cell aluminum foam, J. Mater. Sci. 40 (2005) 5813-5819.
[7] Q.G. Wang, C.J. Davidson, Solidification and precipitation behavior of Al-Si-Mg casting alloys, J. Mater. Sci. 36 (2001) 739-750.
[8] H. Tanihata, T. Sugawara, K. Matsuda, S. Ikeno, Effect of casting and homogenizing treatment conditions on the formation of Al-Fe-Si intermetallic compounds in 6063 Al-Mg-Si alloys, J. Mater. Sci. 34 (1999) 1205-1210.
[9] E. Maire, X-Ray tomography applied to the characterization of highly porous materials, Annu. Rev. Mater. Res. 42 (2012)7.1-7.16.
[10] A. Burteau, F. N'Guyen, J.D. Bartout, S. Forest, Y. Bienvenu, S. Saberi, D. Naumann, Impact of material processing and deformation on cell morphology and mechanical behavior of polyurethane and nickel foams, Int. J. Sol. Struct. 49 (2012) 2714-2732.
[11] T. Guillen, Q.H. Zhang, G. Tozzi, A. Ohrndorf, H.-J. Christ, J. Tong, Compressive behavior of bovine cancellous bone and bone analogous materials, microCT characterization and FE analysis, J. Mech. Behav. Biomed. Mater. 4 (2011) 1452-1461.
[12] J.-Y. Buffière, E. Maire, J. Adrien, J.-P. Masse, E. Boller, In situ experiments with X ray tomography: an attractive tool for experimental mechanics, Exp. Mech. 50 (2010) 289-305. [13] S. Youssef, E. Maire, R. Gaertner, Finite element modeling of the actual structure of cellular materials determined by X-ray tomography, Acta Mater. 53 (2005) 719-730.
[14] D. Miedzinska, T. Niezgoda, R. Gieleta, Numerical and experimental aluminum foam microstructure testing with the use of computed tomography, Comput. Mater. Sci., 64 (2012) 90-95.
[15] I. Jeon, T. Asahina, K.-J. Kang, S. Im, T. J. Lu, Finite element simulation of the plastic collapse of closed-cell aluminum foams with X-ray computed tomography, Mech. Mater. 42 (2010) 227-236.
[16] H. Toda, T Ohgaki, K. Uesugi, T. Kobayashi, N. Kuroda, T. Kobayashi, M. Niinomi, T. Akahori, K. Makii, Y. Aruga, Quantitative assessment of microstructure and its effect on compressive behavior of aluminum foams via high-resolution synchrotron X-ray tomography, Metall. Mater. Trans. A 37 (2006) 1211-1219.
[17] T. Zhang, E. Maire, J. Adrien, P.R. Onck, L. Salvo, Local tomography study of the fracture of an ERG metal foam, Adv. Eng. Mater. 15 (2013) 767-772.
[18] J. Zhou, P. Shrotriya, W.O. Soboyevo, Mechanisms and mechanics of compressive deformation in open-cell Al foams, Mech. Mater. 36 (2004) 781-797.
foams, Prog. Mater. Sci. 46 (2001) 559-632.
[20] Kak AC, Slaney M (1988) Principles of computerized tomographic imaging. IEEE, New York.
[21] NIH National Institute of Health, Image J [in line]. Available on: < http://imagej.nih.gov/ij/ >.
[22] E. Maire, P. Colombo, J. Adrien, L. Babout, L. Biasetto, Characterization of the morphology of cellular ceramics by 3D image processing of X-ray tomography, J. Eur. Ceram. Soc. 27 (2007) 1973-1981.
[23] W.E. Lorensen, H.E. Cline, Marching cubes: high resolution 3-D surface reconstruction algorithm, Comput. Graphics 213 (1987) 163-169.
[24] M. Zilske, H. Lamecker, S. Zachow, Adaptive remeshing of non-manifold surface. Proceedings of the Eurographics Conference, v. 27, n. 3, p. 1-7, 2008.
[25] P.J. Frey, H. Borouchaki, P.L. George, 3D Delaunay mesh generation coupled with an advancing-front approach, Comput. Mech. Eng. 157 (1998) 115-131.
[26] O. Caty, E. Maire, S. Youssef, R. Bouchet, Modeling the properties of closed-cell cellular materials from tomography images using finite shell elements, Acta Mater. 56 (2008) 5524-5534.
[27] J. Zhou, S. Allameh., W.O. Soboyevo, Microscale testing of the strut in open cell aluminum foams, J. Mater. Sci. 40 (2005) 429-439.
[28] A.L. Gurson, Continuum theory of ductile rupture by void nucleation and growth: part I - Yield criteria and flow rules for porous ductile media, J. Eng. Mater. Tech. 99 (1977) 2-15. [29] V. Tvergaard, A. Needleman, “Analysis of the cup-cone fracture in round tensile bar, Acta Metall. 32 (1984) 157-169.
[30] SIMULIA, Abaqus Analysis User's Manual [in line]. Available on:
ult. Htm>.
[31] V. Tvergaard, Localization in ductile materials containing spherical voids, Inter. J. Frac. 18 (1982) 237-252.
[32] C.C. Chu, A. Needleman, Void nucleation effects in biaxially stretched sheets, J. Eng. Mater. Tech. 102 (1980) 249-256.
[33] H. Li, M.W. Fu, J. Lu, H. Yang, Ductile fracture: experiments and computations, Inter. J. Plast. 27 (2011) 147-180.
[34] W.C. Oliver, G.M. Pharr, An improved technique for determining hardness and elastic modulus using load and displacement sensing indentation experiments. J. Mater. Res. 7 (1992) 1564-83.
[35] E. Maire, N. Gimenez, V. Sauvant-Moynot, H. Sautereau, X-ray tomography and three-dimensional image analysis of epoxy-glass syntactic foams, Phil. Trans. R. Soc. A 364 (2006) 69-88.
[36] A. Burteau, F. N’Guyen, J.D. Bartout, S. Forest, Y. Bienvenu, S. Saberi, D. Naumann, Impact of material processing and deformation on cell morphology and mechanical behavior of polyurethane and nickel foams, Int. J. Sol. Struct. 49 (2012) 2714-2732.
[37] V. Marcadon, C. Davoine, B. Passilly, D. Boivin, F. Popoff, A. Rafray, S. Kruch, Mechanical behavior of hollow-tube stackings: Experimental characterization and modeling of the role of their constitutive material behavior, Acta Mater. 60 (2012) 5626-5644.
[38] M.G. Mueller, V. Pejchal, G. Žagar, A. Singh, M. Cantoni, A. Mortensen, Fracture toughness testing of nanocrystalline alumina and fused quartz using chevron-notched microbeams, Acta Mater. 86 (2015) 385-395.
[39] S. Roux, F. Hild, P. Viot, D. Bernard, Three-dimensional image correlation from X-ray computed tomography of solid foam, Compos. Part A: App. Sci. Manuf. 39 (2008) 1253-1265.
[40] K. Madi, G. Tozzi, Q.H. Zhang, J. Tong, A. Cossey, A. Au, D. Hollis, F. Hild, Computation of full-field displacements in a scaffold implant using digital volume correlation and finite element analysis, Med. Eng. Phys. 35 (2013) 1298-1312.
![Fig. 3: Engineering stress/engineering strain curve of the 6101 aluminum alloy used to model the aluminum phase in the FE model (plot built from data from [27])](https://thumb-eu.123doks.com/thumbv2/123doknet/12295017.323590/14.892.253.651.114.344/engineering-stress-engineering-strain-curve-aluminum-alloy-aluminum.webp)