HAL Id: inria-00596055
https://hal.inria.fr/inria-00596055
Submitted on 26 May 2011
HAL is a multi-disciplinary open access
archive for the deposit and dissemination of sci-entific research documents, whether they are pub-lished or not. The documents may come from teaching and research institutions in France or abroad, or from public or private research centers.
L’archive ouverte pluridisciplinaire HAL, est destinée au dépôt et à la diffusion de documents scientifiques de niveau recherche, publiés ou non, émanant des établissements d’enseignement et de recherche français ou étrangers, des laboratoires publics ou privés.
Usage Analysis & Demonstrators - Version 2.0
Alain Boulze, Stéphane Bagnier, Julien Forrest, Sébastien Jourdain,
Mohammed El Jai, Claude Meynier, Jérôme Besnainou, Marc Dutoo, Marcel
Arrufat Arias, Adrian Mos, et al.
To cite this version:
Alain Boulze, Stéphane Bagnier, Julien Forrest, Sébastien Jourdain, Mohammed El Jai, et al.. Usage Analysis & Demonstrators - Version 2.0. [Research Report] 2009. �inria-00596055�
SCOrWare Project
WP3 Specifications
Usage Analysis & Demonstrators
Version 2.0
Funded by
Date March, 10, 2009
Deliverable type Specification
Version 2.0
Status Revision
Work Package 3 Usage Demonstrators
Access Permissions Public
Editor
INRIA Tuvalu Alain Boulze
Authors
Artenum Stéphane Bagnier
Julien Forest Sébastien Jourdain
EBM Websourcing Mohammed El Jai
Claude Meynier
Edifixio Jérôme Besnainou
Open Wide Marc Dutoo
Thales Communications SEA/TAI
Marcel Arrufat Arias
INRIA Tuvalu Adrian Mos
Guillaume Vaudaux-Ruth
Contributors
Table of Contents
1INTRODUCTION......7
2METHODOLOGICAL THOUGHTS......7
3A SCA APPROACH FOR SCIENTIFIC COMPUTING (Task 3.1)...9
3.1 Introduction, business / system context...9
3.1.1 Motivation...9
3.1.2 RNTL SCOS/V3D context and additional contributions from SCA...11
3.2 Theoretical analysis...12
3.2.1 Scenario A: Processing and concept of visualization pipeline...12
3.2.2 Scenario B: Use SCA to make the server side a composite application ...13
3.2.3 Scenario C: Use semantic to ease process definition...14
3.2.4 Scenario D: Create a new processing unit and test it on the client side...14
3.2.5 Scenario E: Deploy a new processing unit and test it on the server side...14
3.2.6 Scenario F: Create an independent application without server connection ...14
3.3 Implementation and tests...15
3.3.1 Demonstrator 1: SCA-CassandraPCS...15
3.3.2 Demonstrator 2: Static data processing...15
3.3.3 Demonstrator 3: SCA for complex data processing...16
3.4 Architecture / technical design – specification...16
3.4.1 Demonstrator 1: SCA-CassandraPCS...16
3.4.2 Demonstrator 2: Static data processing...19
3.4.3 Demonstrator 3: SOA for complex data processing...23
3.5 Coverage of the demonstrator (SCA spec, SCOrWare technical platform)...26
3.6 Lessons learned / methodology / best practices / demonstrators' results...27
3.7 References...28
4COLLABORATIVE DEVELOPMENT (Task 3.2)...28
4.1System context ...28
4.1.1Forge domain model...28
4.1.2Project portal domain model...29
4.1.3Business model...29
4.1.4Application domain...30
4.1.5Project portal: CMS features in a forge...30
4.2Usage scenarios...31
4.2.1Forge #1: new source code revision quality check...31
4.2.2Forge #2: development project road map...31
4.2.3Project portal #1: managing use cases, features and project integrations...32
4.2.4Project portal #2: CMS features...32
4.3Design...32
4.3.1Forge components...32
4.3.2Quality check scenario realization...34
4.3.3Development project progress dashboard scenario realization...35
4.3.4Project portal components...35
4.3.5Forge: SCA design...36
4.3.6Project portal: SCA design...37
4.4SCA specification coverage...42
4.5Lessons learned ...43
4.5.1FraSCAti vs. Tuscany...43
4.5.2Benefits of SCA...43
5REUSE AND ENRICHMENT OF COMPONENTS CORPORATE FRONT-END LINKED WITH SAP BACK-OFFICE (Task 3.3)...44
5.1Introduction – Context of the Business...44
5.2.1Introduction...44
5.2.2Web Application...46
5.2.3Front End services...51
5.2.4Real Time service...52
5.2.5Middle Office service...52
5.2.6Front Local Database...52
5.2.7Back Offices...52 5.3Methodology...52 5.3.1Target Environments...53 5.3.2Tools...55 5.4Technical Specification...57 5.4.1Technical Components...57 5.4.2Technical topics...58
5.5Cover of the demonstrator...59
5.5.1Conception...60
5.5.2Development...60
5.5.3Installation...60
5.5.4Production...61
6ORCHESTATION OF TRANSACTIONS (Task 3.4)...61
7NETWORK MONITORING (Task 3.5).......61
7.1Motivation...61 7.2Architecture...62 7.2.1Components overview...62 7.2.2Workflow overview...63 7.2.3Architecture evolution...63 7.3Functional specifications...64 7.3.1Discovery component ...64 7.3.2Inventory component ...64 7.3.3Visualization component ...64 7.3.4Monitoring component ...64 7.4Technical specifications...65
7.4.1SCA Component Diagram...65
7.4.2Bindings...65
7.4.3Provided functionalities...65
7.4.4Workflows...66
7.4.5Evolution of the architecture ...67
7.5Coverage...68
7.5.1FraSCAti and SCA Editor ...68
7.5.2FraSCAti-integrated PEtALS ...68
7.5.3JWT and Scarbo ...68
7.6Methodology and results...68
Index of illustrations
Illustration 1: canonical visualization pipeline...10
Illustration 2: global architecture of SCOS/V3D, based on a classic Web Services approach...11
Illustration 3: components and service oriented version of the visualization pipeline...14
Illustration 4: new component creation...14
Illustration 5: scientific computing: a standalone client composite application...15
Illustration 6: service exposition of the CassandraPCS processing engine...16
Illustration 7: service oriented architecture of CassandraPCS...17
Illustration 8: view of the CassandraPCS client...18
Illustration 9: view of the use of the visualization service from the pre-existing SPIS application...19
Illustration 10: services composition...20
Illustration 11: static processing service based on local processing units...21
Illustration 12: static processing service based on a set of processing units with one remotely localized...22
Illustration 13: dynamical service composition...23
Illustration 14: the figure illustrates both a remote processing unit domain and the global processing service domain...25
Illustration 15: client based on the Java 3D renderer...25
Illustration 16: client based on the VTK renderer...26
Illustration 17: Collaborative development: forge domain model...28
Illustration 18: Collaborative development: business model...29
Illustration 19: Collaborative development: forge components (global view)...33
Illustration 20: Collaborative development: forge components (implementation view)...34
Illustration 21: Collaborative development: forge scenario #1 (quality check)...35
Illustration 22: Collaborative development: forge scenario #2 (project progress dashboard)...35
Illustration 23: Collaborative development: SCA view of a quality forge (global design)...36
Illustration 24: Collaborative development: SCA view of a quality forge (implementation design)...36
Illustration 25: Collaborative development: SCA view of a project portal (global view)...38
Illustration 26: Collaborative development: SCA view of a project portal (implementation view)...39
Illustration 27: production application presentation...45
Illustration 28: demonstrator application presentation...46
Illustration 29: delivery notes search...47
Illustration 30: delivery notes detail...47
Illustration 31: price and availability request screen (Web2 Application)...48
Illustration 32: price and availability request screen (Web Application)...48
Illustration 33: price and availability result screen (Web2 Application)...49
Illustration 34: price and availability result screen (Web Application)...49
Illustration 35: order status list screen (Web Application)...50
Illustration 36: order status detail screen (Web Application)...50
Illustration 37: order entry screen (Web Application)...51
Illustration 38: order entry creates order 2-phase commit transaction ...52
Illustration 39: demonstration environment ...54
Illustration 40: development environment ...54
Illustration 41: integration environment ...55
Illustration 42: qualification environment (cluster) – out of demonstrator scope ...55
Illustration 43: tools usage – graphical summary ...56
Illustration 44: SCA components of the demonstrator...57
Illustration 45: front composite ...58
Illustration 46: network monitoring functional architecture ...62
Index of tables
Table 1: Methodological chart...9
Table 2: SCA and SCOrWare coverage (scientific computing)...26
Table 3: SCA coverage (collaborative development)...42
Table 4: SCA assembly model specification (collaborative development)...42
1 INTRODUCTION
This second version of the «Usage Analysis and Demonstrators » document mainly presents four case studies done during the second part of the SCOrWare project:
● (Task 3.1) Component and service-oriented architecture in the Scientific Software field
(improvements of works done during the first year)
● (Task 3.2) SCA as a SOA design methodology in the domain of CDE (Collaborative
Development Environment). Following the withdraw of one of the partners (eXo Platform, provider of an open-source portal solution) during the first year, some changes have been decided during the second part of the project and an alternative demonstrator has been designed.
● (Task 3.3) How SCA contributes to reusing and enriching software components. Following
the first year project's review, this scenario has been reinforced, and is the major
demonstrator for the SCOrWare platform in the field of enterprise business applications.
● (Task 3.5) Using the SCOrWare platform and a component-oriented architecture in the
context of a network monitoring system. A new partner (Thales Communications, in
collaboration with Open Wide and EBM Websourcing) has joined the SCOrWare consortium during the second part of the project, following the withdraw of Amadeus.
● Note: the works done during the first year of the project around a service orchestration
platform in the domain of travel reservation systems (Task 3.4) have been stopped, because of the withdraw of the main actor of this usage scenario (i.e. Amadeus).
In order to achieve the methodological work to be done in the context of the Task 3.3 (“reusing and enriching software components”), the development of the usage demonstrators has been completed by collaborative sessions between some partners involved in the Work Package 3. This collaborative work, led by EBM Websourcing, proposed during the second part of the project an in-depth analysis of how the demonstrators have been designed and developed, a better understanding of what
developers have done, and how the SCOrWare platform is used. This specification presents for every case study:
● motivation, business context, system context
● functional specification, usage scenarios
● architecture, technical design and specification
● coverage of the demonstrator (vs. SCA specification and SCOrWare technical platform)
● lessons learned, methodology, best practices, demonstrators' results
2 METHODOLOGICAL THOUGHTS
The works done around methodology in the context of the Task 3.3 have been conducted to help to identify how SCA and the SCOrWare platform could be used within a global SOA approach, as perceived and interpreted from a market point of view, and in particular from a first analysis done from the commercial competitors and offerings.
In a first stage of this work, we tried to define what a methodology is, and we got the following proposal:
Considering a problem “p” to be solved and a solution “s”, we use a “SOA/SCA methodology” to build a solution “s” , and we define “m” as the set of the tasks and their description conducting from “p” to “s” (“p->s”). We define “methodology” as an extrapolation of “m”,i.e.:
p € P (P is a set of problems with a “p” type), s € S (S is a set of solutions using SOA/SCA for problems with a “p” type), m € M (M is a set of best practices for proposing a solution S solving a
problem P using SOA/SCA).
Such an ambitious and global objective has arisen several difficulties and issues, according to the following considerations:
● differences in considering what SOA is, according to the position, role and motivation of the
partner involved in the SCOrWare project: academic or industrial, middleware or application developer, software editor or integrator, technologist or application, business aware,
developer, designer, architect or business analyst
● level of abstraction and models handled by the different actors in the SCOrWare project:
component level (such as in Fractal), infrastructure and middleware level (such as protocols, bindings, assembling), Java programing level (policies, properties), application architecture level (such as using SCA as an assembly of business components), process or workflow level (such as in environments like Eclipse JWT, Java Workflow Tooling or OW2 Scarbo, SOA ready SCA powered Eclipse BPM tooling), application or business level (considering the abstraction of the business application itself), ontology and semantics
● lack of real business features in the usage demonstrators as developed with the SCOrWare
platform, as most of the usage demonstrators are technology-oriented
● difficulties for the developers of the usage demonstrators to be observed and their work to be
in-depth analyzed and criticized (to be understood under the positive meaning of this wording), lack of resources and time too.
Finally, this methodological work has shown that such a methodology hasn't been really applied and used for the usage demonstrators, as the formalization of the business problem was very weakly treated, and as the usage demonstrators' domains are very close from technologist concerns. Moreover, even if there were intentions and actions for defining the services (following SOA
concepts) of a New Generation Forge (in the context of the task 3.2), this approach hasn't been finally concretized and demonstrated by the demonstrator itself.
Nevertheless, the methodological work which has been done has proven the great interest of SCA to facilitate a common understanding and sharing of the technological architecture for developing the solutions. In particular, the SCA graphical representation and the related concepts allow to “draw” and visualize the composition of the application architecture (“SCA Assembly”) to be implemented and deployed. Illustration 12 (for task 3.1), Illustration 23 & Illustration 25 (for task 3.2), Illustration 44 (for task 3.3), and Illustration 47 (for task 3.5) illustrate this main feature of SCA in terms of methodology. Besides, the demonstrator as developed in the task 3.3 has shown the benefit of having a “SCA container” integrated into a JBI ESB platform such as PEtALS, for composition of services, and integration of SCA and JBI.
We propose the following chart as a result of the observation and work done in this methodological work across the different usage demonstrators developed in the task 3.
Usage Demonstrators Business Context Application Architecture Technical Architecture Programing Model (Java) Deployment & Volumetric T3.1 [Scientific Computing] No formalization UML & SCA Assembly SCA Domain SCA Binding
RMI & Web Service
Serialization for large data
SCA Property ?
FraSCAti
Vol.: large data
T3.2 [Collaborative Development] UML SOA Design tentative & relationship to BPMN UML & SCA Assembly SCA Domain SCA Binding Web Service No SCA Policy SCA Property Tuscany 1.3.2 & FraSCAti 0.5 Vol.: N/S T3.3
[Corporate F/E Ontology UI mock-ups
SCA Binding
Web Service SCA Policy ?
Tuscany
Order Mgt linked with Back Office]
[Enterprise Case Study & SCOrWare “Pilot”] (Semantic Trader & Composer) UML & SCA Assembly Assembly Evolution EJB RMI JDO2 (JDBC) JBI (via PEtALS) SCA Property ? PEtALS (JBI/SCA) Vol.: number of components, compilation & development time T3.4 [Travel Transaction Orchestration]
N/A N/A N/A N/A N/A
T3.5 [Network Monitoring] No formalization SCA Assembly Assembly Evolution Multi-compositions SCA Binding Web Service & JMS (via PEtALS) SCA Policy ? SCA Property ? FraSCAti+ PEtALS (JBI/SCA) Vol.: N/S
Table 1: Methodological chart
This table describes the following methodological activities, and what are their relationships with the SCOrWare platform and works:
● Business Context: how the business domain has been described ? what formalization has been
chosen ? impact of SOA at this stage ?
● Application Architecture: which description and formalization of the application architecture ?
impact of SCA at this stage ? usage of SCA tool set ?
● Programing Model, Technical Architecture: which features of SCA and the SCOrWare
platform have been used ?
● Deployment and Volumetric: which SCOrWare runtime platform has been used ? which
volumetric and is it significant ?
● Main characteristics as demonstrated are highlighted (bold+italic) in this chart
Besides this overall classification with relation to a unifying “methodological” approach, every usage demonstrator as described in this specification gives an overview of best practices, methodological aspects, and lessons learned from the design and the development of the demonstrators. Across the different usage demonstrators, this part of the specifications lets appear different points of view and practices as capitalized during the development of the demonstrators and their design.
3 A SCA APPROACH FOR SCIENTIFIC COMPUTING (Task 3.1)
Change history vs. version 1.0: the first version 1.0 (October, 2007) of the specification was mainly describing the business problem and a first theoretical analysis. This final version fully describes the demonstrator, its technical design and implementation.
3.1 Introduction, business / system context
3.1.1 Motivation
The 3.1 sub work-package addresses the open question of the use of component based and service oriented architecture in the scientific computing field.
Scientific computing is an advanced area of the computing industry in terms of computing capacity, amount of data processed and performance expectation. However, tailored software developments in
this field are not leaded by computing specialists then most of the useful codes are written by PhDs in science, researchers and engineers who stick to quite simple development methods and paradigms. However, we see nowadays a progressive emergence of service-oriented architectures in the scientific field, especially in data processing. More and more research projects attempts to offer an access to their tailored tools through Web Services. In the domain of the exchange of complex data, Corba Bus have been explored at the late 90s. This technological evolution answers to a significant evolution of the market, especially for engineering application like in PLM processes or complex data handling (e.g CAD models, mesh, experimental data…). The geographical distribution of teams and experts, on one side, and the wish to control the diffusion of classified software or methods, on the other side, reinforce this need. One of the first examples could be the Salome platform [1] where each business components can be distributed remotely and the data exchange is performed on a CORBA bus. And more generally, the Integrated Modeling Environments (IMEs) able to remotely address the whole modeling process and offer tailored declinations (i.e adaptation of the GUI, integration of specific tools in composite application) introduce a new approach in mathematical modeling and numerical simulation.
In the present work, we make the choice to focus our study on the distribution of the visualization process of scientific data.
De facto most of 3D visualization tools present architectures that are close to service-based approach with the concept of visualization pipeline [2] [3]. In this concept, the whole processing is done by the composition of a set of basic filters (e.g. cutting plane). Processed scientific data are passed along this pipeline and 3D virtual reality objects, corresponding to the output data, are generated for the final rendering and visualization. Illustration 1 below illustrates this principle.
Illustration 1: canonical visualization pipeline
Data processing and 3D visualization outlines several simple problematic and critical issues that are actually characteristics of scientific applications more generally speaking.
Some of these issues are directly related to the processed data themselves:
● Data size: Processed data can become quickly very large and introduce sever constraints in
terms of memory foot print and network bandwidth;
● Data complexity: Scientific data may present sever constraints in terms of complexity, due to
their intrinsic structure (e.g. data fields deployed on mesh, temporal series…) or due to their implementation. Some data are, for instance, not easily serialisable due to the used
technologies (e.g. Fortran or C/C++ native layer) or structure (cyclic references).
● Data formats and conversion: For both historical and technical reasons, there is no general
consensus regarding a unique and standard data format for scientific data. This situation generally requires complex and CPU costly conversion processes.
● Performances: Generally speaking, due to the size of processed data and the complexity of the
processing, scientific data processing induces severe performances constraints.
In the validation process of SCA for scientific computing, several experimentations were done. We focused our analyses on the following aspects:
● The ease of use for non software developers specialists,
● Existing service exposition,
● The flexibility in the usage and in composition of services,
● The design issue.
3.1.2 RNTL SCOS/V3D context and additional contributions from SCA
This work was performed in parallel to the RNTL/SCOS project and, more specifically, its
sub-project SCOS/V3D. SCOS/V3D aims to create a framework for the high throughput 3D scientific data visualization, distributed and collaborative.
SCOS/V3D follows the recent evolution of visualization tools where the visualization process is split into different steps. The data are processed on a remote and high performances server and the
rendering is performed locally in a client application. One of the key innovations of SCOS/V3D is the possibility to access to the processing service through Web services, using light or semi-rich clients, and offer collaborative functionalities. This should allow displaying a large amount of data while offering a quite convenient access to the users. With respect to the existing solutions, several innovative choices have been done in SCOS/V3D:
● Let the data on the server and avoid all transfer of the raw data to the client side, to optimize
network load and to simplify the requirements on the client workstation.
● Transfer of resulting data to the client under the form of a 3D virtual reality scene, using the
X3D format to offer a better use of the client computing and memory capacities and to offer a 3D fluid navigation with less network communications.
● A high processing capacity by parallelizing the tailored processes on the server side.
● Offer the possibility to compose and test new processing artifacts locally and deploy them on
the server side.
The architecture of SCOS/V3D is composed of several distinct functional services: a rich client application, a web server, a visualization server, a data server, and a processing server. Underneath, SCOS/V3D requires a high performance computing cluster to support the processing server, a Storage Area Network to support the data server and a couple of master nodes to support the resource
management and scheduling. This architecture is summarized in the following schema:
Illustration 2: global architecture of SCOS/V3D, based on a classic Web Services approach The semi-rich client application has been developed in Java, using the JOGL library for the 3D rendering. An independent client library will be developed and will communicate with the
constraints (e.g firewalls, proxy…).
The visualization server gather all the component needed to build-up a full 3D collaborative
application, allowing the users to interact on the 3D scenes according to their access rights. Because all exchanges between the server and the client are done through request-answers based protocols (i.e. HTTP), a specific notification server has been developed [4], to allow the server to notify dynamically the client of the 3D scenes recomposition.
The processing server uses the VTK library [3] to process the data and to generate 3D scenes. These processes have to be efficiently balanced between the hardware nodes of the cluster in order to reach a high throughput capacity. The input datasets should be streamed directly from the data server and the output 3D scene should be streamed to the client through the visualization server. Both the settings and the composition of the processes should be defined from the client side, and communicated to the processing server thru an abstract set of instructions. These capacities make the processing server a versatile and highly re-configurable artifact
Last, one additional specificity of this demonstrator is that some tailored components are in a native language (C/C++) and their integration into a service oriented architecture presents an additional challenge, especially during the deployment phase.
The objective of the SCOS/V3D project was to mainly focus on the tailored layers and provide an operational solution in the duration of the project. For this reason and in spite the innovative functional choices, the chosen technical solution remains relatively classical.
It was chosen that the visualization server expose a lightweight web interface. This visualization server does not process any scientific data, and use both the data server and the processing server for this task. In practice, the SCOS/V3D implementation is a based on a simplified J2EE implementation. On the server side, the communications between the visualization server and the processing service is done using dedicated RMI/IIOP protocols.
In the frame of the ANR SCOrWare project, it is proposed to explore one-step further with the introduction of the complete Service Oriented Approach, using the SCA technology through a set of prototypes and demonstrators, the final objective being to provide a more versatile, scalable and adaptable visualization solution.
Reciprocally, the purpose of this set of experimentations is to check the global SCA specifications and how SCA can answer to the needs of the scientific community.
To address this objectives, a set of application scenarios have been identified, outlining potential bottlenecks or functional challenges, and a corresponding set of prototypes have been developed. Some of them are partially based on SCOS/V3D components for the tailored components, like the VTK based processing engine.
3.2 Theoretical analysis
In first step, a set of applicative scenarios has been identified, corresponding, on one side, to various practical situations possible in scientific data processing and, on the other side, in function of the coverage of SCA.
3.2.1 Scenario A: Processing and concept of visualization pipeline
The first proposed step is the modeling of a global SCOS/V3D system as a SCA system. Only the collaborative aspects of the V3D are excluded to focus on the processing aspects. From practical point of view, this scenario attempt to address:
● The service oriented description of a global visualization and complex service;
● The various possibility of client-server binding;
● The facility of deployment, taking into account for some components of native layers;
● The capability to transfer complex and large dataset between services.
On a first approximation (M1), the system is considered as the composition of a graphical component and a client library on the client side, and of a visualization component, a data access component and a set of components that we call the processing units, on the server side. On this approximation the binding between the two client side components does not have to be done using the SCA
specifications. We use SCA on the server side, to describe the components and to bind them to a composite application (i.e. visualization service). This scenario does not take into account the service composition explicitly. This simplified model (M1) is sum-up in the following schema:
The client library communicates with the visualization component thru web services exposed via HTTP. The visualization component consumes both data access component and processing units to render data and to send back 3D scenes. The SCA runtime is typically collocated to the visualization component and binds it to the consumed components.
Processing units can accept parameters and bind each over in order to create complex processes like chains of processes. This implies that we should define them as SCA components and be able to use them through a SCA binding description.
Processing units consume and provide 3D data sets, composed of points, cells defined on those points, and data attached on the points or on the cells. In this approximation, processing units admit a set of scalar values or chars as parameters (or XML setting file).
Because this scenario typically corresponds to the integration of pre-existing applications (i.e. complete 3D viewer, modeling framework, simulation kernel), the purpose of this scenario is also to evaluate the level of difficulty to expose as services such applications for non-experts.
For this reason, the development tools defined in the WP2 have been used.
3.2.2 Scenario B: Use SCA to make the server side a composite
application
The aim of the second scenario is to focus on the services composition, especially on the server side. In the scenario each service or “process unit” is associated to a direct processing filter (e.g. cutting plane or iso-surface computation). The main objectives here are:
● Study the effect or the service granularity in terms of
○ Composition facility;
○ Impact on the performances;
○ Data streaming and transfer.
● Evaluate the administration and monitoring features.
Using the components developed in the previous step, the final objective is to make a SCA composite application on the server side.
Illustration 3: components and service oriented version of the visualization pipeline
3.2.3 Scenario C: Use semantic to ease process definition
In this step, we will introduce a simple ontology for the concepts we manage in the 3D visualization field, and use it to implement semantic matching between process units.
3.2.4 Scenario D: Create a new processing unit and test it on the client
side
We will experiment the creation of a new processing unit on the client side by a scientific worker, and the binding of this new unit into a test workflow.
Illustration 4: new component creation
In this step we will create a skeleton of a processing unit and experiment the ease of development and use of a new component for a developer, which is not skilled in component architecture. We will also experiment the versatility of the bindings between the components by using a web services remote access to the client component.
3.2.5 Scenario E: Deploy a new processing unit and test it on the
server side
Will experiment the deployment a new processing unit and testing it on the server side. This step should use deployment artifacts developed in the frame of the WP2.
3.2.6 Scenario F: Create an independent application without server
connection
Illustration 5: scientific computing: a standalone client composite application
We will embed the SCA runtime and basic component implementation on the client side to make a composite application without server connexion.
3.3 Implementation and tests
To tests and explore these different scenarios, a set of prototypes have been developed. Some of these are included as code sample in the FraSCAti distribution. However, those software should still
considered as proof-of-concept and not be used for operational application purpose.
3.3.1 Demonstrator 1: SCA-CassandraPCS
This first demonstrator focused on the exposition as a service of an existing application and its use with SCA and non-SCA based clients. The goal of this demonstrator is to validate the simplicity to expose with several protocols a single and complex existing component with a total transparency regarding the 3D visualization client consuming this service. This demonstrator typically corresponds to the application scenario A.
The scientific context outlines several key issues.
● Because most of software are pre-existing and used in a classic approach since long time and
should maintain the same interfaces in a classic use, it is critical to be able to expose a pre-existing software in a non intrusive manner, i.e. without modification of this one.
● Reciprocally, an increasing number of scientific applications are parallelized using internal
high performance MPI techniques, deployed on HPC and exposed as Web service. Another key-issue is then the possibility to access to the exposed service using a standard web service stack.
● Last, the complexity of the exposition procedure is a critical aspect to be adopted by the
scientific community and non-SCA specialist.
Practically, this demonstrator was based on the integration of the CassandraPCS VTK based
processing engine [5], used in some developments of SCOS/V3D [6]. This integration has been done without modification of the processing engine and the detailed architecture is given in section 4.1 below.
3.3.2 Demonstrator 2: Static data processing
This demonstrator focused on services composition. In the present context, service composition should be understood as the building of a system relying in a structured manner to a set of external components. Those external components could be either local or remote. This demonstrator typically corresponds to the application scenarios B, D and E, and more generally to the framework oriented applications.
Here, the concept to service is put at the processing unit or vtkAlgorithm in the VTK vocabulary. In this approach, the visualization pipeline is here directly modeled by a composition of “basic” services. However, in this demonstrator, the dynamical aspect of the service composition has not been treated here, and the visualization process has been modeled in a static manner. In this first step, the focus
was put on:
● Service interoperability: This should be here understood in the sense of “How to replace an
implementation of a component by another one”. Scientific software generally knows several implementations, based on different numerical models for instance, and addressing the same problem. The critical issue here is the definition of common, standardized and functionally based APIs;
● Study the data streaming and transfer between services;
● Remote control or how to use a remote component instead of using a local one;
● Evaluation of the constraints of using or exposing a components as a remote service;
● Evaluate the performances cost of the local binding with respect a classic implementation;
● Evaluate the complexity of each point.
3.3.3 Demonstrator 3: SCA for complex data processing
In this last demonstrator, the flexibility of SCA based architecture was studied in details and more especially the dynamical services re-composition.
As done in the demonstrator 2, the services are defined here at the level of the processing units (i.e. vtkAlgorithm) and the visualization pipeline directly modeled by composition of services. With respect to the previous experimentation, the focus was put here on the dynamical aspect of the services composition to be closer to realistic cases.
3.4 Architecture / technical design – specification
This section presents the detailed architecture of each demonstrator and their specific technical aspects.
3.4.1 Demonstrator 1: SCA-CassandraPCS
As presented in the section above, this demonstrator is based on the exposition of a global
visualization service. This service is based on CassandraPCS, which is a 3D data processing engine written in Java and based on VTK. According to the concept of visualization pipeline of VTK, the principle of Cassandra is to process the scientific data by combination of a set of basic filters (i.e. vtkAlgorithm). Scientific dataset are given in input and processed along this pipeline. In output, CassandraPCS generates a 3D reality scene corresponding to the result of the processing (e.g iso-surface), under the form a X3D/VRML file. The control of the processing engine is done through a set of commands gathered in a single XML query. The schema in Illustration 6 illustrates this approach.
Illustration 6: service exposition of the CassandraPCS processing engine
This engine can be piloted by an external end-user application, in client-server mode for instance. The operation of the CassandraPCS processing engine is functionally de facto close to a service approach, with input data processed on demand according a given setting (configuration file).
However, a few small adaptations were needed with respect to the initial design of CassandraPCS. First, SCA requires an interface for the service exposition and a concrete class for its implementation
and in its standard distribution, CassandraPCS did not provide any interface. In consequences, a new interface and a new implementation were made for the service exposition, providing by the way an abstraction layer. Second, the standard implementation of CassandraPCS is statefull, which means that it own an internal state for progressive data processing definition, which could be achieved by several method’s calls. To deploy the engine in a SCA context, a new implementation has been developed, providing a stateless service by using the CassandraPCS service as local variable inside the processing method. Illustration 7 gives a graphical representation of the SCA domain of this service.
Illustration 7: service oriented architecture of CassandraPCS
The SCA runtime implicitly offers several bindings. In order to load a SCA service into the runtime, an XML file must be read and processed by it. Once the processing of this file is done, all the services and components attached to it become available. The SCA domain is given below as a XML
composite file.
<?xml version="1.0" encoding="ISO-8859-15"?>
<composite name="SCACassandraPCS" xmlns="http://www.osoa.org/xmlns/sca/1.0" >
<service name="SCACassandraPCS" promote="CassandraPCS/Engine">
<interface.java interface="com.artenum.scorware.cassandra.Engine"/>
</service>
<component name="CassandraPCS">
<implementation.java class="com.artenum.scorware.cassandra.CassandraPCSEngineImpl"/>
<service name="Engine">
<interface.java interface="com.artenum.scorware.cassandra.Engine"/>
<binding.ws uri="http://192.168.0.11:8080/CassandraPCS" />
<binding.rmi host="localhost" serviceName="rmiservice" port="1099"/>
</service>
</component>
</composite>
Composite definition of complex service exposition
To achieve the deployment, an execution class as been done in order to load the service inside the runtime. A very simple example of the launching application to deploy the service on the server is given below.
public staticvoid main(String[] argc) throws Exception {
// Load the SCA domain by reading the SCACassandraPCS.composite XML file.
Component scaDomain = AssemblyFactory.getComposite("SCACassandraPCS");
// Generate an instance of the SCACassandraPCS service managed by the SCA runtime
Engine engine = TinfiDomain.getService(scaDomain, Engine.class, "SCACassandraPCS");
// Once the service instance is available, the service is exposed. // Wait a user input in order to stop the service
System.in.read();
// Stop the service
TinfiDomain.close(scaDomain); }
Main class for deploying the service
Two dedicated clients have been developed, one based on SCA binding and one based on a default Web Service stack, in order to test the different ways to access and use the service.
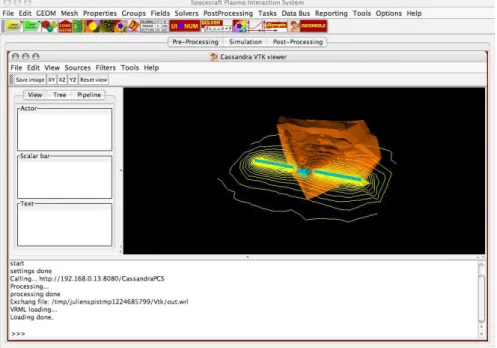
by the service, and a query panel, to control the service. The control of the service is done by editing a set of commands gathered in a XML based file. The client application simply calls the service and display the 3D data generated by the service to the user. A view of the client GUI that client is given in Illustration 8 below.
Illustration 8: view of the CassandraPCS client
Most of scientific applications have to be deployed in heterogeneous context, where the potential clients may access to the services in different manners and using different bindings. From this point of view, SCA presents potentially a strong advantage with respect to other solutions. Both listings for the SCA and Web Services binding are given below. These main classes show the injection of the service, instantiation and the initialization of the client and, last, the service closing procedure.
publicstaticvoid main(String[] argc) throws Exception { CassandraPCS apps = new CassandraPCS();
// Injection of the engine
Component scaDomain = AssemblyFactory.getComposite("WSClientCassandraPCS"); Engine engine = TinfiDomain.getService(scaDomain, Engine.class, "SCACassandraPCS"); apps.setEngine(engine);
// Build the Frame of the application
JFrame f = new JFrame("Cassandra PCS - SCA"); f.setDefaultCloseOperation(JFrame.EXIT_ON_CLOSE); f.setSize(500, 500);
f.getContentPane().setLayout(new BorderLayout()); f.getContentPane().add(apps, BorderLayout.CENTER); f.setVisible(true);
// Initialise the graphical client
apps.init();
// Wait user input to close the generated Engine
System.in.read();
// Close the SCA domain
TinfiDomain.close(scaDomain); }
SCA based client
publicstaticvoid main(String[] argc) throws Exception { CassandraPCS apps = new CassandraPCS();
// Injection of the engine
ClientProxyFactoryBean factory = new ClientProxyFactoryBean(); factory.setServiceClass(Engine.class);
factory.setAddress("http://88.182.100.19:9000/CassandraPCS"); apps.setEngine((Engine) factory.create());
// Build the Frame of the application
JFrame f = new JFrame("Cassandra PCS - WS"); f.setDefaultCloseOperation(JFrame.EXIT_ON_CLOSE); f.setSize(500, 500);
f.getContentPane().setLayout(new BorderLayout()); f.getContentPane().add(apps, BorderLayout.CENTER); f.setVisible(true);
// Initialise the graphical client
apps.init(); }
Standard WebService based client
The last test was to access to the service from a pre-existing and not specific client. This was done through the SPIS-UI system [7], based on the Kerridwen IME, by loading a Web Service stack library and using it dynamically by executing a Python/Jython script. Illustration 9 illustrates the SPIS-UI GUI, the messages log in Jython console and the results displayed in the integrated viewer.
Illustration 9: view of the use of the visualization service from the pre-existing SPIS application In this approach the SCA binding is not used. The purpose of this test is mainly to check the facility of use of the service by another application and using a high-level script language. The corresponding script is given below. In the present case, the control commands are previously defined in a simple Python dictionary. The service is then invoked and processed, and the output data are recovered under the form of a VRML file. This last one is then loaded and displayed in Cassandra 2.0, in a classic manner.
from org.apache.cxf.frontend import ClientProxyFactoryBean factory = ClientProxyFactoryBean()
factory.setServiceClass( Engine )
hostAdress = javax.swing.JOptionPane.showInputDialog("Server host address") factory.setAddress("http://"+hostAdress+":9000/CassandraPCS")
engine = factory.create()
data = engine.process(commande, fields, rep)
vrmlTmpFile = GL_VTK_EXCHANGE+os.sep+"out.wrl" out = file(vrmlTmpFile, "w") out.write( data.tostring()) out.close() cassandra = Cassandra() cassandra.getRendererPanel().GetRenderer().RemoveAllProps() importer = vtkVRMLImporter() importer.SetFileName(vrmlTmpFile) importer.SetRenderWindow( cassandra.getPipeLineManager().getCassandraView().GetRenderWindow()) importer.Update()
Integration of CassandraPCS service inside SPIS framework
3.4.2 Demonstrator 2: Static data processing
In this demonstrator, a component wrapping has been done at the level of the filters themselves (vtkAlgorithm) as Process Units that are combined into a pre configured processing chain, defined as
a static service composition in a DefaultPipelineComponent.
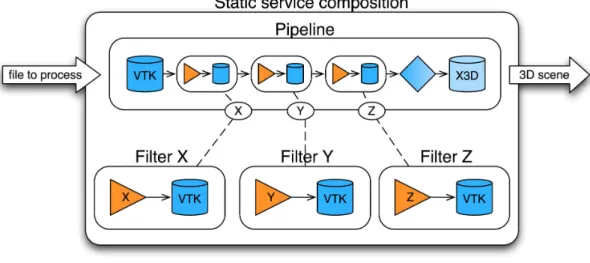
This DefaultPipelineComponent is the only one to be exposed, either remotely or locally, and handled by the client applications. Moreover, the Process Units composing the pipeline can themselves be deployed on the same domain (i.e. computer) than the DefaultPipelineComponent or remotely (i.e. another computers). Illustration 10 illustrates this configuration.
In such design, the original data models may introduce difficulties in the data sharing between processing units. Such models are generally linked to pre-existing and tailored algorithms that do not take into account the requirements of distributed designs and more generally SOA. For instance most of historical scientific data formats does not support the serialization of data, needed to transfer them through streams.
Illustration 10: services composition
This is the case of vtkDataSet, used here to store the scientific data, which are written in C++ and for which ones the corresponding Java object do not implement the Serialisable interface. If here the difficulty is mainly due to technological reasons, one should outline that similar problems may be due to the data structure themselves, if this one presents a cyclic structure for instance or if the data are distributed on a set of sub-sets with cross references.
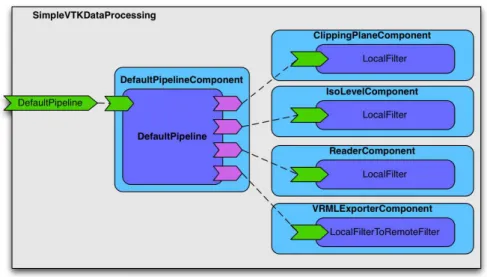
These aspects have been studied by two different implementations of the demonstrators. In the first one, the focus was put on the service composition, a local deployment and the direct manipulation of wrapped native objects, including not serialisable ones, by the processing units. The graphical representation of the SCA domain is given in the following graphic.
Illustration 11: static processing service based on local processing units In practice in the present demonstrator, the processing chain has been hard coded and the
configuration of the processing service is static. The final exposed API is simplified in consequences. The following extract of listing illustrates this configuration.
public class DefaultPipeline implements RemoteFilter {
private LocalFilter clip;
private LocalFilter iso;
private LocalFilter reader;
private LocalToRemoteFilter exporter; @Reference(name = "clip")
public void setClip( LocalFilter clip ) {
this.clip = clip; }
@Reference(name = "iso")
public void setIso( LocalFilter iso ) {
this.iso = iso; }
@Reference(name = "reader")
public void setReader( LocalFilter reader ) {
this.reader = reader; }
@Reference(name = "exporter")
public void setExporter( LocalToRemoteFilter exporter ) {
this.exporter = exporter; }
public byte[] process( Properties properties , byte[] data ) throws Exception { Properties clip1 = new Properties();
clip1.setProperty(ClipingPlaneKeys.NORMAL_X, "0"); clip1.setProperty(ClipingPlaneKeys.NORMAL_Y, "1"); clip1.setProperty(ClipingPlaneKeys.NORMAL_Z, "1"); clip1.setProperty(ClipingPlaneKeys.ORIGINE_X, "0"); clip1.setProperty(ClipingPlaneKeys.ORIGINE_Y, "-0.40"); clip1.setProperty(ClipingPlaneKeys.ORIGINE_Z, "0"); Properties clip2 = new Properties();
clip2.setProperty(ClipingPlaneKeys.NORMAL_X, "0"); clip2.setProperty(ClipingPlaneKeys.NORMAL_Y, "-1"); clip2.setProperty(ClipingPlaneKeys.NORMAL_Z, "1"); clip2.setProperty(ClipingPlaneKeys.ORIGINE_X, "0"); clip2.setProperty(ClipingPlaneKeys.ORIGINE_Y, "0.40"); clip2.setProperty(ClipingPlaneKeys.ORIGINE_Z, "0"); double[] scalarRange = { -0.10792893916368484, 0.0016820
Properties isoProp = new Properties();
isoProp.setProperty(IsoLevelKeys.ISO_LEVEL_VALUES, "-0.1:-0.09:-0.08:…:0"); vtkDataSet ds = null;
long startingTime = System.currentTimeMillis(); ds = reader.process(properties, ds);
ds = clip.process(clip1, ds); ds = clip.process(clip2, ds); ds = iso.process(isoProp, ds);
byte[] result = exporter.process(null, ds);
System.out.println("Processing time: " + (System.currentTimeMillis() - startingTime));
return result;
}
The next development was based on the same principle but try to use remote processing units inside the global processing service. To address this configuration, adaptations were needed to provide serialisable parameters. Regarding the vtkDataSet this has been done by the creation of temporary structures that are simply converted into byte arrays. Thanks to this and the components abstraction, Process Units have been deployed both locally and remotely, as illustrated in Illustration 12.
Illustration 12: static processing service based on a set of processing units with one remotely localized
The files listed below respectively correspond to the SCA domains in local and remote deployment of process units. The comparison of both listings shows that, after a proper definition of services, how is simple to change from one configuration to another one. Such conclusion may highly useful in
scientific applications, where the scalability of the whole application is frequently a key factor. The services distribution may also answer to an operational need in some project, where data should be first pre-processed remotely before any transfer, to reduce their size or complexity, for instance.
...
<component name="DefaultPipeline">
<implementation.java class="com.artenum.scorware.vtk.pipeline.DefaultPipelineRemote"/>
<service name="RemoteFilter">
<interface.java interface="com.artenum.scorware.vtk.processing.RemoteFilter"/>
</service>
<reference name="clip"target="ClippingPlaneComponent/RemoteFilter">
<interface.java interface="com.artenum.scorware.vtk.processing.RemoteFilter"/>
</reference>
<reference name="iso"target="IsoLevelComponent/RemoteFilter">
<interface.java interface="com.artenum.scorware.vtk.processing.RemoteFilter"/>
</reference>
<reference name="reader"target="ReaderComponent/RemoteFilter">
<interface.java interface="com.artenum.scorware.vtk.processing.RemoteFilter"/>
</reference>
<reference name="exporter"target="VRMLExporterComponent/RemoteFilter">
<interface.java interface="com.artenum.scorware.vtk.processing.RemoteFilter"/>
</reference> </component> ...
...
<component name="DefaultPipeline">
<implementation.java class="com.artenum.scorware.vtk.pipeline.DefaultPipelineRemote"/>
<service name="RemoteFilter">
<interface.java interface="com.artenum.scorware.vtk.processing.RemoteFilter"/>
</service>
<reference name="clip"target="ClippingPlaneComponent/RemoteFilter">
<interface.java interface="com.artenum.scorware.vtk.processing.RemoteFilter"/>
<binding.ws uri="http://192.168.0.10:8080/remoteClip" /> <!-- CHANGE HERE !!! -->
</reference>
<reference name="iso"target="IsoLevelComponent/RemoteFilter">
<interface.java interface="com.artenum.scorware.vtk.processing.RemoteFilter"/>
</reference>
<reference name="reader"target="ReaderComponent/RemoteFilter">
<interface.java interface="com.artenum.scorware.vtk.processing.RemoteFilter"/>
</reference>
<reference name="exporter"target="VRMLExporterComponent/RemoteFilter">
<interface.java interface="com.artenum.scorware.vtk.processing.RemoteFilter"/>
</reference> </component> ...
Use of a remote component for the clip filter
These files also define the injection rules and the selection of the used implementation. As example, the following extract of listing illustrates how to switch between several implementations. This could be simply achieved by changing the class name of a component. Such functionality may be very useful to change of numerical models, for instance, in a same processing chain.
…
<component name="IsoLevelComponent">
<implementation.java class="com.artenum.scorware.vtk.processing.filter.remote.XXXXXXX"/>
<service name="RemoteFilter">
<interface.java interface="com.artenum.scorware.vtk.processing.RemoteFilter"/>
</service> </component> …
3.4.3 Demonstrator 3: SOA for complex data processing
The final demonstrator tries to highlight the most advanced features of SCA runtimes, by providing a flexible service exposition to a complex and dynamic data processing service. By flexibility, we mean a processing service that can be extended by any number of processing units, which could be
indifferently deployed locally or remotely.
Classically, a main set of processing units is defined in the SCA domain before the runtime. However, the design of FraSCAti allows to dynamically add any extra processing unit to the SCA domain at the runtime, with some specific implementations. This extensibility has only been done for remote RMI processing units, but could be as easily extended to any binding.
In order to be closer to the architecture of operational projects like SCOS/V3D, the process units were distributed on several remote nodes and inter-connect using the RMI and WebService binding.
Illustration 13: dynamical service composition
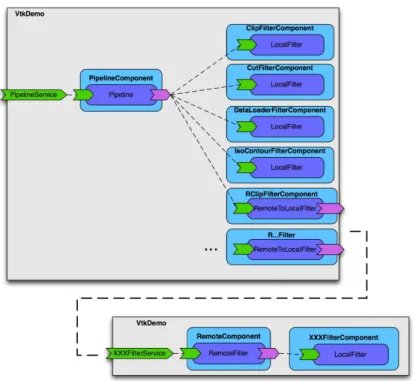
named PipelineComponent is responsible of the configuration and the composition of each registered processing units.
The process units can then be linked to the PipelineComponent. This last one will offer the way to manage them through a single injection point, which allows any number of processing units. Nominally, the SCA specification does not offer the possibility of dynamical service compositing. The service compositing is done through the definition of the SCA domain and requires a re-starting of the whole system, if the services connectivity has been modified. But, a dynamical service
composition corresponds to a critical need in most scientific applications. For instance, it appears as prohibitive to have to restart a complete visualization system for each modification of the
visualization pipeline.
However, this difficulty has been handled in the demonstrator 3 by the following approach. In a first step, the Process Units are registered and referenced into the PipelineComponent using the SCA domain, as usual. By this, the PipelineComponent offers a central reference to each ProcessUnit. The composition itself, i.e. the connectivity between the Process Units, is not directly expressed in the SCA domain, but using a dedicated tree managing the services connectivity defined in the
PipelineComponent. This structure can dynamically be defined and modified. Each Process Units is then processed in the correct ordering, as defined in the PipelineComponent. It should be noticed that, due to the progressive pipeline definition, the PipelineComponent should be statefull, which can be easily done by declaring this one with a “Composite” scope in the code annotation.
A last point should be outlined. If the services declaration through the SCA domain is normally done at the runtime initialization with most of other SCA implementations, FraSCAti offers an additional API than allows to dynamically declaring new components without need to restart the runtime. Regarding the user experience, this approach presents the strong advantage to prevent any code edition, nor compilation to extend the global service. This approach allows a complete and dynamical way to extend the visualization pipeline. A processing unit definition is shown as example in the SCA composite file below.
…
<component name="IsoContourFilterComponent">
<implementation.java class="com.artenum.scorware.vtk.filter.IsoContourFilter" /> <service name="Filter">
<interface.java interface="com.artenum.scorware.vtk.api.LocalFilter" /> </service>
</component>
<wire source="PipelineComponent/filter3"target="IsoContourFilterComponent/Filter" /> …
Illustration 14: the figure illustrates both a remote processing unit domain and the global processing service domain
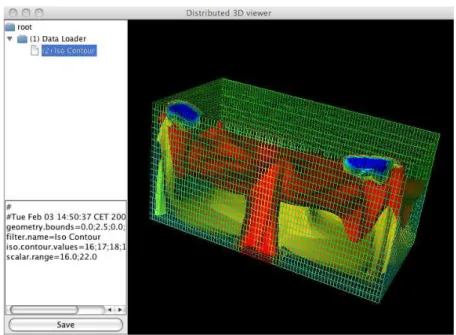
Two implementations of the PipelineComponent have been done, one generating a vtkDataSet and another one generating a standard VRML file. A client application has been developed for each version of the service, using different technologies of 3D rendering, depending on the nature of the
produced data. Screenshots of both clients are given in Illustration 15and Illustration 16.
Illustration 16: client based on the VTK renderer
3.5 Coverage of the demonstrator (SCA spec, SCOrWare technical
platform)
In the frame of the WP 3.1, it was decided to support an approach focusing on application cases the closest possible to realistic situation in scientific computing and data analysis. The scenarios/ demonstrators compliance matrix below summarizes the coverage of the proposed scenarios by the different demonstrators. By the way, the results may seem global or integrative and any demonstrator can be explicitly related of a specific feature of SCA or another one. However, thanks to the riches and the complexity of these scenarios a large set of functionalities is de facto covered:
Local and remote deployment;
Use of different binding (SCA, RMI, Web services…);
Integration and deployment of native components through a JNI wrapping;
Transfer of large and complex data set and identification of related constraints (i.e. serialisable structures);
Modeling of service composition, statically and dynamically; Exposition of stateless and state full services.
The use of abstract semantics was unfortunately not explored in the frame of this study, in spite its large potential field of application in scientific applications.
Demonstrator 1 Demonstrator 2 Demonstrator 3
Scenario A X X Scenario B X X Scenario C Scenario D X X Scenario E X Scenario F X
3.6 Lessons learned / methodology / best practices / demonstrators'
results
The demonstrators developed in the frame of the WP 3.1 focused on applications cases related to scientific applications and, more precisely, 3D data analysis. A step-by-step approach was followed in order to study the various functionalities offered by SCA. A first step was focused on the service exposition, with the use of several bindings and different deployment contexts. In a second phase, a fully SOA based architecture and the services composition was studied in more details, with the conversion of the canonical visualization pipeline into a composition of services.
From a human point view, the followed methodology was voluntary based on practical cases in order to evaluate the learning curves of SCA especially for non-experts. Indeed, such social and cultural aspects may be critical for a success dissemination of a new software technology. The development of these demonstrators has confirmed that the introduction of SCA does not induce a prohibitive
overhead, if the migration toward a SOA is performed step-by-step. These tests have also confirmed that SCA answers, in a large part, to the needs of the scientific community in this field.
However, these first tests have shown that a full migration to service oriented architecture may require some design and paradigm modification in existing software. For instance, the distribution of services on different nodes with SCA forbids the sharing of data, through references, and requires cloning them while remote communication is involved. Therefore, it becomes impossible to share a reference between services in a remote context. SCA does not offer an automatic proxy to manage call-back between distributed objects by just wiring calls among services to the real object instance. This is at the opposite of ProActive based techniques [8], with Active Object when they are used by several remote distributed components. This should be taken into account into the global software design.
This specific point is not a drawback of the SCA technology. But, what is important to understand is that SCA do not manage the same way its local and remote components.
With the distance, one key point for distributed high performance computing is probably to identify clearly the right service granularity, depending on the nature of the service, the deployment and network constraints. For instance, the use of SCA of service exposition of coarse components, like in demonstrator 1, seems well adapted. The various binding possibilities offered by SCA is here a strong advantage. The same observation can be done regarding its facility of configuration and deployment, thanks to the definition of the SCA domain. This does not forbid the use of MPI or ProActive approaches for the fine components distribution in Intranet on HPC. Both techniques seem complementary of each other.
The whole performances evaluation was initially a source of worrying, with the evaluation of the over-cost due to the service exposition. Tests performed, comparing an in-lined version of the
processing chain and the SCA based version, have shown that the difference seems not significant, at least for applications similar to the demonstrator 1.
The main feedbacks collected to this first experimentation are finally:
● Easy service injection in an independent manner of the service exposition like Spring [9].
● Small impact on code change while exposing a service. (Annotation needed for scope and
references...) The pattern adapter can be used to prevent code intrusion in existing software where source code can't be changed or annotated.
● The service exposition has been simplified in a drastic manner specially when the same
service is exposed with several protocols.
The developed demonstrators should still be considered as simple proof-of-concept and it is not recommended to use them for operational applications. The demonstrators 1 and 2 are structured as Maven based projects and are available on demand. The third demonstrator, illustrating the
in the FraSCAti runtime samples (repository SVN). Released under the terms of the LGPL license, it can be freely used, modified and extended.
3.7 References
[1] Salome plate-forme Web site, www.salome-plaform.org
[2] VTK Web site, www.vtk.org
[3] OpenDX Web site, http://www.opendx.org
[4] S. Jourdain et. al., ShareX3D, a scientific collaborative 3D viewer over HTTP, Web3D Symposium 2008, Los Angeles, California, 2008.
[5] Cassandra’s Web page, www.artenum.com/cassandra
[6] SCOS project Web page, www.oscos.org
[7] SPINE community Web site, www.spis.org
[8] ProActive Web site, http://proactive.inria.fr/ [9] Spring Web site, http://www.springsource.org/
4 COLLABORATIVE DEVELOPMENT (Task 3.2)
Change history vs. version 1.0: the first version 1.0 (October, 2007) of the specification was describing the first stage of the development of this usage demonstrator (with Tuscany as target runtime SCA platform), focusing on the functionalities of a New Generation SOA Development Forge. This final version specifies the integration of a Collaborative Environment, through the so-called OS2P Portal (Open Source Project Portal). It considers too the replacement of the former portal technology foreseen in this usage demonstrator (i.e. Exo Portal and WebOS) by a new one (i.e.
Liferay), following the withdraw of the partner eXo Platform during the first year of the project.
4.1 System context
4.1.1 Forge domain model
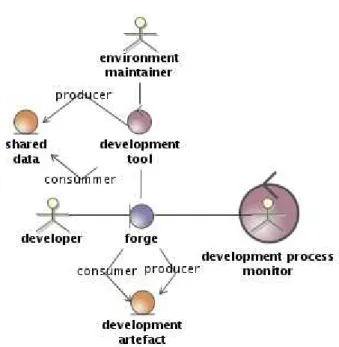
The domain of CDE inherits from collaborative environment (computer supported collaborative work, or CSCW) and from software development environment (software engineering) domains.
The collaborative aspect of the domain defines a community as an aggregation of individual members achieving collaboration through participation according a set of common rules. The development environment aspect of the domain defines members as software developers that concurrently and collaboratively contribute to the development of a software project.
A forge is a configured collaborative platform hosting the software development projects of a community of developers.
Illustration 17: Collaborative development: forge domain model
4.1.2 Project portal domain model
Software projects are used as foundation or building blocks by software integrators to develop
business- and client- specific solutions. However, in order to do this, software projects are not merely put side to side, but integrated together through configuration files, technical "glue" development, and made to interact using business specific model and logic.
We define the reusable part of this work as a "project integration" for a given use case or business need. Another way to see it is 1. that a project integration is in a “uses” relation with the project(s) it integrates and 2. that it is not a “top-level” project, top-level meaning here that it is not meant to appeal on its own and outside the scope of the project(s) it integrates.
We also define the largest context of a project portal, which:
1. provides a configured collaborative platform hosting project integrations provided by the community of software integrators,
2. 2. provides a web publishing solution targeting project users and other software integrators.
4.1.3 Business model
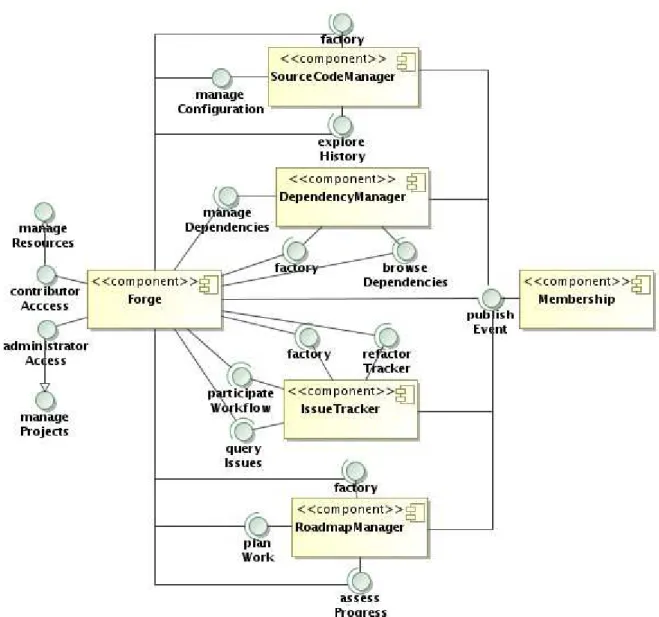
The forge is the interface that implements collaborative development business.
The system shall ease the development and deployment of development oriented services, participating in the collaborative development workflow.
The system shall enable automation of the development process monitoring.
The project portal shall allow project integrators to manage documented use cases, as well as related features and project integrations, and make information about those available to potential project users.
Additional roles needed in the project portal solution are : project integrator and technology user (which may be as well a potential software integrator as a business analyst).
Illustration 18: Collaborative development: business model