HAL Id: tel-00735857
https://tel.archives-ouvertes.fr/tel-00735857
Submitted on 27 Sep 2012
HAL is a multi-disciplinary open access
archive for the deposit and dissemination of sci-entific research documents, whether they are pub-lished or not. The documents may come from teaching and research institutions in France or abroad, or from public or private research centers.
L’archive ouverte pluridisciplinaire HAL, est destinée au dépôt et à la diffusion de documents scientifiques de niveau recherche, publiés ou non, émanant des établissements d’enseignement et de recherche français ou étrangers, des laboratoires publics ou privés.
Greywater treatment for reuse by slow sand filtration :
study of pathogenic microorganisms and phage survival
Rafat Khalaphallah
To cite this version:
Rafat Khalaphallah. Greywater treatment for reuse by slow sand filtration : study of pathogenic microorganisms and phage survival. Chemical and Process Engineering. Ecole des Mines de Nantes, 2012. English. �NNT : 2012EMNA0051�. �tel-00735857�
Mémoire présenté en vue de l’obtention
du grade de Docteur de l’Ecole des Mines de Nantes
Sous le label de l’Université Nantes Angers Le Mans
Discipline : Génie des Procédés Spécialité : Environnement
Laboratoire : EMN GEPEA UMR CNRS 6144
Soutenue le 14 Septembre 2012 École doctorale : SPIGA
Thèse N° 2012 EMNA0051
Greywater treatment for reuse by slow sand filtration:
study of pathogenic microorganisms and phage survival
JURY
Rapporteurs : M. Michel BAUDU, Professeur d’Université, Université de Limoges M. Abdeltif AMRANE, Professeur d’Université, Université de Rennes
Examinateurs : Mme. Catherine FAUR, Professeur, Université de Montpellier
Mme Valérie HEQUET, Maître Assistant (HDR), Ecole des Mines de Nantes M. Nour-Eddine SABIRI, Maître de conférences, Université de Nantes
Directeur de Thèse : M. Yves ANDRES, Professeur Ecole des Mines de Nantes
Rafat KHALAPHALLAH
Traitement des eaux grises par filtration lente pour leur réutilisation : étude de la survie des micro-organismes pathogènes et des bactériophages
3
DEDICATION
To my father, Shipat elhamd Bahig KHALAPHALLAH. Rest in peace
To my mother, Rawhia kamel Ahmed. Allah Save for us
To my brothers and sisters
To my friends
5
Acknowledgements
First, I would like to express my profound gratitude to Allah for giving me the strength, enablement and ability to complete this work.
My appreciation and sincere gratitude go to my supervisor Pr.Yves ANDRES, for his ideas and suggestions before and through conducting this work. I am greatly appreciative Dr. Nour-Eddine SABIRI for his high experienced advice and his support. I am greatly appreciative Professor Laurence LeCOQ and Dr. Valérie HEQUET for helping me in my work. Sincere gratitude is extended to the staff of DSEE from Ecole des Mines de Nantes (EMN) for their helpful comments and guidance enables me to finish this thesis successfully. I also wish to thank all laboratory technicians and research assistants in EMN for their continuous help and advice.
Acknowledgment is due to Egyptian Government and South Valley University for supports of this research.
7
Publications
R.KHALAPHALLAH, Y.ANDRES (2012) The effect of various abiotic factors on the survival growth of Escherichia coli and Pseudomonas aeruginosa in bathroom greywater. Journal Water Reuse and Desilination,2, 2, 92-101
Congress presentations
R. KHALAPHALLAH, N-E SABIRI, Y. ANDRES, L. Le COQ Bathroom greywater: abiotic factors effect on the survival growth of pathogens microorganisms and sand filtration for reuse, Water Reuse 2011 Conference, 26-29 September 2011, Barcelona, Spain.
R.KHALAPHALLAH, V. MAROGA-MBOULA, M.PELAEZ , V. HEQUET, D.D. DIONYSIOU, Y.ANDRES Inactivation of E. coli and P. aeruginosa in greywater by NF-TiO2
photocatalyst under visible light, conference WWPR 2012, 28-30 march, Water Reclamation & Reuse, Heraklion Crete, Greece. (2012).
9
Résumé et mots-clés
Dans les dernières décennies, la plupart des pays du monde ont connu une pénurie d'eau et l’augmentation du taux de consommation. Aujourd'hui, tous les pays dans le monde essayent de trouver des alternatives pour remédier à cette pénurie. Une solution consiste en la réutilisation des eaux grises (GW) pour l'irrigation après traitement. Les GW correspondent aux eaux usées générée dans une maison à l'exception de l'eau des toilettes. Les risques associés à la réutilisation de ces eaux est la présence de microorganismes pathogènes qui peuvent infecter les humains, les animaux et les plantes. Dans cette thèse centrée sur l'étude de la survie des représentants d'agents pathogènes, comme E. coli, P. aeruginosa, et le bactériophage MS2 qui sont trouvés dans les eaux grises. Il a été étudié l’effet de quelques facteurs physico-chimiques tels que; température (6 ± 2,23 ± 2 et 42 ± 2 ° C), la salinité (1,75 and 3.5% de NaCl), de l'oxygène (aérobie et anaérobie), des éléments nutritifs (milieu riche et de milieux pauvres), la lumière avec la photocatalyse (lampes UV et visible) et filtre à sable lent (sable du désert égyptien et le sable piscine). Une combinaison de la température, la lumière du soleil et de haute photocatlysis sont principalement responsables de la baisse rapide des bactéries et du coliphage MS2. Le filtre à sable lent a une influence nettement moindre sur la survie des bactéries dans les eaux grises, mais il est efficace pour diminuer la turbidité et de la DCO.
Mots-clés : Filtration lente, filtre à sable, eaux grises, réutilisation, survie microbienne (E. coli, P. aeruginosa, coliphage MS2), facteurs abiotiques, photocatalyse, UV.
10
Résumé et mots-clés en anglais
In recent decades, most countries of the world have experienced a shortage of water and increase its rate of consumption. Today, every country in the world are interested in this problem by trying to find alternatives to address this shortage. One solution is reuse greywater (GW) for irrigation after treatment. GW is all water generated from Houshold except toilet water. The risks associated with the reuse of these waters are the presence of pathogens that can infect humans, animals and plants. In this thesis focused on studying treatment by slow sand filtration and the survival of representatives of pathogens, such as E. Coli, P. aeruginosa , E. Faecalis and Bacteriophage MS2 which could be found in the greywater. The study factors was a physico-chemicals factors such as; temperature (6±2,23±2,42±2°c), salinity (1.75 and 3.5% Nacl), oxygen (aerobic and anaerobic condition), nutrient ( rich media , 50%: 50% salt and poor media ), light with photocatalysis ( UV and Visible lights) and slow sand filter (egyptian desert sand and swimming pool sand). A combination of high temperature, sunlight and photocatlysis are mainly responsible for the rapid decline of bacteria and MS2 coliphage. Slow sand filter have clearly less influence on the survival of bacteria in the greywater, but it effective to decline turbidity and COD for short times.
Key words: Slow sand filtration, Greywater, Reuse, Abiotic factors, Microbial survival (E;coli, P. aeruginosa, coliphage MS2), Photocatalyse, UV.
11
TABLE OF CONTENTS
DEDICATION ……….. 3 ACKNOWLEDGMENT ……… 5 PUBLICATION……….. 7 RESUME ………... 9 Table of contents ……… 11 Liste of tables ………. 15 Liste of figures………. 16Abbreviations and notation ……… 19
List of Annex………... 21
CHAPTER ONE
GENERAL INTRODUCTION AND OUTLINE
1 .1 Background ……… 241 .2 Need for research ………. 25
1.2.1 Objective and scope……….. 27
1.2.2 Outline of the thesis……… 29
CHAPTER TWO
LITRATURE REVIEW
2.1 INTRODUCTION ………. 33 2.2 Greywater Composition ………. 34 2.3 greywater characteristics ………. 36 2.3.1 Microbiological characteristics ………. 382.3.1.1 Pathogenic microorganisms in greywater ……… 40
2.3.1.1.1 Pathogenic microorganisms and indicator bacteria in greywater... 40 2.3.1.1.1 Bacteriophage………. 42
2.3.1.2 Pathogenic microorganism parameters……….. 44
2.3.1.2.1 Particle cell size distribution ……….. 44
2.3.1.2.2 Electrostatic charges on the cell surface (Zeta potential measurement)……….. 45 2.4 Greywater treatment and microorganisms’ survival... 47
2.4.1 Effect of abiotic factors on survival growth of bacteria... 47
2.4.1.1 Temperature... 48
2.4.1.2 Nutrient deficiencies... 49
2.4.1.3 Dissolved oxygen... 50
2.4.1.4 Salinity... 51
2.4.2 Physical treatment………. 52
2.4.2.1 The effect of light irradiation on microorganisms inactivation 52 2.4.2.1.1 Inactivation by visible light... 52
2.4.2.1.2 Inactivation by Ultraviolet light... 53
2.4.2.1.3 Dark recovery... 54
2.4.2.1.4 Mechanisms of inactivation... 54
2.4.2.1.5 Developments in photocatalytic water treatment... 56
2.4.2.1.6 Photocatalyst modification and doping... 57
2.4.2.2 Treatment by Slow Sand Filtration... 59
2.4.2.2.1 Mechanisms of microorganisms Removal by SSF... 60
12
2.5 Option of greywater reuse ……… 62
2.5.1 Greywater storage……… 62
2.5.2 Greywater recycling……….. 63
2.5.3 Greywater reuse for irrigation……….. 63
2.6 CONCLUSION……… 64
CHAPTER THREE
CLEAN FILTER MEDIA AND SAND FILTER
3.1 INTRODUCTION……… 673.1.1 Sand Characterizations ……… 67
3.1.2 Hydrodynamic Characterization of clean filter media……….. 72
3.1.3 Experimental determination of residence time distribution (RTD) .. 76
3.1.4 Residence time distribution (RTD) test in the case of filtration rate between 2.9 10-3 and 7 10-3 m / s: Experiments and results…………. 79 3 .2 SLOW SAND FILTER (SSF) 3.2.1 Materials and methods……….. 89
3.2.1.1 Slow sand filters and experiment methods……….. 89
3.2.1.2 RTD and flowrate………. . 90
3.2.1.2.1 Fluorescein tracing……… 90
3.2.1.2.2 Flowrate……… 91
3.2.2 Physico-chemical parameter………. 91
3.2.3 Microbiological analysis……….. 91
3.2.3.1 Total bacterial flora……….. 92
3.2.3.2 Escherichia coli and Pseudomonase aeruginosa……….. 92
3.2.3.3 Enterococcus faecalis ………. 93
3.2.4 Biological action and biofilm construction……….. 94
3.2.5 Results and discussions………. 95
3.2.5.1 RTD test in the case of slow sand filtration (SSF): rate filtration ≈ 3.31 10-5 95 m / s………. 3.2.5.2 Physico-chemical and microbological parameters….. …. 96
3.3 CONCLUSION……… 102
CHAPTER FOUR
4-1
EFFECT OF ABIOTIC FACTORS ON PATHOGENIC BACTERIA
IN GREYWATER
4.1.1 INTRODUCTION ……… 1054.1.2 Material and methods……… 106
4.1.2.1 Bacterial growth conditions and parameters………. 106
13
4.1.2.3 Temperature ………... 107
4.1.2.4 Aeration ………. 107
4.1.2.5 Salinity……… 107
4.1.2.6 Zeta potential and cell size measurement………... 108
4.1.3 Results and discussions ……… 108
4.3.1 Effect of Temperatures on survival of E.coli and P.aeruginosa………. 108 4.3.2 Effect of Oxygen on survival of E.coli and P.aeruginosa …… 112
4.3.3 Effect of Salinity on survival of E.coli and P.aeruginosa…….. 114
4.3.4 Effect of Different Media on ζ Potential and cell size of E.coli and P.aeruginosa……… 116 4.1.4 CONCLUSION ……… 118
4.2 Coliophage MS2 inactivation by abitic factors in greywater 4.2.1 INTRODUCTION ……… 119
4.2.2 Material and methods……… 119
4.2.2.1 Phage preparation and media ……….. 119
4.2.2.2 Coliphages MS2 and bacterial host ………. 120
4.2.2.3 MS2 coliphage detection ………. 120
4.2.2.4 Abiotic factors experiment design……… 121
4.2.2.5 Data analysis ……… 121
4.2.3 Result and discussion ……….. 121
4.2.3.1 Effect of abiotic factors on MS2 coliphage……….. 121
4.2.4 CONCLUSION ……… 122
CHAPETR FIVE
I-Inactivation of E.coli , P.aeruginosa and Bacteriophage MS2 in greywater
by NF- TiO2 photocatalyst under various light irradiation conditions
5.1 INTRODUCTION ………. 1275.2 Methodology ………. 128
5.2.1 Microorganisms and growth ………... 128
5.2.2 Reactors ,light source and catalyst ……….. 129
5.2.3 Heterogeneous Photocatalysis reactions ……….. 130
5.2.4 Disinfection model ……….. 131
5.3 Result and discussion ……… 131
5.3.1 Bacterial inctivation under UV and visible light irradiation in dionezied water ……….. 131 5.3.2 Bacterial inctivation under UV and visible light irradiation in grey water……….. 134
14
5.3.3 Effect of irradiation on MS2 coliphage in greywater……… 136
5.4 CONCLUSION ………. 138
6 : CONCLUSION AND PERSPECTIVE ………. 141
7 : RESUME EN FRANÇAIS ………. 145
8 : REFERENCES………. 165
15
Tables
Table 2.1. Typical composition of greywater compared with bathroom greywater
Table 2.2 Reported numbers of indicator bacteria in greywater (log10. mL-1) (Ottosson and
Stenstrom, 2003)
Table 3.1. Comparison of the elemental composition obtain by EDXRF (nd; not detected).
Table 3.2. The different parameters obtained by image analysis for the two sands Table 3.3. Structural parameters of the beds studied.
Table 3.4. Results of experimental study of the RTD for high flow rates (50 – 100 mL/min). Table 3.5. Results of experimental study of the RTD for low flow rate 10 mL/min.
Table 3.6. Comparison between the mean values of physico-Table 3.7. The values of COD and flowrate
chemical and microbiological
Table 4.1. Chemical analysis of greywater samples used in this study (Chaillou et al. 2011) (COD: Chemical Oxygen Demand. FNU: Formazin Nephelometric Units)
Table 4. 2. Zeta potential and pH for E. coli and P. aeruginosa in NB and GW media at 25 °C (EC: Escherichia coli; PA: Pseudomonas aeruginosa; GW: Greywater; NB: Nutrient broth)
Table 4.3. The absolute magnitude values T90 and K for Escherichia coli incubation in
laboratory conditions K: Decay rate (h). T90
Table 4.4. The absolute magnitude Values T
: Time require for 90% reduction in cell viability
90 and K of Pseudomonas aeruginosa incubation
in laboratory condition (K: Decay rate (h). T90
Table 4.5. T
: Time require for 90% reduction in cell viability).
90 and k values for MS2coliphage depending of abiotic factors conditions
Table 5.1. Typical greywater composition (COD: Chemical Oxygen Demand ; Chaillou et al., 2011).
Table 5.2. T90
Table 5.3. T
and k values for EC and PA depending of the illumination conditions
16
Figures
Figure 1.1. General scheme of the proposed studied of greywater treatment for safe reuse. Figure 1.2. Chapters and Objectives
Figure 2.1. Percentages of greywater and blackwater from wastewater produce in a household Figure 2.2. Percentages of greywater resources from household wastewater
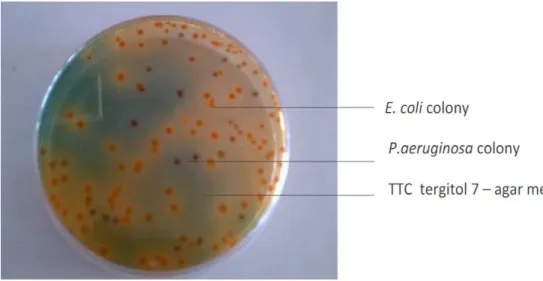
Figure 2.3. Escherishia coli colonies on TTC7 petri dishes media
Figure 2.4. Pseudomonas aeruginosa colonies on TTC7 petri dishes media Figure 2.5. Coliphage MS2 plaques by double layer agar on TYG agar media Figure 2.6. Triple layer zeta model.
Figure 2.7. Direct Effect of UV on cell’s DNA
Figure 2.8. Scheme of photocatalytic microorganisms inactivation mechanisms Figure 2.9. Electron hole pair between valence and conduction band
Figure 2.11. UV–vis absorption spectra of: (B) TiO2; (C) F–TiO2; (D) N–TiO2
Figure 2.12. N-F codoped TiO
; (E) N–F-
2 prepared by sol- gel solvothermal method codoped TiO2
prepared by sol–gel-solvothermal method ( Huang et al.2006)
Figure 3.1. (A) Example of EDS samples treated in image analysis; (B) Example of a EDS
sampleusedin image analysiswith agravellarger than6mm.
Figure 3.3. Grain size distribution of the EDS
Figure 3.2. SEM images of SPS used
Figure 3.4. Grain size distribution of the SPS
Figure 3.5. Comparison of the particle size distributions of the two sands
Figure 3.6.
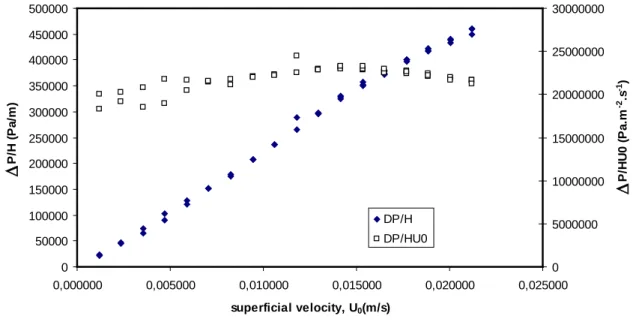
Figure 3.7. Pressure gradient across the fixed bed as a function of superficial velocity (SPS at Diagram of theexperimental setupusedfor pressure drop measurements.
Figure3.8. Pressure gradient across the fixed bed as a function of superficial velocity (EDS at Figure 3.9. Typical example of response
Figure 3.10. Typical example of response
Figure 3.12. Experimental normalized curve of response signal vs. time obtained for SPS Figure 3.11. Experimental normalized curve of response for EDS
17 Figure 3.14. E(t) vs time for EDS
Figure 3.15. E(t) vs time for EDS Figure 3.16. E(t) vs time for EDS Figure 3.17. E(t) vs time for EDS Figure 3.18. E(t) vs time for SPS Figure 3.19. E(t) vs time for SPS Figure 3.20. E(t) vs time for SPS Figure 3.21. E(t) vs time for SPS
Figure 3.23. Residence time distribution with flow rate used for bio-filtration: comparison between experiment and plug model.
Figure 3.22. E(t) vs time for SPS
Figure 3.24. Schematic diagram of the slow sand filtration Figure 3.25. Colonies of bacterial flora on nutrient agat media
Figure 3.26.Colonies of E.coli and P.aeruginoa on TTC7 agar media Figure 3.27. Colonies of E.faecalis on slantez and brely agar media Figure3.28. Curve of COD and flowrate of Egyptian desert sand Figure 3.29. Curve of COD and flowrate of Swimming Pool sand
Figure 3.30. Variation of bacterial colonies of Egyptian Desert Sand
Figure 3.31. Variation of bacterial colonies of Swimming Pool Sand
Figure 4.1 Effects of temperature on growth curve of P. aeruginosa and E. coli at 6±2 °C Figure 4.2. Effects of temperature on growth curve of P. aeruginosa and E. coli at 23 ±2 °C Figure 4.3. Effects of temperature on growth curve of P. aeruginosa and E. coli at 42 ±2 °C Figure 4.4. Effects of oxygen availability on survival curve of E. coli. (The vertical lines Figure 4.5. Effects of oxygen availability on survival curve of P. aeruginosa. (The vertical Figure 4.6. Survival curve of E. coli and P. aeruginosa in 50% GW to 50% DW. (The Figure 4.7. Survival curve of E. coli and P. aeruginosa in 1.7% salinity.
Figure 4.8. Survival curve of E. coli and P. aeruginosa in 3.5% salinity. Figure 4.9 Effects of different media on particle size of E. coli
Figure 4.10. Effects different media on particle size of P. aeruginosa Figure 4.11. MS2 coliphages plaque on TYG double-layer-agar Figure 4.12. Inactivation MS2 coliphage by abiotic factors
18
Figure5.1. Schematic diagram of photocatalytic reactor exposition on sol-gel NF doped TiOR2R .
Figure 5.2. Photocatalytic P.aeruginosa and E. coli inactivation under simulated solar Figure 5.3. E.coli mortality in DW under various light irradiation conditions
Figure5.4 P aeruginosa mortality in DW under various light irradiation conditions Figure 5.5. E.coli mortality under various light irradiation conditions in greywater Figure 5.6. P.aeruginosa mortality under various light irradiation conditions in greywater Figure 5.7 inactivation MS2coliphage by Visible and UV light in Greywater
Figure 5.8. inactivation MS2coliphage by Visible and UV light in Deionized water Figure 6. Greywater collection, treatment and reuse for irrigation landscap and economic plant
19
ABBREVIATIONS AND NOTATION
Abbreviations
AOPs Advanced Oxidation Processes
BOD Biological Oxygen Demand
COD Chemical Oxygen Demand
CFU Colony Forming Unit
DW Dionized Water
DAL Double Agar layer
EC Esechrechia Coli
EDS Egyptian Desert Sand
FNU Formazin Nephelometric Units
FAO Food and Agriculture Organization
GW Greywater
HLR Hydraulic Loading Rate
HRT Hydraulic Retention Time
NB Nutrient Broth Media
MMG Mimum Mineral with Glucose Media
MS2 Phage Phage attack E.coli Hfr
NA Nutrient Agar
OD Optical Density
PSD Particle Size Ditibution
PA Pseudomonase Aeruginosa
PFU Plaque Forming Unit
RTD Residence Time Distribution
SEM Scanning Electron Microscope
SPS Swiming Pool Sand
SSF Slow Sand Filter
TTC7 Triphenyl Tetrazolium Chloride Media
TYG Trypron Yest-extract Glucose Media
TOC Total Organic Carbon
TSS Total Suspended Solids
Tot.P Total Phosphorous
Tot.N Total Nitrogen
WW Wastewater
WHO World Health Organization
UV Ultra Violet
20
Notation
d
90 Particle diameter below which lies a percentage (90 %)dNt/dt the rate of change in the number of coliforms with time
D Diameter
E Energy
FN The frequency number
h Planck’s constant
k inactivation rate constant
Nt the number of coliforms at time
rpm revolutions per minute
t time.
τ tortousity
T90 the time requirment to decay 90%
v frequency
21
Annex
Annex 1: Tracing fluorescein
Annex 2: Standard curves for COD and turbidity Annex 3: The Sand elemental composition
Annex 4: Tables of physico-chemical and microbiological measurements of SSF Annex 5: Cell size measurements
23
CHAPTER ONE
25
1.1 Background
Water scarcity is one of the most significant challenges to human health and environmental integrity in most parts of the world. As the world’s population grows and prosperity spreads, water demands increase and multiply without the possibility for an increase in supply. The mounting demand on this finite and invaluable resource has inspired creative strategies for freshwater management, including innovative techniques for wastewater recycling. Greywater reuse is one such strategy, and its usefulness to fulfil non-potable water needs should be thoroughly investigated.
In General, water mismanaged by overconsumption and pollution is factors from water crisis, over 70% of freshwater consumption is devoted to agricultural activities (FAO 2008). Recently, declining productivity of commercial farms has led international policy networks to recommend the promotion of urban and peri-urban agriculture as an escape from food crisis situations (FAO 1999). Greywater treatment and reuse at the individual level can provide a combined solution to these problems by supplying the water and nutrients needed for household food production. Greywater treatment and reuse for irrigation may well hold the key to easing demand on limited freshwater reserves while improving the food production capacity of households and farms.
However, there are significant concerns about the safety of greywater reuse for irrigation purposes. The key issue involved is the potential for damaging effects of poor quality water on soil, plants and humans. Water quality requirements for agricultural irrigation are a subject of much interest to researchers in theory; agricultural water need not be of potable quality, opening the door to greywater and surface water irrigation (WHO 2006).
However, the microbial population of untreated water is very diverse, and dangerous organisms can be present. Microorganisms that can cause illness or disease, collectively known as pathogens, are usually associated with human or animal faecal which reach to greywater by washing hand, clothes or vegetables and surface water sources. Greywater contains a large number of pathogenic bacteria (Rose et al., 1991; Birks et al., 2004; Jefferson et al., 2004) that reach them through the leak from the bathroom or washing vegetables or washing hands and contaminated clothing. Irrigation water contaminated with pathogens has often been blamed for outbreaks of foodborne illness. It is important to carefully manage this
26
risk when promoting the reuse of non-potable water sources to fulfill the water demand of agricultural irrigation activities.
In most country of the world, greywater reuse is not yet a common practice because the water use regulation are severe and the treatment processes did not reached to them. The greywater production rates for each country are different according to household activities and the personal habits. Today there are signs that some of countries’ historically privileged access to fresh water may be changing. As fresh water levels in this countries drop and pollution increases, prices are rising and efficient use of water is becoming more important to businesses, farmers and homeowners. As a result, interest in greywater reuse technologies is growing rapidly.
1.2. Need for research
“Greywater”, which refers to used water flowing from sources such as showers, washing machines, and bathroom sinks, often represents over 2/3 (60-70%) of household wastewater but is considered to be only weakly contaminated by pathogenic organisms and other potentially dangerous substances (WHO 2006 ; Friedler 2004 ; Gulyas et al., 2004). In the context of a densely populated like as a most of cities, full greywater treatment and reuse is rarely feasible at the household level due to the high space requirement and technological of greywater treatment. Source separation of household wastewater into streams of grey and black waters is a strategy that has the potential to reduce the space and investment required to achieve water reuse at the domestic level.
Domestic greywater reuse schemes allow the two factors mentioned above (water wastage and high irrigation demand) to be twinned, putting excess wastewater to new use in the irrigation. There is also an economic benefit to this activity, as it provides significant savings in water use and sewage disposal. The health and environmental hazards of this form of water reuse are not enough clear and limited studies. The use of greywater for watering vegetables and other edible plants is the subject of some concern. While greywater may appear benign, it can contain hazardous elements such as heavy metals, pathogenic microorganisms, and toxic chemicals that could pollute garden soils and contaminate edible crops (Eriksson et al. 2002).
27
This study is focus on greywater treatment by slow sand filter technology. Moreover various factors from the environment, such as abiotic factors, or the use of solar light irradiation with catalyst have been studied. On this basis, the work has to overcome the problem of pathogenic microbes in the water. In order to promote water recycling practices as part of the effort to ease water demand in our growing cities (Egypt), research is needed to fully understand the benefits and risks of greywater irrigation.
1.2.1. Objectives and scope
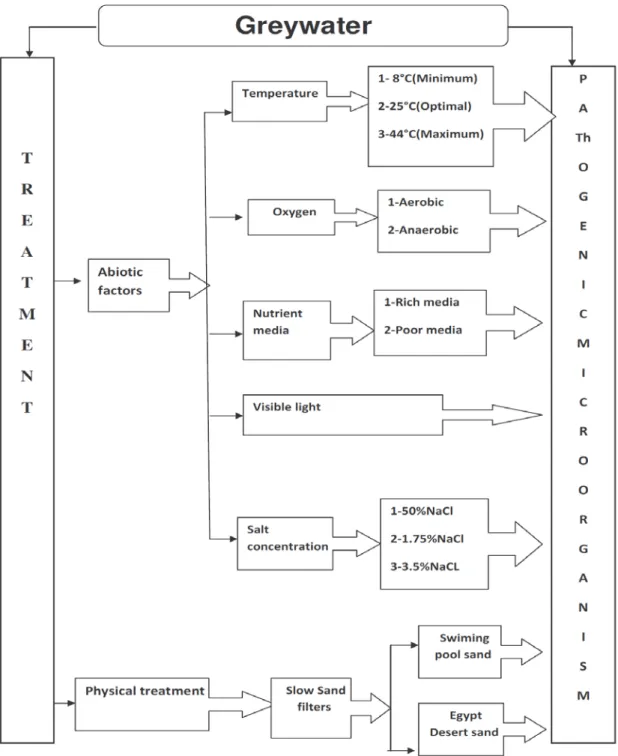
This thesis aims to propose a way of treatment by a rustic and robust treatment process bathroom greywater and to understand the survival and the disinfection of pathogen microorganisms (including phage). The global objective is to provide safe, pathogen-free water for greywater reuse. Accordingly, the following objectives were identified (Figure 1.1):
1. To assess current knowledge of the pathogens present in greywater and the suitability of disinfection technologies for their removal.
2. To determine the microbial quality and presence of specific pathogens in bathroom greywater
3. To evaluate the microorganism removal performance of leading contender greywater treatment technologies i.e sand filtration and photocatalyse
4. To assess the efficacy of established and novel disinfectants for the disinfection of grey water under environmental factors.
28
Figure 1.1 General scheme of the proposed studied of greywater treatment for safe reuse.
The study fits into a growing body of research in the field of water reuse strategies and provides data on the quality of greywater . It is one of the first focused investigations into the reuse of greywater by used a new technologies like as light with catalyst and slow sand filter,
29
which may become a vital survival strategy for residents of water-scarce regions in years to come.
1.2.2. Outline of the thesis
This thesis is organized in five chapters as depicted in Figure 1.2 in addition to Chapter 1.General introduction and outline.
Chapter 2. Reviews the literature of pathogens present in greywaters, characterizes greywater, greywater treatment technologies regarding operation, affordability and efficiency.
Chapter 3 Treatment of greywater by slow sand filtre ,this chapter divided to two part , the first is clean filter media and sand filter, second part is slow sand filtration.
Chapter 4. Effect of abiotic factors on survival of pathogenic bacteria in greywater.
Chapter 5 Inactivation of pathogenic bacteria and coliphages by NF- TiO2 with solar light.
Figure 1.2 Chapters and Objectives
CHAPTERS OBJECTIVES
CHAPTER 1 General Introduction and
Outline
CHAPTER 2 Litrature Review
CHAPTER 3 GW Treatment by Slow Sand
Filter CHAPTER 4
Inactivation Microorganisms by UV and light in GW Effect of abiotic factors on Bacteria and ColiphageMS2
31
CHAPTER TWO
33
2.1 Introduction
Greywater treatment and recycling of useful products, i.e. water, nutrients and organic matter, limit both water shortages and environmental pollution. Related to an increasing global population, scarcity of water resources, mismanagement and climate change, water shortage and water pollution have become a global issues (Falkenmark, 1990; Arnell, 1999; Bouwer, 2000). Industrial and domestic wastewaters' constituents contribute to water resource and soil pollution (Metcalf and Eddy, 2003). Greywater is any household wastewater with the exception of wastewater from toilets, which is known as blackwater. 50-80% of household wastewater is greywater from kitchen sinks, dishwashers, bathroom sinks, tubs and showers. Greywater contribution to domestic wastewater is 60-75% of the water volume (Gulyas et al., 2004), and includes release of 9-14%, 20-32%, 18-22% and 29-62 % of N, P, K and organic matter respectively (Kujawa-Roeleveld and Zeeman, 2006). Several issues emerge with greywater, namely, reusing with or without simple treatment (Christova-Boal et al., 1995; Al- Jayyousi, 2002). The first issue is recycling for indoor use such as flushing toilets, washing clothes and/or bathing (Christova-Boal et al., 1995; Bingley, 1996; Nolde, 1999; Jefferson et al., 1999; 2001; Shrestha et al., 2001a and b; Li et al., 2003; Cui and Ren, 2005). The second issue is for outdoor use such as irrigating domestic gardens, lawns on college campuses, athletic fields, cemeteries, parks and golf courses, washing vehicles and windows, extinguishing fires, feeding boilers, developing and preserving wetlands and recharging ground water (Christova-Boal et al., 1995; Bingley, 1996; Fittschen and Niemczynowicz, 1997; Nolde, 1999; Otterpohl, 1999; Okun, 2000; Jefferson et al., 2001; Shrestha et al., 2001a and b; Eriksson et al., 2002; Al-Jayyousi, 2002; 2003). The third issue is (standards) mainly related to health and social aspects in order to improve the control of the recycling process (Nolde, 1999; Jefferson et al., 1999; 2000; 2001; Li et al., 2003; Cui and Ren, 2005). The fourth issue is obtaining affordable treatment technologies to cope with the quantity and quality variation of greywater sources (Imura et al., 1995; Eriksson et al., 2002), and the recycling requirements (Nolde, 1999; Jefferson et al., 1999; 2000; 2001; Li et al., 2003; Cui and Ren, 2005).
Knowledge of the pathogen content of greywater is limited. However, specific pathogens and significant numbers of indicator bacteria have been reported (Rose et al., 1991; Birks et al., 2004; Jefferson et al., 2004), indicating that the disinfection of greywater prior to reuse is
34
essential to reduce the risk to public health. This review, therefore, examines various greywater treatment methods with the aim of coming up with an efficient, simple and affordable treatment method with safe effluent for use. A treatment method is considered efficient if it produces the required effluent quality, is simple in operation with minimum maintenance, and affordable due to its low energy.
2.2 Greywater composition
Greywater composition varies widely from household to household, depending on the personal habits of residents and the products used in the home, reflecting the lifestyle of the residents and the choice of house-hold chemicals for laundry, bathing, etc. The percentages of greywater and blackwater (corresponding to water contaminated with feces and urine) from a household wastewater production are presented in Figure2.1.
Figure2.1. Percentages of greywater and blackwater from wastewater produce in a household (according to Friedler2004)
Greywater represents the largest potential source of water savings in domestic residences, accounting for as much as 50–80% of the total water uses (Al-Jayyousi et al., 2003; Boghos et al., 2004; Christova-Boal et al. 1996; Flowers et al., 2004). In general, it contains often high concentrations of easily degradable organic material, i.e. fat, oil and other organic substances,
30%
70%
blackwater greywater
35
residues from soap, detergents, cleaning agents, etc. and generally low concentrations of pathogens (Ridderstolpe 2004). Greywater in general has low content of any metals or organic pollutants, but depending on the building it can increase with the addition of environmentally harmful substances (Ridderstolpe 2004). The content of metals or organic compounds greatly depends on usage of substances like paints, solvents, etc. (Ridderstolpe 2004).
Figure 2.2. Percentages of greywater resources from household wastewater
Greywater composition also varies according to source, (Figure 2.2). The first source is: greywater from bathroom, water used in hand washing and bathing generates around 50-60% of total greywater and is considered to be the least contaminated type of greywater. Common chemical contaminants include soap, shampoo, hair dye, toothpaste and cleaning products. It also has some faecal contamination (and the associated bacteria and viruses) through body washing. The second source is: greywater from kitchen contributes about 10% of the total greywater volume. It is contaminated with food particles, oils, fats and other wastes. It readily promotes and supports the growth of micro-organisms. Kitchen greywater also contains chemical pollutants such as detergents and cleaning agents which are alkaline in nature and contain various chemicals. Therefore kitchen wastewater may not be well suited for reuse in all types of greywater systems. The third source is: greywater from cloth washing, water used in cloth washing generates around 25-35% of total greywater. Wastewater from the cloth washing varies in quality from wash water to rinse water to second rinse water. Greywater generated due to cloth washing can contain, in addition to soap and detergent, a large amount
7% 48% 11% 34% Hand basin Bath/shower kitchen lundrey
36
of dyes and can also have faecal contamination with the associated pathogens and parasites such as bacteria.
The household’s activities varies according to socio-economic status, cultural practices, cooking habits, cleaning agents used, as well as demography. For example, a household that uses phosphate-free laundry detergent will produce a greywater that is much lower in phosphate than one that does not. Greywater usually contains surfactants (anionic, cationic and amphoteric) which come from shampoos, detergent formulations, etc.( Eriksson et al.,2002). Personal care products are usually found in bathroom greywaters while detergents are the main constituents of laundry greywaters. Several technologies have been developed for greywater treatment and reuse in the literature (Winword et al., 2008) including natural treatment systems (Gross et al.,2007), basic coarse filtration (Kim et al.,2007, chemical (Winword et al.,2008) and biological processes (Merz et al., 2007).
2.3 Greywater characteristics
Greywater treatment is a prerequisite for reuse; treatment requirements vary based on biological and chemical characteristics and intended use of treated greywater. The aim of treatment is to overcome on all problems, which are caused by pathogenic microorganisms such as P.aeruginosa, E.coli and coliphage MS2, chemical compounds such as organic matter (soluble and solid), nitrogen, phosphorus, to meet reuse standards. The variation in chemical and microbial quality of greywater depends on source types. The chemical characteristics of greywater and bathroom greywater are presented in Table 2.1. Greywater pollutants, measured as COD, have, depending of the sources, an anaerobic and aerobic biodegradability of respectively 72-74% (Elmitwalli and Otterpohl, 2007; Zeeman et al., 2008) or 84±5% (Zeeman et al., 2008) or 33% (Chaillou et al.,2011). Furthermore, 27-54% is dissolved, 16-23% colloidal, and 28-50% suspended (Elmitwalli and Otterpohl, 2007; Zeeman et al., 2008). Greywater can contain recalcitrant organic matter (Friedler et al., 2006; Hernandez et al., 2007). For example anionic and cationic surfactants are slowly or non-biodegradable under anaerobic conditions (Garcia et al., 1999; Matthew et al., 2000). This compares with 2.2±0.6 for typical domestic sewage and 3–10 for final effluent and indicates that greywater is likely to contain a higher non biodegradable content than sewage (Metcalf and Eddy, 1991). Storing greywater for 48 hours at 19 to 26 ºC deteriorates its quality, (Dixon et al., 1999); biological
37
degradation produces malodorous compounds, causing an aesthetic problem (Kourik, 1991; van der Ryn, 1995; Christova-Boal et al., 1995; Dixon et al., 1999), pathogen growth (Christova-Boal et al., 1995; Rose et al., 1991; Dixon et al., 1999) and mosquito breeding (Christova-Boal et al., 1995), which are a health threat.
Paremeter Unit
(a)
Typical Greywater (b)Bathroom Greywater
Range Mean Range Mean
Suspended solids Mg/L 45 - 330 115 - - Turbiditiy NTU 22 - >200 100 9-68 28 BOD5 Mg/L 9 - 290 160 NA NA COD Mg/L 100-633 456.7 116-233 170 Toal Nitrogen Mg/L 2.1-31.5 12 2.5-33 14 Total Phosphorous Mg/L 0.6-87 8 - 0.27 pH - 6.6-8.7 7.5 7.6-7.9 7.8 Conductivity mS/cm 325-1140 600 360-465 399 a
Based on Jeppersen and Solley (1994)
b
Table 2.1. Typical composition of greywater compared with bathroom greywater
Based on Khalaphallah,et al.(2011) ; NA – Not Applicable
However, the most important facet of greywater with regard to biodegradation is its nutrient imbalance. COD:N:P ratio for the bath, shower and hand basins sources were averaged at 100:2.25:0.06, 100:2.91:0.05 and 100:1.77:0.06 respectively. Greywater has a significantly lower concentration of inorganic nutrients (N and P) which can limit biological treatment of this material (Jefferson, et al., 2001). Comparison with the literature suggest ratios between 100:20:1 (Metcalf and Eddy, 1991), 250:7:1 (Franta et al., 1994) and 100:10:1 with trace sulphur (Beardsley and Coffey, 1985) indicating that greywater is deficient in both nitrogen and phosphorus in roughly equal proportions. The nitrogen and phosphorus deficiencies are to be expected as the majority of nitrogen compounds are excreted into the toilet bowl during urination and so not normally expected in greywater. Similarly most phosphorus originates in detergents used in washing powders and so will only be present if the laundry is included in the source waters. Turbidity profiles were similar to the solids concentrations with suspended solids to turbidity ratios of 1.04, 0.96 and 0.93 which is much lower than normally observed for sewage or potable water systems but is only slightly lower tertiary effluent (Metcalf and
38
Eddy, 1991). Zinc was also included as levels approaching or above the guideline values for irrigation have been found in greywater (Christova-Boal, 1996; Hypes, 1974). The very high concentration sources are normally related to either clothes washing operations such as washing machines or hand washing or kitchen sinks (Eriksson et al., 2002). Greywater characteristics also vary according to source: each fixture contributing to the greywater collection system will carry its own particular contaminant load. Friedler (2004) recommends excluding fixtures like the kitchen sink and dishwasher from a greywater system because they constitute only 25-30% of greywater volume but contribute nearly half of its COD content. For this reason, the least contaminated streams of household greywater are usually prioritized for reuse.
Treatment is therefore required (Eriksson et al., 2002) and the treatment level depends on the reuse options (Pidou et al., 2007). A larger fraction of the organic load in greywater is poorly biodegradable (soaps, greases, etc.) giving greywater a higher COD:BOD ratio than domestic sewage (COD:BOD ratio as high as 4:1) (Sayers, 1998; Brandes, 1978; Christova-Boal , 1996). Greywater has a significantly lower concentration of inorganic nutrients (N and P) which can limit biological treatment of this material (Jefferson, et al., 2001). A biological treatment system is appropriate for stabilizing the organic matter (Nolde, 1999; Jefferson et al., 1999; 2004). Biological oxygen demand varied widely (BOD) 410-6250 mg L-1 (Kiplagat Kotut et al., 2011). Greywater treatment does not aim at providing water of drinking water quality but at water for toilet flushing, laundry, lawn irrigation, windows and car washing, ground water recharge, or fire extinguishing (Jefferson et al., 1999; Eriksson et al., 2002). Finally, both the quantity of greywater generated per day and the composition of the greywater fluctuates greatly depending on the geographical location, demographics and level of occupancy of the household (Jefferson, Judd, and Diaper, 2001; Olsson, Karlgren, and Tullander, 1968). Greywater characteristics also vary according to source: each fixture contributing to the greywater collection system will carry its own particular contaminant load. The WHO (2006) guidelines for reuse of grey water for irrigation are combined with guidelines for safe practice; e.g. applying drip irrigation techniques, covering the soil with mulch, avoiding contact with wet soil.
39
The focus of most microbiological characteristics of household greywater have received much attention in recent research (Burrows et al. 1991, Birks et al. 2007, Cassanova et al. 2001, Dixon et al. 1999, Ottosson 2003, Rose et al. 1991). The pollution loads in greywater are known to be highly variable (Jefferson et al. 2004) but dark greywater is typically more polluted (Friedler, 2004). To illustrate, COD values range from 100 to 645 mg.L-1 in light greywater and from 361 to 1815 mg.L-1 in dark greywater. Because of their capacity to cause human illness, microbial pathogens are often considered the most significant health concern associated with greywater reuse. At their lowest, the water quality parameters for greywater compare to a poor quality treated wastewater, and at their highest, they are comparable to untreated wastewater entering a sewage treatment facility. Rose, et al. (1991) found that the total coliform count of used shower water was higher than that of laundry wash and rinse water, averaging respectively 105, 199, and 56 CFU/100mL. Ottosson and Stenstrom, (2003) outlines the full spectrum of hazardous microbial agents potentially present in household greywater and provides an outline for assessing the health risks they represent (Table 2.2).
Table 2.2 Reported numbers of indicator bacteria in greywater (log10. mL-1) (Ottosson and
Stenstrom, 2003)
Data for indicator bacteria in greywater varies greatly, with total coliform concentrations ranging from as low as 1.7 log10.100mL-1 (Rose et al., 1991; Dixon et al., 1999) up to 8.8
log10.100mL-1 (Gerba et al., 1995). Total coliform ranges reported for individual bathroom
and laundry streams are similar at 1.7 to 5.8 log10. 100mL-1, whereas combined bathroom
streams are generally higher at 2.7 to 7.4 log10.100mL-1 (Christova- Boal et al., 1996; Dixon
et al., 1999; Birks et al., 2004). The pathogen population of greywater from the shower, bath, wash basin, and washing machine will include those pathogens colonizing the body surface
40
and orifices such as the nose and mouth. Faecal contamination of greywater is common, meaning that enteric pathogens may be present in greywater. (Ottoson and Stenström 2003) estimated the faecal load of greywater from all streams combined to be 0.04g.person-1.day-1. In general, the number of faecal coliforms in greywater is low unless greywater is generated from washing nappies or clothes contaminated with faeces or vomit (Jeppesen and Solley, 1994). This suggests that the numbers of harmful pathogens are also low.
2.3.1.1 Pathogenic microorganisms and indicator bacteria in Greywater
Pathogens bacteria essentially exist in the greywater fraction if contaminated by faeces. Still, the greywater environment is favorable for bacterial growth which means that it needs to be treated before reuse. Furthermore, untreated greywater easily turns anaerobic (its oxygen is depleted) and thus creates foul odors. The focus of most microbiological analysis has been on fecal pollution and enteric pathogens. Rose et al., (1991) reported total coliform concentrations in greywater ranged from 104–106 CFU.100 mL-1. Cassanova et al., (2001) found higher concentrations and reported a mean of 8.03 107 CFU 100 ml-1 in their study of greywater. On the other hand, Siegrist et al., (1976) found total coliforms in the range of 101 - 104 CFU 100 ml-1 and Burrows et al. (1991) reported concentrations as low as 85 CFU 100 ml-1
In addition to enteric pathogens, there are several human-associated opportunistic pathogens, such as Staphylococcus aureus and Pseudomonas aeruginosa (Figure 2.4), which was reported by Casanova et al., (2001) who analyzed twenty greywater samples from a single household over a seven-month period for P. aeruginosa and S. aureus.
(range 85- 890,000) in a study of laundry greywater.
The average concentrations of indicator bacteria in greywater are similar to those of secondary treated wastewater effluent, with median total coliform values of 4.7 log10.100 mL -1
for greywater. E. coli is reported in almost all of the literature studies and in all types of greywater stream, demonstrating that faecal contamination of greywater is not an occasional occurrence but is to be expected. Concentrations of E. coli (Figure 2.3) in greywater are also comparable with those of secondary treated wastewater effluent, although slightly higher, with median values of 3.3 log10.100mL-1. There is great variability in the concentrations of
indicator bacteria reported in the literature for different greywater streams and between different studies examining similar greywater streams.
41
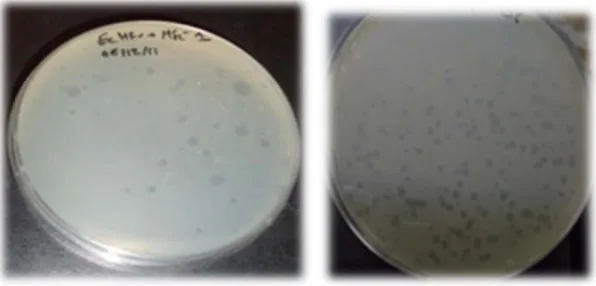
Figure 2.3. Escherishia coli colonies on TTC7 petri dishes media
Pseudomonas aeruginosa is ubiquitous being widely distributed in aquatic and terrestrial habitats. It can be found in the gut of many warm-blooded mammals, although it is not a dominant member of the intestinal microbiota. It is even able to proliferate in distilled water. Concentrations of P. aeruginosa in sewage may exceed 105 CFU.100 mL-1 (Howard et al., 2004). While usually not a significant risk to healthy individuals, P. aeruginosa (Figure 2.4) has been associated with cases of folliculitis, dermatitis, and ear and urinary infections. In addition, it causes 10–11% of all nosocomial infections in hospitals and has the highest fatality rate of all hospital-acquired bacteremias (Ayi and Dworzack, 2004).
42
Several attempts have been made to identify specific pathogenic microorganisms within grey water but no real trends have been observed. Candida albicans, Pseudomonas aeruginosa and Straphylococcus aureus have been identified but are commonly found in the mouth, nose and throat of humans (Eriksson et al., 2002). The detection of these pathogens in greywater requires an affected individual contributing to the greywater tested, which is more probable with a larger contributing population (Birks et al. 2004). However, the greywater produced by a larger contributing population will dilute enteric pathogens, resulting in lower concentrations and requiring sampling of large quantities of greywater for pathogen detection. Higher concentrations of specific pathogens in greywater are more likely to occur in smaller reuse schemes due to a lower dilution effect. The demographic of the contributing population has also been shown to affect the microbiological quality of greywater. Households with young children have been shown to produce greywater with higher levels of total and faecal coliforms than households with no children (Rose et al., 1991; Casanova et al., 2001). For example, Rose et al. (1991) reported average total coliform concentrations of 5.5 log10.100
mL-1 in greywater produced by families with young children, compared to around 2 log10.100
mL-1 for households with no children. A further important issue is whether pathogens in greywater regrow or die-off during storage time.
2.3.1.2 Bacteriophages
Viruses are small infectious particles, typically 20– 200 nm consisting of a nucleic acid core (single or double stranded RNA or DNA) enclosed by a protein coat (capsid) and in some cases a lipid envelope (Singleton and Sainsbury, 2002). Bacteriophages are viruses that infect bacterial host cells and are harmless to humans. Many enteric viruses are more resistant in the environment, as well as to different treatments, than bacteria. They are also smaller, which assigns them different transport features. Therefore bacteriophages have been suggested as indicator organisms to predict the presence and behavior of enteric viruses in the environment (Havelaar et al., 1991). Contact with the host cell occurs by passive diffusion. Phage adsorption and entry are mediated by specific receptors such as carbohydrates, proteins and lipopolysaccharides on the surface of the host cell (Marks and Sharp, 2000). Bacteriophages used as indicators for faecal pollution have been divided into three groups: the first group, Somatic coliphages, infecting various E. coli and related strains by attachment to the cell wall as the first step in the infection process, are used as an indicator of faecal contamination as
43
well as an index organism for virus reduction over treatment and in sediments. Somatic coliphages were analysed by the double agar method (Adams, 1959) according to (ISO 10705-2, 2000). For potential enteric virus contamination of recreational waters, ground water, drinking water and shell fish (Lees, 2000; Baggi et al., 2001; IAWPRC, 1991). The second group; F specific RNA bacteriophages are capable of infecting bacteria possessing the F-plasmid (sex plasmid) by adsorption to the F-pili as the first step in the infection process. Their presence indicates pollution by wastewater contaminated by human or animal faeces (Havelaar et al., 1986). F-specific RNA bacteriophages were analyzed by the double agar method (Adams, 1959) according to (ISO 10705-1, 1995 Figure 2.5). The third group; Phages infecting anaerobic bacterium Bacteroides fragilis attach to molecules in the cell wall of host bacteria as the first step in the infection process. Bacteriophages are highly abundant in the aquatic environment ranging from 104 ml-1 to in excess of 108 ml-1 (Bergh et al., 1989). Numbers are typically 3–10 times greater than the bacterial counts, although there is substantial variation between ecosystems (Weinbauer, 2004). A relationship with bacterial numbers and activity implies that the majority of aquatic viruses may be phages. Furthermore, numerous viral abundance studies show seasonal (Bergh et al., 1989; Cochran and Paul, 1998; Hofer and Sommaruga, 2001) and diet variations (Jiang and Paul, 1994; Weinbauer et al., 1995). Early studies (Dias and Bhat, 1965) indicated that E. coli phages (coliphage) were not functional in laboratory scale activated sludge systems. Within 2 h of aeration coliphage abundance declined 10-fold from 2460 to 230 PFU ml-1, stabilizing thereafter for a further 23 h. Coliphages infectious for Enterobacteria present in wastewater, are removed during activated sludge treatment (Bitton et al., 1999). Over many year E .coli and fecal streptococci have used as indicators for viral pollution. But there have been cases when epidemics have occurred even when the microorganism indicators were removed fully from the effluents. In 1974, this idea led some authors to suggest that coliphages might serve as indicators of fecal pollution. (Berrego et al., 1986) developed a highly specific, sensitive and rapid technique for detection of E.coli.
44
Figure 2.5. Coliphage MS2 plaques by double layer agar on TYG agar media
2.3.1.3 Pathogenic microorganism parameters
2.3.1.3.1 Particle cell size distribution
Nutrient availability is one of the strongest determinants of cell size. When grown in rich media, single cell organisms such as yeast and bacteria can be up to twice the size of their slow growing counterparts. The size distribution of microbial cells provides objective and valuable information on molecular mechanisms of cell division. Moreover, it can be used to test various hypotheses regarding the replication cycle of prokaryotes (Bernander & Nordstrom, 1990; Keasling et al., 1995; Koch, 1993). Cell size variation is also a sensitive parameter reflecting the physiological and molecular-genetic state of a microbial population, e.g. it can change due to the number of plasmid copies in the recombinant strains (Lyncha et al., 2000) or the temperature shock (Scherbaum, 1956), osmotic stress (Elmoazzen et al., 2005) or various pollutants (Biggs et al., 1978; Ting et al., 1991). Therefore, the analysis of size distribution has numerous applications in biotechnological, biomedical and environmental research
45
2.3.1.3.2 Electrostatic charges on the cell surface (Zeta potential measurement)
The electrokinetic potential (zeta potential, Z) is the potential drop across the mobile part of the double layer that is responsible for electrokinetic phenomena, for example electrophrosis (motion of colloidal particles in an electric field). It is assumed that the liquid adhering to the solid (particle) surface and the mobile liquid are separated by a shear plane (slipping plane). The electrokinetic charge is the charge on the shear plane (Stumm, 1992). At the interface between a charged surface and an electrolytic solution, it exist a solution layer called double layer, it has different properties than an electrolyte. This layer is constituted by the compact layer corresponding to adsorbed ions in the surface of the solid in the way of the mono-layer of Langmuir, and the diffuse layer. Several models have been elaborated to describe the charge evolution (σ0) and the surface potential (Ψ0) of the double layer, and it is the triple layer model that allows understanding the zeta potential signification (Stumm and Morgan, 1996). The triple layer model was introduced in 1947, the compact layer in sub divided in two parts (Figure 2.6). The first part is placed between the surface and the Helmholtz Internal Plane (HIP). Just one layer or the ions that present a high interaction with the surface can be received, and they loss partially or totally their hydration sphere (internal sphere complexes). The center of these ions is located at HIP level. The second part is between the HIP and the Helmholtz external plane (HEP) and it does not take into account the hydrated ions retained by the electrostatic forces (extern sphere complexes).
One of the common methods to determine a microorganism's net electric charge is to obtain its electrophoretic mobility, which is a measure of the microorganism's movement in a solution when subjected to an externally applied electric field (Richmond and Fisher, 1973). The isoelectric point or the zeta potential or the electrophoretic mobility at pH 4 usually characterizes the surface charge of bacteria (Krekeler et al., 1989). It is possible to calculate the surface charge density of a microorganism from its zeta potential (Adamson, 1960; Brinton and Laufer, 1959). However, most researchers use only zeta mobility data, because of the uncertainties regarding several factors needed for the calculations. Experiments employing isoelectric equilibrium analysis have shown that the number of net negative charges on unmodified cells of Escherichia coli was tens of thousands per cell (Sherbet and Lakshmi, 1973). No fundamental differences between the isoelectric point of positive and
Gram-46
negative microorganisms were observed (Krekeler et al., 1989). The surface charge on biological particles can also be characterized by colloid or polyelectrolyte titration.
Figure 2.6. Triple layer zeta model.
This method is based on the fact that polyelectrolytes of opposite charge form complexes in a stoichiometric way and the endpoint of the complex formation can be determined colorimetrically by using indicators (Krekeler et al., 1989). Through utilizing this method Noda, et al., (1984) determined the surface charge of Micrococcus luteus, and Van der Wal, et al., (1997) found that the cell wall charge density in Gram-positive bacteria can be as high as 0.5-1.0 C/m. However, the accuracy of this method is usually not sufficient and, thus, colloid titration finds limited applications. Another popular method for investigating the bacterial charge is by electrostatic interaction chromatography. This method is simpler than the zeta potential measurement and can be used to examine interactions on parts of the cell surface, i.e., to determine localized charges (Hermanssonvet al, 1982). It has been noted, however, that electrophoretic measurements and interaction chromatography give different data about the surface charges on the bacteria (Hermansson et al., 1982; Jones et al.,, 1996).
47
2.4. Greywater treatment and microorganisms’ survival
In order to minimize potential negative impacts, it is strongly recommended that greywater be treated before reuse. Treatment systems for greywater exist in many forms, varying in their complexity, treatment method, and location within or outside the home, and should be designed in accordance with greywater source, quality, site specifications, and reuse patterns. Greywater treatment systems range in sophistication from simple branched-drain garden irrigation networks to full tertiary treatment systems that can filter water to nearly potable levels of quality. While greywater treatment is a relatively new concept now, it has been practiced for several years in places where water is less abundant or expensive to use. In the southern US, Australia, and many Middle Eastern countries, simple greywater diverting schemes are common as a means of irrigating landscape plants in arid regions. Many different treatment mechanisms have been studied, with varying degrees of success. Nolde (2000) recommends aerated biological treatment, while Pidou et al. (2007) received good results with chemical treatment involving coagulation and magnetic ion exchange. Hernandez-Leal et al. (2007) experimented with anaerobic greywater treatment in their study and found it less effective than comparable aerobic processes, likely because of the interference of surfactants with anaerobic bacteria. Whatever the treatment method, complete system design ideally includes a tertiary disinfection stage, usually either chlorine or UV radiation, to protect against bacterial regrowth in treated water. To date, there is no generally accepted design for greywater treatment systems, but several manufacturers around the globe provide plug-and-go solutions for homeowners, indicating that some private sector researchers may have found effective, safe solutions for greywater recycling.
2.4.1 Effect of abiotic factors on survival growth of bacteria
The influence of factors on the survival of bacteria in water is still not well understood despite the large number of studies which have previously been carried out. Nevertheless, several factors have been proposed as making a significant contribution to the decline of bacteria in the aquatic environment, though their relative importance is not always agreed upon by the various authors. At the risk of duplicating the efforts of many previous investigators, the most frequently documented factors are discussed in this chapter. Existing reviews on this subject
48
are numerous (Waksman & Hotchkiss, 1937; Greenberg, 1957; Carlucci & Pramer, 1959; Jones, 1971; Mitchell & Chamberlin, 1975, 1978; Elliot & Colwell, 1985). Carlucci and Pramer (1959) summarized the major factors which influence the decline of enteric bacteria in water. These factors are: temperature, available oxygen, salinity and nutrients compositions.
2.4.1.1 Temperature
Every microbe requires optimal temperature for its metabolic rates. Whenever temperature increases metabolic rate of microbe decreases and dies. In low temperature microbes will be in inactive form. It doesn't die but stay dormant. Extremes of temperature seem to be most disruptive to bacterial survival (McFeters et al., 1974; Flint, 1987). Several investigators have noted that at lower temperatures bacteria survive longer than at higher temperatures, in fresh waters (McFeters & Stuart, 1972; Auban et_al., 1983; Barcina et al., 1986a), in estuarine waters (Faust et al., 1975; Vasconcelos & Swartz, 1976) and in marine waters (Pike et al., 1970; Evison & Tosti, 1980). Pike et al. (1970) or Mancini (1978) commented on the direct relationship which appeared between temperature and die-off rates of coliforms in fresh and sea water laboratory experiments under conditions of darkness. Mortality rate increases linearly with increasing temperature between 4° C and 24°C for faecal coliforms in seawater in the dark (Gameson, 1984). That survival is inversely proportional to temperature has been reported over a number of temperature ranges (McFeters & Stuart, 1972; Faust et al., 1975; Evison & Tosti, 1980). Survival of bacteria decreases with increasing temperature (Kristiansen et al 1981, Stenstre et al 1982, Ostrolenk et al 1947, Shah et al 1994). Incubation of E. coli in soil at 5°C, 10°C, 20°C and 37°C showed best survival at 5°C (Sjogren et al, 1994). In a survival experiment with Pseudomonas sp. in soil, Vandenhove et al, (1991) found no difference between 5°C and 15°C, but a significant reduction of the bacterial number at 25°C. However, conflicting evidence demonstrating prolonged survival of E.coli and salmonella in sterile and non-sterile estuarine waters at warm temperatures (>18° C) has been presented (Rhodes & Kator, 1988) suggesting that survival is directly proportional to temperature, an observation which supports those previously made by Anderson et al. (1983). It is believed that temperature exerts its effect on survival through its influence on other factors (EPA, 1985) and also through its control of the metabolic rate of cells (Jones, 1971). At 45° C cells have long since stopped functioning, with major organ failure occurring at much lower temperatures, making this temperature pathogenically irrelevant (Nguyen, 2006). In sterile waters, the inverse relationship between survival of E.coli and temperature is not
49
apparent (Barcina et al., 1986). Anderson et al. (1983) found that survival of E.coli is directly related to temperature in the absence of eukaryotes. These workers concluded that the interactions between experimental bacteria and autochthonous organisms and the occurrence of sublethal stress may account for the discrepancies in temperature-related survival data. Evidence in support of this was obtained by (Flint 1987) who concluded that though temperature was a major factor affecting the survival of bacteria introduced into the natural environment, its importance is secondary to that of biotic influences. Undoubtedly, temperature is still considered by many to contribute significantly to bacterial die-off in the environment. The influence of this factor should be considered in connection with the time of year and location of release of bacteria into the environment.
2.4.1.2 Nutrient deficiencies
Nutrition is the provision to cells and organisms, of the materials necessary to support life. Many common health problems can be prevented or alleviated with a healthy diet. The study of nutrition is increasingly concerned with metabolism and metabolic pathways: the sequences of biochemical steps through which substances in living things change from one form to another. Alexander (1986) suggested that in addition to susceptibility to antagonistic and predative agents, nutrient deficiencies may beresponsible for the decline of thosebacteria which are relatively resistant to the effects of abiotic factors. Increased survival of bacteria has been attributed to the nutrient content of the water (Slanetz & Bartley, 1965; Hendricks, 1972; Yanagita & Takagi, 1980). When seawater was supplemented with inorganic salts and organic matter, the decline of Escherichia coli was reduced (Carlucci & Pramer, 1960). This effect was found to be even more pronounced in freshwater (Hendricks, 1972). The addition of amino acids to freshwater could increase survival of E.coli up to 3 fold. The addition of ammonium or nitrate has a limited effect but no carbon or phosphorus source is effective to the same degree (Lim & Flint, 1989). The chemical composition of water greatly influences the survival of enteric bacteria. The composition of seawater varies much less than that of freshwater (Mitchell & Chamberlin, 1978). The type and concentration of nutrients available have different effects on different species, for example, the addition of peptone to E.coli in seawater increases its survival but the addition of glucose reduces its survival (Carlucci & Pramer, 1960). E.coli and other coliforms require only low concentrations of organic matter to grow, whereas faecal streptococci require much higher concentrations (Allen et al., 1952).