Titre:
Title:
Combined extraction and functionalization of low-cost nanoparticles
from municipal solid waste fly ash through PICVD
Auteurs:
Authors:
Donya Farhanian, Christopher Alex Dorval Dion, Wendell Raphael,
Gregory De Crescenzo et Jason Robert Tavares
Date: 2014
Type:
Article de revue / Journal articleRéférence:
Citation
:
Farhanian, D., Dorval Dion, C. A., Raphael, W., De Crescenzo, G. & Tavares, J. R. (2014). Combined extraction and functionalization of low-cost nanoparticles from municipal solid waste fly ash through PICVD. Journal of Environmental Chemical Engineering, 2(4), p. 2242-2251. doi:10.1016/j.jece.2014.09.019
Document en libre accès dans PolyPublie
Open Access document in PolyPublieURL de PolyPublie:
PolyPublie URL: http://publications.polymtl.ca/2781/
Version: Version finale avant publication / Accepted versionRévisé par les pairs / Refereed Conditions d’utilisation:
Terms of Use: CC BY-NC-ND
Document publié chez l’éditeur officiel Document issued by the official publisher
Titre de la revue:
Journal Title: Journal of Environmental Chemical Engineering Maison d’édition:
Publisher: Elsevier URL officiel:
Official URL: https://doi.org/10.1016/j.jece.2014.09.019 Mention légale:
Legal notice: "In all cases accepted manuscripts should link to the formal publication via its DOI"
Ce fichier a été téléchargé à partir de PolyPublie, le dépôt institutionnel de Polytechnique Montréal
This file has been downloaded from PolyPublie, the institutional repository of Polytechnique Montréal
1
Combined Extraction and Functionalization of Low-Cost Nanoparticles from Municipal Solid 1
Waste Fly Ash through PICVD 2
D.Farhanian, C.A.Dorval Dion, W.Raphael, G.De Crescenzo, J.R.Tavares∗ 3
Department of Chemical Engineering, Ecole Polytechnique de Montreal, C.P. 6079, Succ. Centre-Ville, 4
Montreal, Quebec, Canada, H3C 3A7 5
6
Abstract 7
While nanoparticles have been the focus of intensive research for several years as a result of their 8
remarkable surface-driven properties, they remain, for the most part, stuck in the lab. This unfortunate 9
fact can be explained by three main reasons: (1) most studies have not dealt with the scalability and cost 10
issues related to the use of nanomaterials on an industrial scale; (2) a great deal of focus has been applied 11
to “outlier” results that promise far more than can be delivered; and (3) very little attention has been given 12
to surface engineering. We propose to curtail the significant cost issue by extracting low-cost, low-grade 13
nanoparticles that are appropriate for several applications from a ubiquitous and abundant feed stock: fly 14
ash from municipal solid waste (MSW) incineration. The novel technique we apply is capable of both 15
extraction and functionalization of the nanoparticles present in this undervalued waste stream using 16
photo-initiated chemical vapor deposition (PICVD). By setting functionalization conditions to favor 17
hydrophilic surface properties, the treated ash can readily be dispersed in a polar solvent such as water: 18
larger particulates then settle out of suspension, while the lighter nanoparticles remain in the supernatant 19
and are ready for use. While it is true that this method yields low-grade nanoparticles (polydisperse and 20
multi-composite), these can be used in a variety of applications where composition is less crucial, such as 21
increasing the thermal conductivity of composites and nanofluids. 22
Keywords: PICVD, Nanoparticles, Functionalization, Surface functionalization, MSW fly ash 23
Nomenclature 24
MSW Municipal Solid Waste 25
PICVD Photo-Initiated Chemical Vapor Deposition 26
PECVD Plasma Enhanced Chemical Vapor Deposition 27
TEM Transmission Electron Microscopy 28
2
EDS Energy-Dispersive X-ray Spectroscopy 29
FTIR Fourier Transform Infrared Spectroscopy 30
∗Corresponding author: [email protected]
31 32 33
1. Introduction 34
Even if nanoparticles are omnipresent in research laboratories, the cost of these advanced materials 35
remains a limiting factor to their widespread implementation. While the usage of expensive, pure and 36
spherical nanoparticles made from exotic materials can be justified for some high-end applications like 37
drug carriers and microelectronics, some more modest applications call for cheaper sources of 38
nanoparticles [1, 2]. In the hope of finding cheaper alternatives, attention has recently been paid to 39
unconventional sources of ultrafine powders, such as ash from the incineration of municipal solid waste 40
(MSW), coal, cane or oil shale [1, 3-8]. Indeed, several studies focused on the type and level of 41
nanoparticles present in the ash residues [1, 9-11]. Such interest is mainly justified because the 42
accumulation of large quantities of ash is becoming a serious environmental problem [5, 12-16]. Both 43
MSW and fly ash are considered as renewable resources due to their valuable materials content [3, 13, 15, 44
17, 18]. They also constitute an important debate due to their toxicity, causing important cardiopulmonary 45
diseases at low concentrations [16, 18-20]. 46
The interesting aspect of using fly ash is that it does not really have any value on the market, since it is 47
currently disposed of in landfills or used in cements [5, 18]. However, valorization through use as a 48
cement additive or filler is still in development in the case of MSW fly ash. Indeed, many jurisdictions do 49
not allow its use because of its potential hazardous materials content. For jurisdictions where it is 50
permitted for use as a supplementary cementitious material (SCM), additional long-term durability testing 51
is underway [21-24]. Furthermore, it must be taken into account that if fly ash is affordable, it is far from 52
being usable as is for many reasons: (1) the substances are not pure, (2) the chemical composition is 53
variable (particularly if sourced from MSW) and (3) the particle size distribution is wide and variable. 54
The use of fly ash also restrains the selection of materials available; indeed, it often contains minerals 55
such as illite, kaolinite, chlorite, calcite, alumina and quartz; in other words, metals are present in 56
oxidized form [6, 16, 18]. Indeed, the composition can vary according to the source of the ash, but typical 57
compositions are silica (49-64 % wt), alumina (14-30 % wt), iron oxide (6-23 % wt) and CaO (1-7 % wt) 58
3
[1, 5, 6, 12, 13]. That means that the intended end-use must either encourage the use of such minerals and 59
derivatives, or not be sensitive to the nature of the material at all. An example of the former would be any 60
usage that is suited to silica (SiO2), which can be used as an additive to cement [3, 4] or rubber matrices 61
[13, 25] to improve their mechanical properties, or as an adsorbent and catalyst support due to its physical 62
chemistry properties [11, 19]. On the other hand, MSW fly ash contains some valuable materials 63
including As, Al, B, Ba, Cd, Cr, Cu, Hg, Mn, Mo, Ni, Pb, Sb, Se, Zn, in oxidized or ionic salt form [26, 64
27]. In case the composition is not a problem, these nanomaterials can be used in order to increase the 65
overall thermal conductivity of the composites [28-30] and nanofluids [31-33]. For applications more 66
sensitive to particle size distribution or chemical composition, the nanomaterials can be further treated 67
before use, through size segregation [2, 32, 34] or chemical treatment [2, 29, 30, 35]. 68
Recently, several studies focused on implementation of nanoparticles as filler in production of composite 69
using in situ polymerization technique [29, 30]. However, there are some challenges in composite 70
fabrication using nanoparticles: (1) introduction of good chemical bonds between polymer and nanofiller, 71
and (2) homogeneous dispersion of nanofillers due to their agglomeration [29, 30]. These challenges can 72
be resolved using chemically engineered (functionalized) nanoparticles [28-30]. 73
These recent studies clearly demonstrate that nearly all raw nanomaterials need to be surface 74
functionalized prior to incorporation into matrices. While a vast amount of energy has been spent on 75
extraction of nanomaterials from ash, no one seem to have addressed functionalization. Our group is 76
mainly concerned about the feasibility of combining extraction and functionalization with existing 77
processes to generate nanoparticles. The process proposed to chemically transform the material is usually 78
by sol-gel techniques, which seem hardly scalable due to significant use of acidic solutions and 79
subsequent wastewater control [17, 18, 27]. Our group previously identified photo-initiated chemical 80
vapor deposition (PICVD) as a potential affordable and scalable technology for the surface 81
functionalization of nanoparticles [36]. This technique had been applied in our research group for the 82
functionalization of copper (Cu) coupons using syngas and UVC lamps [37]. Subsequently, by 83
considering the applications where composition is less crucial, such as nanofluids, our group investigated 84
to see if such a surface treatment could be sufficient to recover ready-to-use nanoparticles from fly ash. 85
This study proposes a novel method for the single-step extraction and functionalization of nanoparticles 86
from a low-value raw source, municipal solid waste (MSW) incineration fly ash, using PICVD for 87
functionalization. 88
2. Materials and Methods 89
4
MSW fly ash was provided by the Quebec City MSW incinerator. This waste residue is selected in order 90
to verify the effectiveness of our process for what we consider to be the most difficult class of fly ash to 91
treat, as it has the widest range of particle sizes and materials composition. Thus, it will demonstrate the 92
range and versatility of our process. Ash powder was sieved using meshes with 300 µm, 150 µm, and 75 93
µm size. Then, 1 g of ash powder from the less than 75 µm fraction was used for the experiments. The 94
PICVD technique was then applied for functionalization of particles in ash samples. 95
96
2.1. PICVD Experimental Apparatus 97
Figure 1. shows the schematic of the experimental apparatus. The PICVD unit consisted of: two 254 nm 98
UVC mercury or germicidal lamps as an initiation source (Cole-Parmer) and a 45 cm long quartz reactor 99
using standard 24/40 taper joints (Technical Glass Products). The UVC lamps had a main peak at a 100
wavelength of 254 nm. Syngas (CO and H2) was used as the functionalization precursor (CO: Pur T-44 101
and H2: UHP T-30 - Air Liquide). Although, these reactants are not in the peak absorption of UVC lamps 102
(254 nm), they can be activated at 254 nm and produce active compounds for the formation of 103
functionalized polymeric films [37]. Argon gas (HPT - Air Liquide) was used to purge the reactor before 104
experiments to remove oxygen. For some experiments, H2O2 (50% aqueous solution- Fischer Scientific) 105
was added as a photoinitiator to accelerate reaction kinetics and enhance the polymerization rate [38], this 106
was done using a syringe pump at a rate of 0.02 mL/min. Experiments were performed either under slight 107
vacuum (-10 kPa) or at near atmospheric pressure (+10 kPa) regulated by a T-valve at the end of reactor. 108
The irradiance of the UVC lamps was measured at 3.5 cm away from the lamp (in the same distance of 109
reactor from the lamps) using an ILT1700 radiometer/photometer coupled with a SED240/QNDS2/W254 110
nm sensor (International Light Technologies). The average irradiance at this distance was 5.5 × 10⁻⁴ 111
W/cm2. 112
[Figure 1 about here.] 113
114
2.2. Extraction and Functional Encapsulation of Nanoparticles from Ash powder 115
At first, 1 g of ash powder was loaded in a metal holder and inserted to the reactor. Oxygen molecules are 116
strong electron scavengers; thus, their presence will result in termination of reactions. To avoid this, 117
reactor was purged using argon gas for 5 minutes. Then, the mixture of CO: 390.1 mL/min and H2: 48.7 118
mL/min was injected into the reactor (H2/CO ratio of 12.5%) [38]. Experiments were performed either 119
5
while (1) UVC lamps were turned on, or (2) they were turned off (control experiments - syngas was 120
flowing in the reactor). Duration of experiments was fixed to 1h. Temperature inside the reactor was 121
monitored during experiments using an infrared temperature sensor. The measured temperature was 30 ± 122
7 0C. Table 1. summarizes the details of all experiments. Treated ash powders were then dispersed in 123
deionized water or acetone and the resulting samples were loaded in an ultrasonic bath for 2h in order to 124
disperse the particles. The large particulates are then allowed to settle for 24 hours before the liquid 125
supernatant was collected for analysis. 126
[Table 1 about here.] 127
128
2.3. Characterization and Analytical procedures 129
Field Emission Scanning Electron Microscopy (FESEM) (JEOL JSM7600F) were used to investigate the 130
morphology of untreated ash powder. Using the Scanning Electron Microscopy (SEM) (JEOL 840A), 131
three Energy Dispersive X-ray spectra were acquired in different regions to determine the elements 132
present in the sample. Moreover, in order to have better understanding of the compostion of ash samples, 133
elemental analysis had been performed using Inductively Coupled Plasma Optical Emission Spectroscopy 134
(ICP-OES, Thermo Scientific iCAP 6500). To do so, about 0.5 g of ash powder was digested in 5 mL of 135
hydrochloric acid and 2 mL of HNO3 solution then heated for 150 min on a hot plate at 95 °C. Then the 136
remaining solution was diluted with deionized water in 50 mL digi tubes and filtered using a 0.45 µm-137
pore PTFE filter and analyzed in ICP-OES. Two standard reference materials (Routine Quality Control 138
Solution: RQC-1 and RQC-2, SCP Science) were used to verify the analytical quality of the 139
measurements. 140
To assess which crystalline phases are present in the raw ash, untreated MSW ash powders were analysed 141
by XRD (Philipps X'Pert system) using Cu Kα radiation. Scans were conducted from 20.01 to 89.99 ° at a 142
rate of 0.02° 2ϴ/min. X'Pert Highscore (Philipps) software was used to identify possible crystalline 143
phases. 144
Dispersed solids remaining in the supernatant were analyzed using Transmission Electron Microscopy 145
(TEM, model JEM 2100F-JEOL company) in combination with energy-dispersive X-ray spectroscopy 146
(EDS). TEM was operated at 200 kV to acquire bright field images of samples. Morphology and 147
elemental analyses for extracted nanoparticles were conducted using copper (Cu) and nickel (Ni) TEM 148
grids coated with a lacey carbon film (D20040 Grids with formvar substrates mesh 400, metal Cu; 149
D20045 Grids with formwar substrates mesh 400, metal Ni-SOQUELEC International). The grids were 150
6
first soaked in the liquid samples and then in the deionized water for few seconds in order to avoid salt 151
contamination on the grids. Then, samples were dried at the room temperature 22 ± 2.5 0C and analyzed. 152
All experimental conditions were repeated at least twice and analyzed using both types of TEM grids in 153
all cases. 154
After sampling, the remaining supernatant was dried overnight at 55 0C and analyzed by Diffuse 155
Reflectance Fourier Transform Infrared Spectroscopy (DRIFTS, Thermo Scientific Nicolet 6700 ) to 156
obtain chemical information about the coating and functional organic groups. OMNIC software was used 157
to identify the corresponding peaks. Each sample was scanned 32 times with a resolution of 4.0 cm -1. No 158
addition of KBr was necessary for the analysis – samples were directly analyzed in the DRIFTS apparatus 159
to obtain FTIR spectra of solid samples. 160
161
3. Result and Discussion 162
Physical characterization: Figure 2 shows FESEM micrographs, along with accompanying EDS spectra, 163
of MSW ash powder before any experiments. This result showed that ash sample contains mainly the 164
following elements : Si, Al, O, Ca, Na, Cl, K, P, Mg, S, Ti and Fe. The SEM micrographs serve to 165
illustrate the wide size distribution of the untreated ash. 166
[Figure 2 about here.] 167
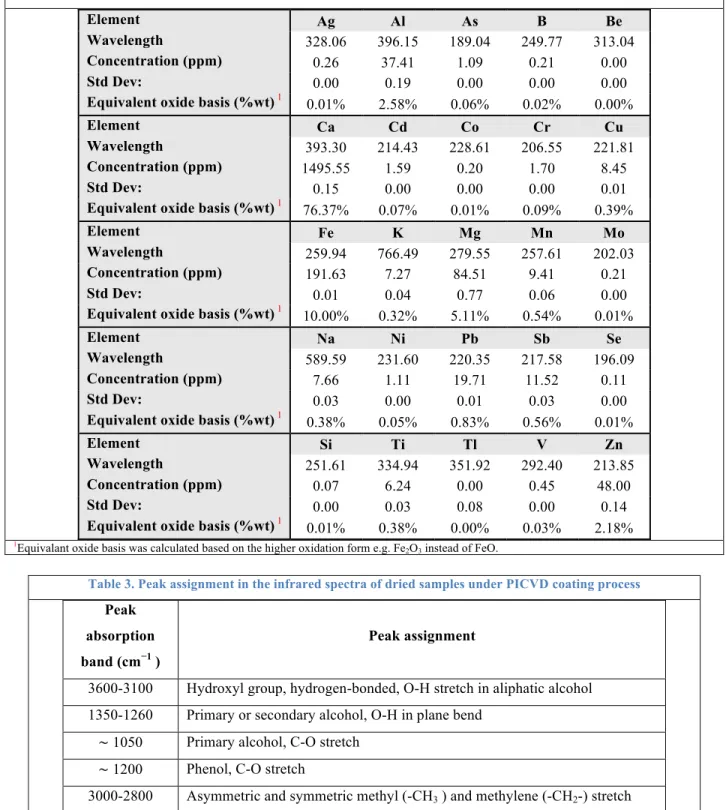
Table 2 shows the elemental concentration of untreated MSW ash powder. The rest of ash powder is 168
carbon (C) and water (H2O). 169
[Table 2 about here.] 170
XRD results of crystalline phase of MSW ash powder before any experiments can be found in Figure 3. 171
[Figure 3 about here.] 172
This result shows that MSW ash sample contains a large number of phases which makes the XRD 173
analysis quite uncertain. The large number of peaks makes it possible for many reference patterns 174
(phases) to show a high score of fit with the XRD measurement even if they are not necessarily present. 175
By using the EDS results shown in the Figure 2, we can refine the search in the database to find reference 176
patterns that match the measurement. Taking this into account, the samples contains SiO2, CaCO3 and 177
NaCl and may contain one or more of these phases : KFeO2, KAlSi3O8, CaAl2Si2O8, Al2(PO4)(OH)3 and 178
7
(Na,Ca)Al(Si,Al)3O8. It is possible and quite probable that other phases are present in this sample, but 179
were either not detected by XRD or were not identified by searching the database. 180
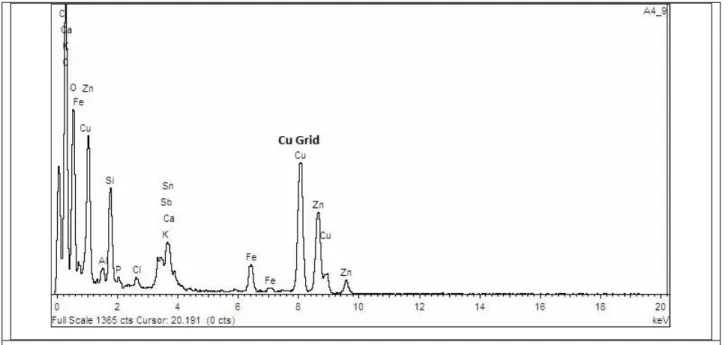
Figures 4 and 5 show, respectively, the TEM/EDS results of PICVD-untreated and treated ash samples. 181
Results for control experiment (#1, Table 1) in Figure 4 indicate that there are little or no metal 182
nanoparticles present, except Ca in oxidized form, demonstrating that there is limited potential to extract 183
useful nanoparticles without a functionalization treatment. The TEM micrograph also illustrates the 184
presence of salt (lower-contrast particulates). This by-product is contained in the ash samples, both 185
natively or as a result of the gas cleaning steps applied during the waste incineration process. 186
[Figure 4 about here.] 187
188
The TEM/EDS results of experiments #2 to #5 (Table 1) in Figure 5 demonstrate the presence of nano 189
size particles in the supernatant of treated ash samples. The nanoparticles found in these samples vary 190
based on the composition of the primary ash sample. Two types of grids had been used in order to 191
identify possible Cu and Ni nanoparticles in the samples. EDS analysis was performed on different 192
sections of the grids, confirming the presence of Si, Al, Zn, and Fe as dominant nanoparticles in all of the 193
samples, as well as Cu, Sn, Pb, and Mg. 194
[Figure 5 about here.] 195
196
Lower-contrast salt particulates were also visible for these experiments. These can be removed through 197
successive rinsing steps with water. These results show that extraction of nanoparticles either in the 198
presence or in the absence of H2O2 is possible. From treatment to treatment, the same type of 199
nanoparticles can be extracted. However, at this time, only qualitative study were performed, further 200
quantitative study is warranted. 201
Several nanofillers like copper oxide (CuO and Cu2O) [29], iron oxide (FeO, Fe2O3 or Fe3O4) [39], zinc 202
oxide (ZnO) [40], CaCO3 [28, 30], silica or silicon carbide [35, 41], and aluminum oxide (Al2O3) [42] 203
have been applied for in situ polymerization, as previously discussed. These nanoparticles can increase 204
electrical conductivity, photovoltaic properties, thermal conductivity and thermal stability of the 205
composite. Almost all of these compounds can be found in the MSW ash samples treated by our method. 206
While nanoparticles were found generally in agglomerated form, the treated agglomerates remain of 207
interest. Moreover, the facile extraction technique presents other advantages (1) it can more readilty be 208
8
implemented compared to other functionalization techniques [36], (2) it allows for the extraction of useful 209
nanoparticles allowing clean and closed industrial scale production cycles and, (3) it nonetheless allows 210
for stable dispersion of nano-sized particulates because of their functional coating. 211
As presented, our method allows for the extraction of nanoparticles with multiple components. Other 212
works have focused on the selective extraction of specific materials either by targeted acidic attack or use 213
of target flocculants [17, 18, 27]; through further work, these techniques could be combined with our 214
method. Nonetheless, the low-grade particles we can extract may find applications in various fields. 215
In order to extend the range of applications, dispersion in other solvents has been briefly studied. To do 216
so, treated ash samples were dispersed in a less polar solvent - acetone (polarity index of 5.1, compared to 217
water at 9.0 [43]). TEM/EDS results (Figure 6) showed identical nanoparticles, which demonstrates that 218
either polar (water) or semi-polar (acetone) solvents can be applied for extraction of nanoparticles. 219
[Figure 6 about here.] 220
Syngas (CO and H2) is one of the common products of gasification processes. It can be used for 221
hydrocarbon formation through the Fischer-Tropsch Synthesis (FTS) pathway. In our case, rather than 222
target recombination of long hydrocarbon chains, we aim to deposit the radicals produced in the presence 223
of UVC lamps onto substrates – the proposed reaction pathway has been discussed in our previous work 224
[37]. 225
Chemical Characterization:In order to verify this deposition, DRIFTS analysis was performed to study 226
the organic coating and identify functional groups. Figure 7 and 8 shows the DRIFTS spectra taken from 227
experiments #1 to # 6 . Table 3 represents the likely assignments of the identified peaks in the DRIFTS 228
spectra. 229
[Figure 7 about here] 230
[Figure 8 about here] 231
232
Spectra for control experiment ( Experiment #1) shows only –OH functionality due to the adsorption of 233
humidity in 3600-3100 cm-1. In the case of experiments #2 to #5, which were dispersed in water, clearly, 234
these spectra shows almost similar features and organic coating functionalities. However, the intensity of 235
functional groups is different. The very broad peaks in the 3600-3100 cm-1 range strongly indicate 236
presence of hydroxyl groups (-OH stretch from both covalently bonded hydroxyl groups and absorbed 237
9
moisture). This peak overlaps the C-H stretch around 2930 cm-1. There is also a C-O single bond band 238
near 1100-1300 cm-1 specifically in the 1000-1070 cm-1 and 1240 cm-1 ranges, which demonstrate 239
formation of primary alcoholic functional groups as well as phenol groups respectively. In the case of 240
experiment #3, the presence of peaks around 1240 cm-1 shows the formation of higher amounts of phenol 241
groups. This means a more aromatic structure was formed in this case compared to the other experimental 242
conditions. Amounts of hydroxyl groups are almost identical in the case of experiments #3, #4, and #5 243
and they are greater in these experimental conditions compared to experiment #2 and #6. In experiments 244
#3 and #5, H2O2 was used as a photoinitiator, as it can form hydroxyl groups under UVC (254 nm) 245
irradiation due to photolysis. Hydroxyl groups formed due to photolysis of H2O2 molecules can act as 246
reactive compounds and participate in chain reactions either with CO or H2 molecules or their radicals 247
[22, 38, 44, 45]. Subsequently, more hydroxyl functionality produces in the presence of H2O2 which leads 248
to a more hydrophilic coating (Equations (1) to (6)). 249 𝐻#𝑂#+ ℎ𝑣 254 𝑛𝑚 → 2 𝑂𝐻⦁ (1) 250 𝐻#𝑂#+ 𝑂𝐻⦁ → 𝐻#𝑂 + 𝑂#3 + 𝐻4 (2) 251 𝐻#𝑂#+ 𝐻⦁→ 𝐻#𝑂 + 𝑂𝐻⦁ (3) 252 𝐻#𝑂#+ 𝐻⦁→ 𝐻𝑂 #+ 𝐻# (4) 253 𝐻#+ 𝑂𝐻⦁→ 𝐻 #𝑂 + 𝐻⦁ (5) 254 𝐶𝑂 + 𝑂𝐻⦁⇋ 𝐻𝑂𝐶𝑂4→ 𝐻 + 𝐶𝑂 # 6 255 ↓ 256 𝐻𝑂𝐶𝑂 257
However, the DRIFTS results show that even slight vacuum conditions (experiments #4 and #5) can lead 258
to a similar intensity of the hydroxyl bands to that which was observed for experiments with H2O2. 259
The medium width peak at 1630-1680 cm-1 represents ketonic functionality (C=O stretch) This peak is 260
slightly lower in the case of experiments #2 compared to #3, #4, and #5 which means either in the 261
presence of H2O2 or vacuum pressure more polar functionalities were formed. On the other hand, peaks 262
around 1475-1430 cm-1 are related to the formation of aliphatic groups (-CH3 and -CH2-). Figure 7 and 8 263
suggests almost identical amounts of aliphatic groups are produced in the case of experiments under slight 264
vacuum pressure (experiments #4 and #5). However, in the case of near atmospheric pressure experiments 265
(experiments #2 and #3), more aliphatic chain forms in the presence of H2O2 (experiment #3) than its 266
10
absence (experiment #2). The C≡C stretch bands at 2260-2100 cm-1 shows the unsaturated functional 267
groups in the coating film. As Figure 7 and 8 shows, the amounts of unsaturated C≡C functionality is 268
greater in the case of experiments #2 and #3 (near atmospheric pressure) compared to the experiments #4 269
and #5 (slight vacuum pressure). Thus, it is possible to deduce that longer aliphatic chains with more 270
ketone (C=O stretch) and unsaturated alkyne groups (C≡C stretch) are produced in the presence of H2O2 271
and at atmospheric pressure (experiment #3), while at near atmospheric pressure more aliphatic groups 272
are formed. Unsaturated coatings have the possibility of undergoing further reactions to add more 273
functionality to the coating, if desired. On the other hand, slight vacuum pressure can lead to results 274
comparable to H2O2 injection, at least in terms of the presence of hydroxyl groups. The process 275
economics remain to be analyzed to compare the cost of peroxide to the cost of maintaining a slight 276
vacuum at an industrial scale. 277
In the case of experiment #6, all observed peaks are of lower intensity. This is attributed to the fact that 278
the acetone solvent was not as efficient in extracting functionalized nanoparticles, given its lower polarity. 279
In fact, qualitative inspection during TEM indicated that fewer nanoparticles were extracted. 280
281
4. Conclusion 282
Industrial waste is becoming a real challenge for today's world. Worldwatch Institute projects that the 283
amounts of MSW in the word will increase from today's 1.3 billion tons per year to 2.6 billion tons by 284
2025 due to urbanization and growing prosperity [46]. On the other hand, the high demand for the 285
production of nanomaterials is estimated to lead to a global market value of $3.3 trillion by 2018 [47]. 286
Conservative market estimates that only for metal oxide nanoparticles, consumption are expected to rise 287
from 270,041 tons in 2012 to 1,663,168 tons by 2020 [48]. In this work we applied PICVD process to 288
investigate the effectiveness of this technique for direct extraction and functional encapsulation of 289
nanoparticles from MSW fly ash powder. Syngas was used as a precursor for polymeric film deposition in 290
the presence of UVC lamps. In some of the experiments, H2O2 was injected to accelerate photochemical 291
reactions. TEM/EDS results indicate extraction of functionalized nanoparticles thus demonstrating the 292
performance of PICVD. DRIFTS analysis demonstrated formation of polymeric coating with –OH, –CH2, 293
–CH3, C–O, C=O, and C≡C. Moreover, results showed more unsaturated polymeric film forms at 294
atmospheric pressure compared to the vacuum. 295
Given the massive scale production of ash and syngas as by-products of several processes, the practical 296
implementation of these two materials for extraction of precious materials like coated functionalized 297
11
nanoparticles may have a profound impact in several industries such as waste water treatment and 298
construction materials. Subsequent research will focus on treating ash in a fluidized bed reactor, in order 299
to apply higher quantity of ash samples from different sources (coal, cane, oil shale and MSW) under 300 PICVD treatment. 301 302 Acknowledgments 303
The authors gratefully acknowledge funding support from the Fonds de recherche du Québec en nature et 304
technologies (FRQNT), the Natural Sciences and Engineering Research Council of Canada (NSERC), as 305
well as École Polytechnique de Montréal. The authors would like to thank the support of centre for 306
Characterization and Microscopy of Materials École Polytechnique de Montréal as well as Mr. Ranjan 307
Roy from the Chemical Engineering Department of McGill University. 308
Bibliography 309
[1] F. Peng, K. Liang, A. Hu, Nano-crystal glass ceramics obtained from high alumina coal fly ash, Fuel. 310
84 (2005) 341-346. 311
[2] S.M. Kulkarni, Kishore, Effects of surface treatments and size of fly ash particles on the compressive 312
properties of epoxy based particulate composites, J. Mater Sci. 37 (2002) 4321-4326. 313
[3] R.W. Styron, Fly ash composition for use in concrete mix, Google Patents, 2003. 314
[4] F.H. Gustin, H.P. Shannonhouse, R.W. Styron, Fixation and utilization of ash residue from the 315
incineration of municipal solid waste, Google Patents, 1994. 316
[5] G. M. Gao, H. F. Zou, S. C. Gan, Z. J. Liu, B. C. An, J. J. Xu, G. H. Li, Preparation and properties of 317
silica nanoparticles from oil shale ash, J. Powder Technol. 191 (2009) 47-51. 318
[6] N.R.C. Fernandes Machado, D.M. Malachini Miotto, Synthesis of Na–A and –X zeolites from oil 319
shale ash, Fuel. 84 (2005) 2289-2294. 320
[7] S.N. Azizi, S. Ghasemi, H. Yazdani-Sheldarrei, Synthesis of mesoporous silica (SBA-16) 321
nanoparticles using silica extracted from stem cane ash and its application in electrocatalytic oxidation of 322
methanol, Int. J. Hydrogen Energy. 38 (2013) 12774-12785. 323
[8] R. Shawabkeh, A. Al-Harahsheh, M. Hami, A. Khlaifat, Conversion of oil shale ash into zeolite for 324
cadmium and lead removal from wastewater, Fuel. 83 (2004) 981-985. 325
[9] M.L. Oliveira, F. Marostega, S.R. Taffarel, B.K. Saikia, F.B. Waanders, K. DaBoit, B.P. Baruah, L.F. 326
Silva, Nano-mineralogical investigation of coal and fly ashes from coal-based captive power plant (India): 327
an introduction of occupational health hazards, J. Sci. Total Environ. 468-469 (2014) 1128-1137. 328
12
[10] L.F. Silva, T. Moreno, X. Querol, An introductory TEM study of Fe-nanominerals within coal fly 329
ash, J. Sci. Total Environ. 407 (2009) 4972-4974. 330
[11] S. Sadasivan, D.H. Rasmussen, F.P. Chen, R.K. Kannabiran, Preparation and characterization of 331
ultrafine silica, J. Colloids Surf., A: Physicochemical and Engineering Aspects. 132 (1998) 45-52. 332
[12] N. Mahmood, M.S. Khan, A.U. Khan, K.W. Stöckelhuber, G. Heinrich, Purification, surface 333
modification of coal ash silica and its potential application in rubber composites, J. Appl. Polym. Sci. 117 334
(2010) 1493-1501. 335
[13] N. Sombatsompop, S. Thongsang, T. Markpin, E. Wimolmala, Fly ash particles and precipitated 336
silica as fillers in rubbers. I. Untreated fillers in natural rubber and styrene-butadiene rubber compounds, 337
J. Appl. Polym. Sci. 93 (2004) 2119-2130. 338
[14] A. D’Anna, Combustion-formed nanoparticles, J. P Combust Inst. 32 (2009) 593-613. 339
[15] H. Cheng, Y. Hu, Municipal solid waste (MSW) as a renewable source of energy: current and future 340
practices in China, Bioresour. Technol. 101 (2010) 3816-3824. 341
[16] C.C. Wiles, Municipal solid waste combustion ash: State-of-the-knowledge, J. Hazard. Mater. 47 342
(1996) 325-344. 343
[17] H.-Y. Wu, Y.-P. Ting, Metal extraction from municipal solid waste (MSW) incinerator fly ash— 344
Chemical leaching and fungal bioleaching, Enzyme Microb. Technol. 38 (2006) 839-847. 345
[18] F.S. Zhang, H. Itoh, Extraction of metals from municipal solid waste incinerator fly ash by 346
hydrothermal process, J. Hazard. Mater. 136 (2006) 663-670. 347
[19] K. BeruBe, D. Balharry, K. Sexton, L. Koshy, T. Jones, Combustion-derived nanoparticles: 348
mechanisms of pulmonary toxicity, Clin. Exp. Pharmacol. Physiol. 34 (2007) 1044-1050. 349
[20] K. Donaldson, L. Tran, L.A. Jimenez, R. Duffin, D.E. Newby, N. Mills, W. MacNee, V. Stone, 350
Combustion-derived nanoparticles: a review of their toxicology following inhalation exposure, Part. 351
Fibre. Toxicol. 2 (2005) 10. 352
[21] R.D. Hooton, J.A. Bickley, Prescriptive versus performance approaches for durability design – The 353
end of innocence?, Mater. Corro. 63 (2012) 1097-1101. 354
[22] B. Lothenbach, K. Scrivener, R.D. Hooton, Supplementary cementitious materials, Cem. Concr. Res. 355
41 (2011) 1244-1256. 356
[23] A.M. Ramezanianpour, R.D. Hooton, A study on hydration, compressive strength, and porosity of 357
Portland-limestone cement mixes containing SCMs, Cement. Concrete. Comp. 51 (2014) 1-13. 358
[24] M.D.A. Thomas, R.D. Hooton, A. Scott, H. Zibara, The effect of supplementary cementitious 359
materials on chloride binding in hardened cement paste, , Cem. Concr. Res. 42 (2012) 1-7. 360
[25] A. Ansarifar, A. Azhar, N. Ibrahim, S.F. Shiah, J.M.D. Lawton, The use of a silanised silica filler to 361
reinforce and crosslink natural rubber, Int. J. Adhes. Adhes. 25 (2005) 77-86. 362
13
[26] T. Sabbas, A. Polettini, R. Pomi, T. Astrup, O. Hjelmar, P. Mostbauer, G. Cappai, G. Magel, S. 363
Salhofer, C. Speiser, S. Heuss-Assbichler, R. Klein, P. Lechner, Management of municipal solid waste 364
incineration residues, Waste Manage. 23 (2003) 61-88. 365
[27] T. Van Gerven, H. Cooreman, K. Imbrechts, K. Hindrix, C. Vandecasteele, Extraction of heavy 366
metals from municipal solid waste incinerator (MSWI) bottom ash with organic solutions, J. Hazard. 367
Mater. 140 (2007) 376-381. 368
[28] N. Chen, C. Wan, Y. Zhang, Y. Zhang, Effect of nano-CaCO3 on mechanical properties of PVC and 369
PVC/Blendex blend, Polym. Test. 23 (2004) 169-174. 370
[29] Z. Guo, X. Liang, T. Pereira, R. Scaffaro, H. Thomas Hahn, CuO nanoparticle filled vinyl-ester resin 371
nanocomposites: Fabrication, characterization and property analysis, Compos. Sci. Technol. 67 (2007) 372
2036-2044. 373
[30] X.L. Xie, Q.X. Liu, R.K. Y. Li, X.P. Zhou, Q.X. Zhang, Z.Z. Yu, Y.W. Mai, Rheological and 374
mechanical properties of PVC/CaCO3 nanocomposites prepared by in situ polymerization, Polymer. 45 375
(2004) 6665-6673. 376
[31] J. Buongiorno, D.C. Venerus, N. Prabhat, T. McKrell, J. Townsend, R. Christianson, Y.V. 377
Tolmachev, P. Keblinski, L.-w. Hu, J.L. Alvarado, I.C. Bang, S.W. Bishnoi, M. Bonetti, F. Botz, A. 378
Cecere, Y. Chang, G. Chen, H. Chen, S.J. Chung, M.K. Chyu, S.K. Das, R. Di Paola, Y. Ding, F. Dubois, 379
G. Dzido, J. Eapen, W. Escher, D. Funfschilling, Q. Galand, J. Gao, P.E. Gharagozloo, K.E. Goodson, 380
J.G. Gutierrez, H. Hong, M. Horton, K.S. Hwang, C.S. Iorio, S.P. Jang, A.B. Jarzebski, Y. Jiang, L. Jin, 381
S. Kabelac, A. Kamath, M.A. Kedzierski, L.G. Kieng, C. Kim, J.H. Kim, S. Kim, S.H. Lee, K.C. Leong, 382
I. Manna, B. Michel, R. Ni, H.E. Patel, J. Philip, D. Poulikakos, C. Reynaud, R. Savino, P.K. Singh, P. 383
Song, T. Sundararajan, E. Timofeeva, T. Tritcak, A.N. Turanov, S. Van Vaerenbergh, D. Wen, S. 384
Witharana, C. Yang, W.H. Yeh, X.Z. Zhao, S.Q. Zhou, A benchmark study on the thermal conductivity of 385
nanofluids, J. Appl. Phys. 106 (2009) 094312. 386
[32] R. Taylor, S. Coulombe, T. Otanicar, P. Phelan, A. Gunawan, W. Lv, G. Rosengarten, R. Prasher, H. 387
Tyagi, Small particles, big impacts: A review of the diverse applications of nanofluids, J. Appl. Phys. 113 388
(2013) 011301. 389
[33] L.S. Sundar, M.H. Farooky, S.N. Sarada, M.K. Singh, Experimental thermal conductivity of ethylene 390
glycol and water mixture based low volume concentration of Al2O3 and CuO nanofluids, Int Commun 391
Heat Mass Transfer. 41 (2013) 41-46. 392
[34] S.Y. Fu, X.Q. Feng, B. Lauke, Y.W. Mai, Effects of particle size, particle/matrix interface adhesion 393
and particle loading on mechanical properties of particulate–polymer composites, Compos. Part B-Eng. 394
39 (2008) 933-961. 395
[35] R. Hashemi-Nasab, S.M. Mirabedini, Effect of silica nanoparticles surface treatment on in situ 396
polymerization of styrene–butyl acrylate latex, Prog. Org. Coat. 76 (2013) 1016-1023. 397
[36] C.A. Dorval Dion, J.R. Tavares, Photo-initiated chemical vapor deposition as a scalable particle 398
functionalization technology (a practical review), Powder Technol. 239 (2013) 484-491. 399
14
[37] C.A. Dorval Dion, W. Raphael, E. Tong, J.R. Tavares, Photo-initiated chemical vapor deposition of 400
thin films using syngas for the functionalization of surfaces at room temperature and near-atmospheric 401
pressure, Surf. Coat. Technol. 244 (2014) 98-108. 402
[38] T.A. Egerton, H. Purnama, Does hydrogen peroxide really accelerate TiO2 UV-C photocatalyzed 403
decolouration of azo-dyes such as Reactive Orange 16? Dyes Pigm. 101 (2014) 280-285. 404
[39] S. Gyergyek, M. Huskić, D. Makovec, M. Drofenik, Superparamagnetic nanocomposites of iron 405
oxide in a polymethyl methacrylate matrix synthesized by in situ polymerization, J. Colloids Surf., A: 406
Physicochemical and Engineering Aspects. 317 (2008) 49-55. 407
[40] M. Montazer, M. Maali Amiri, ZnO nano reactor on textiles and polymers: ex situ and in situ 408
synthesis, application, and characterization, J. Phys. Chem. B. 118 (2014) 1453-1470. 409
[41] Z. Guo, T.Y. Kim, K. Lei, T. Pereira, J.G. Sugar, H.T. Hahn, Strengthening and thermal stabilization 410
of polyurethane nanocomposites with silicon carbide nanoparticles by a surface-initiated-polymerization 411
approach, Compos. Sci. Technol. 68 (2008) 164-170. 412
[42] Y.M. Cao, J. Sun, D.H. Yu, Preparation and properties of nano-Al2O3 particles/polyester/epoxy resin 413
ternary composites, J. Appl. Polym. Sci. 83 (2002) 70-77. 414
[43] P.C. Sadek, The HPLC solvent guide, John Wiley, New York: 1996. 415
[44] K.L. Feilberg, S.R. Sellev, C.J. Nielsen, D.W.T. Griffith, M.S. Johnson, CO+OH→CO2+H: The 416
relative reaction rate of five CO isotopologues, J. PCCP. 4 (2002) 4687-4693. 417
[45] M.J. Frost, P. Sharkey, I.W.M. Smith, Reaction between hydroxyl (deuteroxyl) radicals and carbon 418
monoxide at temperatures down to 80 K: experiment and theory, J. Phys. Chem. 97 (1993) 12254-12259. 419
[46] W.E. Wilson, A Critical Review of the Gas-Phase Reaction Kinetics of the Hydroxyl Radical, J. 420
Phys. Chem. Ref. Data. 1 (1972) 535-573. 421 [47] http://www.worldwatch.org/global-municipal-solid-waste-continues-grow (2014). 422 [48] http://www.prnewswire.com/news-releases/global-market-for-nanotechnology-to-reach-33-trillion-423 by-2018-181915881 (2014). 424 [49] 425 http://www.researchandmarkets.com/reports/2488811/the_global_market_for_metal_oxide_nanoparticles 426 (2014). 427
15
Figures:
428
Figure 1. Experimental apparatus and injection set-up
429
16
Figure 2. SEM and EDS micrographs of untreated ash powder
430
Figure 3. XRD pattern of ash powder before any experiments.
431
432
17
Figure 4. (a) A single particle identified on a TEM grid from control experiments: Experiment #1 ; (b) The corresponding EDS spectrum shows its composition is mainly Ca.
433
18
(c) (d)
19
Figure 5. TEM micrographs of treated samples (a) Experiment #2, (b) Experiment #3, (c) Experiment #4, (d) Experiment #5, (e) Representative of EDS spectrum taken from experiment #3
434
20
Figure 6. TEM micrographs of treated samples (a) Experiment #6, (b) Representative of EDS spectrum.
435
Figure 7. DRIFTS spectra comparison for PICVD process: (1) Experiment #1, (2) Experiment #2, (3) Experiment #3, (4) Experiment #4, (5) Experiment #5, (6) Experiment #6.
436
21
Figure 8. DRIFTS spectra for PICVD process along with peaks identifications: (1) Experiment #1, (2) Experiment #2, (3) Experiment #3, (4) Experiment #4, (5) Experiment #5, (6) Experiment #6.
437 438
Tables:
439Table 1. Experimental details Experiment Number H2O2 injection UVC Lamps Dispersion medium Pressure
#1 No Off Water Near atmospheric (+10 kPa)
#2 No On Water Near atmospheric (+10 kPa)
#3 Yes On Water Near atmospheric (+10 kPa)
#4 No On Water Slight vacuum (-10 kPa)
#5 Yes On Water Slight vacuum (-10 kPa)
#6 No On Acetone Near atmospheric (+10 kPa)
440
441
22
Table 2. Elemental concentration of ash powder using ICP-AES analysis
Element Ag Al As B Be
Wavelength 328.06 396.15 189.04 249.77 313.04
Concentration (ppm) 0.26 37.41 1.09 0.21 0.00
Std Dev: 0.00 0.19 0.00 0.00 0.00
Equivalent oxide basis (%wt) 1
0.01% 2.58% 0.06% 0.02% 0.00%
Element Ca Cd Co Cr Cu
Wavelength 393.30 214.43 228.61 206.55 221.81
Concentration (ppm) 1495.55 1.59 0.20 1.70 8.45
Std Dev: 0.15 0.00 0.00 0.00 0.01
Equivalent oxide basis (%wt) 1
76.37% 0.07% 0.01% 0.09% 0.39%
Element Fe K Mg Mn Mo
Wavelength 259.94 766.49 279.55 257.61 202.03
Concentration (ppm) 191.63 7.27 84.51 9.41 0.21
Std Dev: 0.01 0.04 0.77 0.06 0.00
Equivalent oxide basis (%wt) 1
10.00% 0.32% 5.11% 0.54% 0.01%
Element Na Ni Pb Sb Se
Wavelength 589.59 231.60 220.35 217.58 196.09
Concentration (ppm) 7.66 1.11 19.71 11.52 0.11
Std Dev: 0.03 0.00 0.01 0.03 0.00
Equivalent oxide basis (%wt) 1
0.38% 0.05% 0.83% 0.56% 0.01%
Element Si Ti Tl V Zn
Wavelength 251.61 334.94 351.92 292.40 213.85
Concentration (ppm) 0.07 6.24 0.00 0.45 48.00
Std Dev: 0.00 0.03 0.08 0.00 0.14
Equivalent oxide basis (%wt) 1
0.01% 0.38% 0.00% 0.03% 2.18%
1Equivalant oxide basis was calculated based on the higher oxidation form e.g. Fe
2O3 instead of FeO.
442
Table 3. Peak assignment in the infrared spectra of dried samples under PICVD coating process Peak
absorption band (cm−1 )
Peak assignment
3600-3100 Hydroxyl group, hydrogen-bonded, O-H stretch in aliphatic alcohol 1350-1260 Primary or secondary alcohol, O-H in plane bend
∼ 1050 Primary alcohol, C-O stretch ∼ 1200 Phenol, C-O stretch
3000-2800 Asymmetric and symmetric methyl (-CH3 ) and methylene (-CH2-) stretch
2250-2100 C ≡ C stretch in alkynes 1680-1630 C=O stretch in ketones
1475-1430 -CH3 asymmetric and -CH3 asymmetric methyl bending in aliphatic compounds
443