HAL Id: hal-01025225
https://hal-brgm.archives-ouvertes.fr/hal-01025225
Submitted on 17 Jul 2014HAL is a multi-disciplinary open access archive for the deposit and dissemination of sci-entific research documents, whether they are pub-lished or not. The documents may come from teaching and research institutions in France or abroad, or from public or private research centers.
L’archive ouverte pluridisciplinaire HAL, est destinée au dépôt et à la diffusion de documents scientifiques de niveau recherche, publiés ou non, émanant des établissements d’enseignement et de recherche français ou étrangers, des laboratoires publics ou privés.
A new structural cooperative inversion approach applied
to the combined tomography of electrical resistivity and
seismic refraction travel times.
Kévin Samyn, Adnand Bitri, Roger Guerin
To cite this version:
Kévin Samyn, Adnand Bitri, Roger Guerin. A new structural cooperative inversion approach applied to the combined tomography of electrical resistivity and seismic refraction travel times.. EAGE Near Surface Geoscience 2014, Sep 2014, Athènes, Greece. 4 p. �hal-01025225�
Introduction
The combined interpretation of different measurement types is a basic principle to confine the ambiguity of the inverse problems in geophysics. In the existing approaches, one inverts for one parameter using an augmented data vector (Vozoff and Jupp, 1975). This is only possible if all measurements depend on the same parameter or if the parameters are interconnected by some petrophysical relationship. However, often such a relationship does not exist, as for electrical conductivity and seismic velocity. Nevertheless, we expect at least similar structures in the resulting models. The challenge is to facilitate similar structures without enforcing it. Gallardo and Meju (2004) presented an algorithm where a combined data functional based on the cross-gradients of both models is minimized. However, one problem is the weighting of the individual data and model updates for different data numbers and convergence properties. Günther and Rücker (2006) presented an approach where two inversion runs are carried out separately. The combination of both models is accomplished by mutually controlled structural weights based on the principles of robust modeling. To provide more information to Electrical Resistivity Tomography (ERT), recently, Zhou et al. (2014) proposed an image-guided inversion of the electrical resistivity data. This approach uses structural information obtained directly from a guiding image but suffers from the need of a high resolution geophysical method (e.g. migrated seismic or ground penetrating radar images) or possibly from a geological cross-section based on some prior geological expertise. In this paper we describe a new approach where the combination of both methods is done using a reference model obtained by a Fussy c-Mean (FCM) cluster analysis step and used in the least square solution associated to the linearized minimization of the cost function. First we describe the minimization problem. Thereafter we introduce the building of the reference model using the cluster analysis and how structural information may be interchanged. The application on a step-like synthetic model shows how the structural cooperative inversion improves the model concept.
Inversion
The minimization procedure
The inverse problem can be solved using iterative reweighted least-squares techniques applied to the minimization of the following weighted model functional
2 2 2 ( ) )) ( ( ) (m Wd d F m
Wc mmref
(1)where m is the model parameters and d is the observed data. The first term in Eq. (1) is the misfit functional, which is a measure of misfit between the theoretical values F(m) and the observed data d. Wc and Wd are the weighting diagonal matrix that represents penalty factors for the different model cell boundaries and data, respectively.
Assuming no a-priori information about the data, the least-square solution associated to the linearized problem of the cost function minimization (Tarantola, 1987) results in the following iterative equation:
c n ref
t c t c t c t kJ
J
W
W
J
d
F
m
W
W
m
m
m
.
1(
(
))
.
(
(2)where J is the Jacobian matrix and Jt is the transpose of matrix J. In the case of ERT, the Jacobian matrix is computed using differential calculus and the 2.5D approximation for forward modeling is solved according to Pidlisecky and Knight (2008). Travel time seismic data are inverted using a SIRT algorithm (Grandjean and Sage, 2004). A Fresnel wave-path approach (Watanabe et al., 1999) is used for the forward modeling of seismic travel time data and the calculation of the Jacobian matrix.
When a reference model is incorporated in the Eq. (2), the term mref ensures that the final model exhibits a small departure from the reference model.
The reference model
Fuzzy C-Means (FCM) is an unsupervised clustering algorithm. The description of the original algorithm dates back to Bezdek (1973) and Dunn (1974). FCM attempts to find the most characteristic
point in each cluster, which can be considered as the “centroid” of the cluster and, then, the grade of
membership for each object in the clusters. Such aim is achieved by minimizing the objective function defined as follow:
c i i o j m ij n j mU
V
u
x
J
1 2 , 1)
,
(
(3)where n is the total number of patterns in a given data set, o is the number of parameters in the data set
and c is the number of clusters;
o n n x x x x x x X , 1 , 2 , 2 1 , 2 2 , 1 1 , 1 ⊂ Rs and V = {v1, . . . , vc} ⊂ R s
are the feature data
and cluster centroids; and U = [uij ]c×n is a fuzzy partition matrix composed of the membership grade of
pattern xj to each cluster i. xj
i is the Euclidean norm between xj and
i. The weighting exponentm is called the fuzzifier which can have influence on the clustering performance of FCM.
After each iteration of the inversion procedure, an FCM analysis is performed using the normalized parameters model mk as data. A reference model is then obtained for each parameter applying the following equations to the resulting fuzzy partition matrix for which the membership grade has been implemented by the cluster centroids values:
2 , 1 , ij
.
j j refu
x
m
,1 2 , ij.
j j refu
x
m
(4)In this way, structural information may be interchanged between the two parameters models.
The cooperative inversion approach
The cooperative inversion scheme is illustrated in figure 1 for electrical resistivity and refraction travel time tomography. We assume both parameters exist on the same grid.
Figure 1 : Flow chart illustrating the key steps of the cooperative inversion and the incorporation of potential structural a priori information.
We choose a starting resistivity model
0 and velocity model V0. A first iteration is performed independently. In the next step the FCM analysis is performed on the updated parameters models to build up reference models as described in the previous section. Thus the exchange of structural information is achieved by the created reference matrices. References models for the two parameters are then used, in the least square solution associated to the linearized minimization of their respectivecost functions (Eq. 2). We proceed with this until convergence is achieved, resulting in the final
models
nand Vn. Let’s note that a structural a-priori information can be included in the FCM processin the form of a conditional partition matrix illustrating for example the known presence of a basement or not.
Application
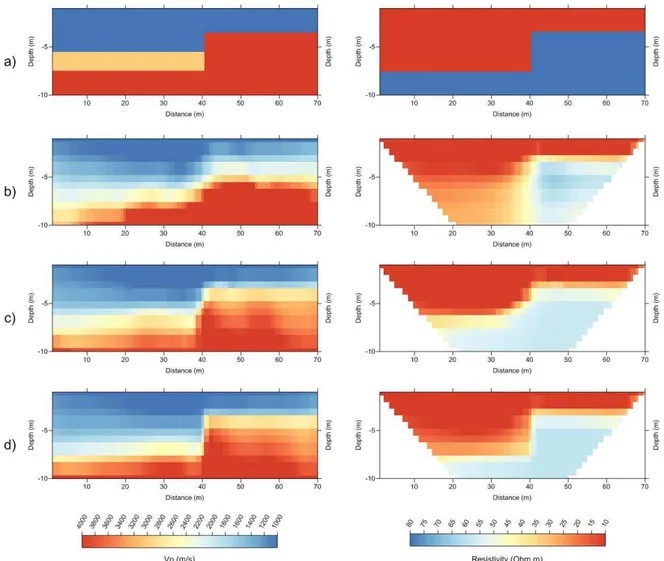
Figure 2a shows the used synthetic model. Note that both resistivity and velocity show a similar
structure based on a rectangular mesh. Let’s note that both apparent resistivity and seismic travel time
from the forward calculation have been noisified applying a random standard deviation of 2% on the data. First we invert the data separately, i.e. without structural coupling. Figure 2b shows the resulting models. Both exhibit the main features but the Vp model resolve the sharp boundaries only by a
smooth gradient while the
model doesn’t achieve in resolving the high resistivity basementaccurately, especially in the left part of the model. The step is expressed as a slope.
Then, we introduce structural coupling using the cooperative inversion approach yielding the inversion results in the figure 2c. The boundaries, particularly the vertical one, are reproduced much clearer on
the Vp model. On the
model, the resistant basement also appears more clearly.Finally, an a-priori structural information is brought into the FCM analysis using a conditional partition matrix equal to 1 where the basement is known and 0 when it is not. Here again, the structure of both is improved (Figure. 2d).
Figure 2: a) synthetic model used to test the inversion approach, b) inversion results without structural coupling, c) inversion results using the structural cooperative inversion approach and d)
Conclusions
We presented a new approach for the cooperative inversion of independent parameters by structural exchange based on a FCM analysis. The experiment on a synthetic model shows that for co-located data, the ambiguity is reduced and the structure is better resolved. In order to assess the reliability of the approach, the cooperative inversion should be tested on a synthetic model for which some boundaries can only be seen by one parameter. In this case, a progress track could be to consider a weighting matrix in equation (2) that represents penalty factors on the coupling for places in the model where the two parameter models are not similar. Finally, the technique must be applied to field data to prove its applicability.
References
Bezdek, J.C. Fuzzy mathematics in pattern classification, Ph.D. Dissertation, Cornell University, Ithaca, NY, 1973.
Dunn, J.C. A fuzzy relative of the ISODATA process and its use in detecting compact,
well-separated clusters, J. Cybernet. 3 (1974) 32–57.
Gallardo, L. A. and Meju, M. A. (2004). Joint two-dimensional dc resistivity and seismic travel time inversion with cross-gradients constraints. J. Geophys. Res., 109:03311.
Grandjean, G., Sage, S., 2004. JaTS: a fully portable seismic tomography software based on
Fresnel wavepaths and a probabilistic reconstruction approach. Computers and Geosciences 30, 925–
935.
Günther, T. and C. Rücker (2006): A new joint inversion approach applied to the combined tomography of dc resistivity and seismic refraction data, 19th SAGEEP, Seattle (USA)
Pidlisecky, A., Knight, R. 2008. FW2.5D: A MATLAB 2.5-D electrical resistivity modeling code, Computers & Geosciences 1645-1654.
Tarantola, A. (1987). Inverse problem theory : methods for data fitting and model parameter estimation. Elsevier, Netherlands.
Vozoff, K. and Jupp, D. L. B. (1975). Joint inversion of geophysical data. Geoph. J. R. astr.
Soc., 42:977– 991.
Watanabe, T., Matsuoka, T., Ashida, Y., 1999. Seismic traveltime tomography using Fresnel volume approach. 69th Proceedings Society Exploration Geophysics, Houston, USA, SPRO12.5.
Zhou, J., Revil, A., Karaoulis, M., Hale, D., Doetsch, J., Cuttler, S. 2014. Image-guided inversion of electrical resistivity data, Geophysical Journal International 2014.