Tracing Value Added in Gross Exports of the Automotive
Industry - The Case of France and Germany
Katharina Birgitta L¨
angle
Universit´
e Paris 1 Panth´
eon Sorbonne
UFR 02 - Sciences ´
Economiques
Master 2 Recherche ´
Economie de la Mondialisation
supervised by Prof. Lionel Fontagn´
e
June 05, 2015
Abstract
Due to the increasing fragmentation of international production chains, traditional export statistics lose their reliability to depict value streams between countries. To illustrate this problem and a possible solution for an exemplary case, gross exports of the French and German automotive industry are decomposed using data from the World Input-Output Database for the period from 1995 to 2011. Decomposition results seem to reflect consequences of vertical specialization: in both country sectors foreign value added in gross exports as well as double counted shares are increasing while the domestic value added is declining. However, the growing domestic value contribution in absolute terms suggests that both the French and German automotive sector succeeded in remaining competitive on international markets.
JEL classification: F14, E16, F6
L’universit´e de Paris 1 Panth´eon-Sorbonne n’entend donner aucune approbation ni d´esapprobation aux opinions ´emises dans ce m´emoire: elles doivent ˆetre consid´er´ees comme propre `a leur auteur.
The University of Paris 1 Panth´eon-Sorbonne neither approves nor disapproves of the opinions expressed in this dissertation: they should be considered as the author’s own.
Contents
1 Introduction 1
2 Related Literature 3
3 Empirical Strategy 4
3.1 Gross Export Decomposition Method proposed by Koopman et al. . . 5 3.2 The Special Case of Gross Export Decomposition at the Sectoral Level . . . 8 3.3 Integration of Existing Concepts into the Gross Export Decomposition Formula . . 9
4 Data 11
4.1 The World Input-Output Database . . . 11 4.2 Construction Technique of World Input Output Tables . . . 12 4.3 Critical Assessment of the Data . . . 13
5 Results 14
5.1 Gross Export Decomposition of the French and German Automotive Industry . . . 14 5.2 Foreign Value Added in Gross Exports as a Measure of Vertical Specialisation . . . 16 5.3 Domestic Value Added in Gross Exports . . . 18
1
Introduction
International trade increased tremendously over the last decades. Since the turn of the millennium, the volume of trade almost doubled, while production grew only by 50%.1 This development can mainly be explained by ongoing globalization strongly influencing the production of goods. In the course of globalization, a growing number of countries has been integrated into the process of value creation. With regard to traditional trade statistics, two core issues arise: Firstly, in a world with fragmented production chains, intermediate goods cross borders several times. This triggers a so called ”double counting problem”, leading to the difficulty that traditional trade statistics become more and more unreliable to depict the actual value which is exchanged among countries. Secondly, as there is an increasing share of imported intermediate goods involved in the production of exported goods, the value of gross exports is not fully attributable to the exporting country. However, information about the domestic value added is crucial since this value enables the economy to create jobs as well as to reimburse production factors. Consequently, there is great necessity to find ways how to accurately trace back the origin of value added as well as to solve the double counting problem. In this respect, it is worth mentioning two contributions, which have been made during recent years: A methodical paper ”Tracing Value-Added and Double Counting in Gross Exports” written by Koopman, Wang and Wei has been published in 2014. This paper provides a sophisticated mathematical framework to fully decompose a country’s gross exports into its various components, thereby accounting for all parts of gross exports which might be counted twice. Yet, their method requires detailed input-output tables on a global level, which have not been available until recently. The release of the World Input-Output Database (WIOD) in 2012 offers data which is sufficiently detailed to apply methods to trace the value added by a country. Given these contributions, profound research can be conducted in the field of value added and associated topics.
Since the early 2000s, the French and German automotive industry has been highly engaged in outsourcing and offshoring at different stages of production. This development raised the public concern that increased offshoring might reduce domestic value contribution in the production thus lowering the capacity of the domestic economy to reimburse the production factors and to maintain jobs. In order to shed light on the question whether these concerns are empirically justified, the present paper aims at tracing the domestic as well as the foreign value added in gross exports of the French and German automotive industry over time.
In the past, studies as the one conducted by Timmer et al. (2013 & 2014) already investigated dynamics of value creation for advanced nations in general as well as for the automotive industry in Germany. However, these papers do not devote much attention to the export decomposition method. Instead, they combine indicators as the ”VAX ratio” of Johnson and Noguera (2012) with the accounting framework of Koopman et al. (2014). However, at the sectoral level this method is less adequate as it does not account for back- and forward linkages in intermediate goods trade to a sufficient extent. At that point, this paper contributes to the existing literature by applying a diligently derived formula for the export decomposition at the sectoral level which has been proposed by Wang et al. (2013).
The results obtained from this decomposition confirm trends, which have been detected in recent literature for the automotive industry. Increased sourcing of intermediate goods from abroad as well as offshoring led to a growing share of foreign value added in gross exports and a decreasing share of domestic value contribution, vice versa. Even though the share of domestic value added in gross exports of the automotive sector is declining over time, the domestic value contribution is increasing in absolute terms. Thus, the concern that increased offshoring might endanger the reimbursement of the production factors can not be confirmed as the capacity for reimbursement is increasing. Yet, calculation results demonstrate that the absolute gain in domestic value added in gross exports of the automotive industry was much higher in Germany (91%) than in France (56%). The literature on the topic suggest that this gap is due to differences in the increasing demand for products from the automotive industry and reveals the fact that the reorganization of the global value chain might also come at certain costs: France suffered a loss in its position as provider of intermediate goods. However, as pointed out by Marin (2010), the reorganization of the value chain - increased vertical specialization - was essential since it enabled firms to stay price competitive on the international market. Thus, vertical specialization can be valued as important precondition to attract global demand.
In the following section a brief review of the literature on the topic will be given. Section 3 introduces the empirical strategy which is pursued in the present paper. Subsequently, the World Input-Output Database providing the necessary data is presented. In section 5, results of the export decomposition are analyzed and section 6 concludes.
2
Related Literature
The literature on the topic of tracing value added in gross exports can be divided into two parts. Firstly, there is literature dealing with the conceptual approach to define indicators describing how much value a country added in its gross exports and how much it is contributing to exports of other countries. Secondly, several empirical papers trace value added in gross exports of a country sector and link these results to specialization patterns of the economy while other empirical papers try to shed light on effects of increased product sourcing from abroad on local labour markets.
In the 1930s, Wassily Leontief (1936) conceptualized the idea that the ”amount and type of intermediate inputs needed in the production of one unit output can be estimated based on the input output structure across industries” (Koopman et al., 2014). This concept, now known as the Leontief inverse or total requirement coefficient gives information about the amount of a country’s gross output needed to produce an extra unit of a final good. The mathematical framework used in this paper as well as in the recent literature is based on this concept. For example, Hummels et al. (2001) apply the Leontief inverse to trace vertical specialization patterns of countries in the process of increasing global production sharing. According to them, the degree of vertical specialization is determined by the imported foreign value content in gross exports of a country. Moreover, Johnson and Noguera (2012) define the ”VAX ratio” measuring the domestic value added share in a country’s gross exports. However, both concepts are rather ”stand alone” indicators falling short in identifying value added which crosses borders several times. This shortcoming is critical as value added is a net concept by definition and thus double counted parts distort results of a country’s value contribution. For this reason, Koopman, Wang and Wei (2014) aim at contributing to the methodical literature by providing a mathematical framework which completely decomposes gross exports at an aggregate level. As it will be shown in subsection 3.2, their concept is also applicable at the sectoral level.
Besides these conceptual approaches, there are several studies, which try to estimate the value contribution of countries at different stages of production and the nature of production sharing. On the one hand, there are case studies tracing value added at the product level. For example, Dudenh¨offer (2005) quantified the German value added in the production process of the Porsche Cayenne. According to Dudenh¨offer, only one third of the total value was created by German firms while two thirds of value added were sourced abroad. Moreover, associating decomposition results with additional information on factor reimbursement can reveal valuable insights into specialization patterns within industries. This has been done for advanced nations in general (Timmer et al.,
2014) as well as for European countries (Timmer et al., 2013). Their findings suggest that within high income countries, there is specialization in activities using predominantly high-skilled labor and capital. With regard to the German economy, Timmer et al. (2014) show that there has been a decline in the share of domestic value added in gross exports from the automotive sector. This finding is in line with the increasing intermediate sourcing from abroad and the offshoring patterns identified by various authors: Sinn (2006) argues that the German wage level was unable to adjust to the increased low-wage competition of Eastern European and Asian countries due to labour market rigidities. He concludes that, in Germany, the resulting turn away from labour-intensive to capital intensive sectors and the investment of capital abroad led to growing exports whereas the economy stagnated and unemployment increased. In contrast to this, Marin (2010) values labour cost savings through outsourcing to lower wage countries as essential precondition to stay price-competitive on the world market. According to her, Eastern European countries were especially prone to be destinations for outsourcing due to their relatively cheap medium-skilled work force.
Furthermore, there are studies trying to shed light on the question whether the reimbursement of the production factor labour is negatively affected by increasing import competition from abroad. For instance, Autor et al. (2013) examine the effect of rising Chinese import competition on re-gional labour markets in the US. They find that manufacturing industries suffered an increase in unemployment while wages in these industries were untouched. For non-manufacturing sectors, the result is the opposite: wages were declining whereas the level of unemployment did not change. In this context it should be noted, that Autor et al. (2013) consider the variation in imports from China as explanatory variable for changes in unemployment and wages in the US. Yet, this approach might lead to biased results stemming from the fact that China is identified as assembling economy. Hence, imports from China include not only value which has been created by Chinese industries but also by other countries’ industries, including the US itself.
3
Empirical Strategy
The empirical strategy of the present paper relies on the decomposition method proposed by Koop-man, Wang and Wei in ”Tracing Value-Added and Double Counting in Gross Exports” which has been published in the American Economic Review in 2014. Yet, this method is only applicable at the aggregated level. Since this paper aims at decomposing gross exports of the French and German automotive industry, it is necessary to look at another paper to assess the issue of gross export de-composition at the sectoral level: The dede-composition method proposed by Wang et al. (2013) might
be considered as a special case of the approach of Koopman et al.(2014). Therefore, the following chapter will outline the concept of Koopman et al. (2014) and based on it, its application at the sectoral level in the subsequent chapter.
3.1
Gross Export Decomposition Method proposed by Koopman et al.
Koopman et al. (2014) provide a unified mathematical framework to decompose gross exports in its various components. Basically, the authors perceive supply chains as ”systems of value added sources and destinations” where each producer needs to purchase inputs, adds value and passes the product to the next step of production. Due to an increasing fragmentation of supply chains across countries, intermediate goods cross boarders several times, triggering the previously mentioned ”double counting problem”. For that reason, their paper aims at depicting mathematically the various ways how value added in intermediate goods is entering in the production of final goods either domestically or abroad. Thereby, it is important to distinguish the different ways how value added in intermediate goods might return to the source country and how value added by other countries is entering the production. In order to outline their concept, the gross export decomposition will be shown for the case of two countries and one sector. An overview about the variables used and their respective interpretation can be found in table 1. Indices are either denoted as source country, s, or recipient country, r.
Starting point of the decomposition is equation 1.2
esr = ysr+ asrxr (1)
According to this equation, exports might either consist of final goods which are absorbed by the recipient country as direct importer, ysr, or they consist of intermediate goods which are entering
the production of the recipient country’s gross output, asrxr.
In a first step, the term of equation 1 is extended by a value component (vsbss+ vrbrs).
esr = (vsbss+ vrbrs)(ysr+ asrxr)
= vsbssysr+ vrbrsysr+ vsbssasrxr+ vrbrsasrxr
(2)
2This equation is a refinement of the gross output identity, x
s= assxs+ asrxr+ yss+ ysr, according to which
Variable Computation Interpreation
esr - Gross exports from country s to r.
xs - Gross output in country s
ysr, yss
-Demand for final goods produced in s absorbed abroad/ domestically
asr, ass
asr = Asr/xr
here: Asr is the
absolute amount
of intermediate goods flows.
Input-output coefficient:
units of intermediate goods produced in country s used in the production of
one unit gross output in country r / s vs, vr, vs = 1 − ars− ass Value added coefficient
bsr, bss
Xs = (I − Asr)−1Yr
here: the variables in capital letters
refer to matrices.
Total requirement coefficient / Leontief inverse: amount of country s’ s
gross output needed to produce
an extra unit of the final good in country r / s
vsbss,
vsbrs
-Country s’s value added share of products produced in country s;
Country r’s value added share in the same product. Note that: vsbss+ vrbrs = 1
Meaning, that value added must either stem from country s or r. Table 1
This component follows the conception that each value added must stem either from domestic or foreign sources. As depicted in equation 3, the third term of equation 2 can be further decomposed into three different components.
vsbssasrxr = vsbsryrr+ vsbsryrs+ vsbsrarsxs (3)
At this point, the main idea is to decompose gross output according to its potential use as final or intermediate good. Thus, vsbsryrr and vsbsryrs are depicting the cases where value added from the
source country in final goods produced in the recipient country is absorbed in the recipient country itself or is exported back to the domestic market of the source country. Moreover, gross output of the recipient country might consist of intermediate goods flowing to the source country where they are processed to gross output. This is depicted in the last term of equation 3. To finalize the gross export decomposition in the two country one sector case, it is necessary to decompose the gross output of the source country (xs in the last term of equation 3). According to equation 4,
gross output of the source country can be used to ”sustain final goods that are both produced and consumed in the source country, using domestically produced intermediate goods” (first term in equation 4). Alternatively, gross output can be used to sustain the country’s gross exports (second
term in equation 4).
xs= (1 − ass)−1yss+ (1 − ass)−1esr (4)
Given all these steps, one obtains equation 5. This equation corresponds to a full gross export decomposition in the two country-one-sector case.
esr = vsbssysr+ vsbsryrr
+ vsbsryrs+ vsbsrars(1 − ass)−1yss+ vsbsrars(1 − ass)−1esr
+ vrbrsysr+ vrbrsasr(1 − arr)−1yrr+ vrbrsasr(1 − arr)−1ers
(5)
The different terms can be interpreted as follows. Term one and two depict value-added exports of the source country which are absorbed abroad. Subsequently, the third and fourth components describe domestic value added by the source country that is initially embodied in intermediate exports. Both terms depict ways how value added by the source country returns back home: In the third term, domestic value added eventually returns home as part of the source country’s imports of final goods whereas in the fourth term, domestic value added returns home via intermediate imports from the recipient country to produce final goods which are absorbed domestically. Component number five is called ”pure double-counted term”. Similar to the fourth component, domestic value added first leaves the country embodied in intermediate exports and returns via intermediate imports from the recipient country. Different from the fourth term, value added does not stay in the source country but is again exported. Hence, this value added is crossing the border of the source country more than once and is thus double counted. The subsequent terms represent foreign value added in exports of the source country. The sixth term is foreign value added in the gross exports of the source country. The following component expresses the foreign value added in intermediate exports of the source country. Eventually, this foreign value added is absorbed abroad. Component number eight is another purely double counted term. Similar to term five, foreign value added enters the source country via its intermediate imports. After being processed, foreign value added is again returning to the recipient country from where it is re-exported to the source country. However, foreign value added in intermediate goods crossing the source country’s border is already captured in the seventh term. Thus, the last component is double counted.
In order to be able to apply the concept of gross export decomposition to an arbitrary number of countries, it is necessary to generalize formula 5. Equation 6 depicts a gross export decomposition for G countries and N sectors where variables of the previous two-countries-one-sector case are replaced by vectors (V, E, X and Y) and matrices (A and B). In the case of N sectors and G countries, A
and B are matrices of a GN x GN dimension. For example, Asr and Brs are submatrices of a N
x N dimension. V is a 1 x N row vector of direct value-added coefficients while the gross output vector, X, the final demand vector, Y, as well as the export vector, E, have a dimension of N x 1. How these vectors and matrices are available in the data source will be shown in section 4.
uEs∗ = Vs G X r6=s BssYsr+ Vs G X r6=s BsrYrr + Vs G X r6=s G X t6=r,s BsrYrt+ Vs G X r6=s BsrYrs + Vs G X r6=s BsrArs(I − Ass)−1Yss+ Vs G X r6=s BsrArs(I − Ass)−1Es∗ + G X t6=s G X r6=s VtBtsYsr+ G X t6=s G X r6=s VtBtsAsr(I − Arr)−1Yrr + G X t6=s VtBtsAsr G X r6=s (I − Arr)−1 Er∗ (6)
The interpretation of the different components corresponds to the one which has been presented for equation 5. Yet, in the general case of G countries and N sectors it is necessary to add one more component. Different from a world consisting of two countries, there also exists the possibility that domestic value added in intermediate goods is re-exported from the recipient country to third countries. This case is depicted in the third term of equation 6. Eventually, gross exports are decomposed into nine different components with the first six terms representing domestic value added and the three last components depicting foreign value added. It is thus worth mentioning that the sixth and ninth components are double counted. Subsection 3.2 demonstrates how formula 6 can be refined in order to be eligible to decompose gross exports at the sectoral level.
3.2
The Special Case of Gross Export Decomposition at the Sectoral
Level
The special case of gross export decomposition at the sectoral level is based on an extension of the decomposition formula of Koopman, Wang and Wei (2014) which has been presented in the previous subsection. Besides mathematical adjustments within the respective components, the extended formula contains three additional terms and is further splitting up the sixth double counted component of equation 6. By proceeding this way, gross exports are splitted into thirteen different components. Unlike formula 6, not only matrix-vector computation is used. In equation 7, ”#”
denotes an element-wise matrix multiplication operation. Esr= VsBss#Ysr+ VsLss#AsrBrrYrr+ VsLss#Asr G X t6=s,r BrtYtt + VsLss#AsrBrr G X t6=s,r Yrt+ VsLss#Asr G X t6=s,r G X u6=s,t BrtYtu + VsLss#AsrBrrYrs+ VsLss#Asr G X t6=s,r BrtYts+ VsLss#AsrBrsYss + VsLss#Asr G X t6=s BrsYst+ (VsBss− VsLss) #AsrLrrXr + G X t6=s,r VtBts#Ysr+ G X t6=s,r VtBts#AsrLrrYrr+ G X t6=s,r VtBts#AsrLrrEr∗ (7)
For the gross export decomposition at the sectoral level it is crucial to depict mathematically how sectors within a country are intertwined. For that reason, all components (expect the first one) are extended by a ”local Leontief inverse”: Lss = (1−Ass)−1for the source country and Lrr = (1−Arr)−1 for the recipient country. Components one to five have the same economic interpretation as the respective components in equation 6. These components are followed by three additional terms. All of them are depicting domestic value added in intermediates which are re-exported to third countries where they are processed to final goods. These three additional components differ with regard to the country where final goods are eventually absorbed: these can be the third, recipient or source country, respectively. The ninth and tenth term of equation 7 correspond to the purely double counted fraction of the formula. With respect to their interpretation, they correspond to the sixth term of equation 6. Similar to equation 6, the last three terms depict foreign value added in gross exports at the sectoral level.
3.3
Integration of Existing Concepts into the Gross Export
Decompo-sition Formula
This subsection shows how existing concepts like the VAX ratio of Johnson and Noguera (2012) and the vertical specialization indicator of Hummels et al. (2001) can or can not be integrated into the mathematical framework of Koopman et al. (2014) and Wang et al. (2013).
According to Koopman et al. (2014), it is possible to integrate both concepts into the mathe-matical decomposition framework at the aggregated level. Regarding equation 6 in subsection 3.1,
the VAX ratio corresponds to the first three components of the formula. Thus, the VAX ratio is expressed through the domestic value added in direct final goods exports and the domestic value added in intermediates exports which were either absorbed by direct importers or reexported to third countries. Similarly, the measure of vertical specialization of Hummels et al (2001) can be ex-pressed as linear combination of the last three components identified by equation 6. Consequently, the vertical specialization can be measured by the foreign value added in final and intermediate goods exports as well as through purely double counted foreign value added in intermediate exports. As presented by Wang et al. (2013), vertical specialization can also be measured at the sectoral level. The linear combination to express this indicator corresponds to the last three components of equation 7 in subsection 3.2. Their interpretation coincides with the one given for the components in equation 6. However, the VAX ratio in its original form defined by Johnson and Noguera (2012) can not be integrated into the decomposition formula at the sectoral level. According to Wang et al. (2013), the crucial issue consists of the fact that the VAX ratio does not distinguish between forward and backward linkages of value flows. Wang et al. (2013) illustrate the issue as follows: assuming it is intended to trace the value added in gross exports according to a foreward-linkage based measurement. With regard to a particular industry like the electronics sector, the foreward-linkage based measure captures the electronics sector’s value contribution to gross exports of the automobile and chemical sectors. Yet, the foreward-based measure excludes value contributions from these sectors embodied in the gross exports of the electronics sector. In contrast to this, a backward-linkage based measure captures the value added by the service and automobile industry included in gross exports of the electronics sector. However, the measure neglects value added contributions of the electronics sector embodied in gross exports of other industries such as the automobile industry. Consequently, the VAX ratio, which is defined as foreward-linkage based measure, is not able to depict how value flows among sectors are intertwined. Wang et al. (2013) show numerically that this shortcoming can not be solved by a redefinition of the VAX ratio at the sectoral level. They conclude that economic reasoning and econometric work based on a VAX ratio at the sectoral level were very likely to be incorrect.
4
Data
4.1
The World Input-Output Database
Data on gross exports, intermediate goods flows as well as data on output come from the World Input-Output Database (WIOD) which has been released in 2012. The database covers 41 countries (40 countries plus a rest-of-the-world region (RoW)) as well as 35 industries for the time period from 1995 to 2011.3 Calculations of this paper are based on data from National and World Input-Output Tables. While data on gross exports is taken from National Input-Input-Output Tables, data on intermediate goods flows, final consumption and gross output come from World Input-Output Tables (WIOT). Table 2 illustrates in which manner matrices and vectors presented in section 3 are available in WIOTs.
Intermediate use Final use Ctry A Ctry B Region
RoW Ctry A Ctry B
Region RoW
Industry Industry Industry Total Ctry A Industry AAA AAB AAR YAA YAB YAR XA Ctry B Industry ABA ABB ABR YBA YBB YBR XB Region RoW Industry ARA ARB ARR YRA YRB YRR XR XA XB XR Table 2
The area in figure 1 which is shaded in dark grey corresponds to matrix A. This matrix provides information on trade of intermediate goods. More precisely, each submatrix, as e.g. ABA, indicates
the value of intermediates flowing from a particular country industry (indicated by the row, here: B) to a recipient industry of a country (indicated by the column, here: A). In the case of the WIOD, which covers 35 industries, each submatrix is of a 35 x 35 dimension. Similarly, the area which is shaded in light grey corresponds to matrix Y. Different from matrix A, the elements of Y are 35 x 1 vectors. These vectors specify the value of final goods produced in a particular country industry (indicated by the row) which is absorbed by a recipient country (indicated by the column). In accordance with the gross output identity, stating that all gross output is used either as intermediate or final good by the domestic or foreign economy, the total row sum and the sum of columns for intermediate use indicate the value of gross output, X.
3Besides the 27 members of the European Union 13 other countries are included. These countries are: Canada,
the United States, Brazil, Mexico, China, India, Japan, South Korea, Australia, Taiwan, Turkey, Indonesia and Russia
4.2
Construction Technique of World Input Output Tables
This subsection focuses on the description of two main challenges in the construction of World Input-Output Tables (WIOT). Figure 2 provides a schematic overview about the construction process.
Figure 1: Construction Process of the WIOT (based on Timmer (2012))
The authors of the WIOD used national supply and use tables (SUTs) as main building blocks for the construction of WIOT. National SUTs provide information about the production of goods by industry as well as information on the good’s use by industries or final consumers. However, these tables are neither time consistent nor harmonized across countries. Furthermore, for some countries, SUTs are only available for a limited set of years. For this reason, data has been harmo-nized in terms of industry- and product-classification not only across time but also across countries. Hence, the classification list of the WIOD is based on the CPA4 and NACE5 rev 1 whereby the
WIOD classification list comprises 59 products and 35 industries. Moreover, national SUTs were enriched with consistent data from national accounts (NAS) and international trade statistics (ITS). Firstly, in order to construct consistent time-series, national SUTs were adjusted and interpolated
4Classification of Products by Activity.
with data on industry output and main final demand from NAS. Secondly, international SUTs were obtained by linking harmonized national SUTs across countries. With regard to the international linkages in the production process, it is crucial, at this step, to determine the share of imported products which is used as input. In this context, many providers of data like the GTAP rely on the proportionality assumption. According to this assumption, an economy-wide fixed percentage of total use of a product is presumed to be imported - regardless its purchasing industry(Dietzenbacher et al., 2013). However, this assumption risks to ”understate the use [...] of foreign inputs, espe-cially in those sectors where they are most used” (Puzzello, 2012). To circumvent this inaccuracy, the authors of the WIOD used bilateral trade data on import flows from the UN COMTRADE database at the HS6-digit product level. This specification distinguishes 5,000 products which were allocated to three broad use categories according to the Broad Economic Categories (BEC): Thus, imports were finally classified as either intermediate good, final consumption or investment. By pro-ceeding this way, the authors of the WIOD separated imported intermediate goods from domestic intermediates. Yet, within these use categories, the allocation was based on the proportionality assumption(Dietzenbacher et al., 2013). The use of this assumption is primarily caused by a lack of sufficiently detailed information at this level. Hence, regarding the intermediate use of goods by industry, the applied ratios between imported and total use of a product were the same across indus-tries, but still different from ratios for consumption purposes. Different from standard approaches applying the proportionality assumption at first stage, this procedure allows import proportions to differ widely across the three use categories. In a further step, the import shares of products within use categories were assigned to their respective country of origin. Finally, international SUTs were merged to a World SUT and eventually further transformed into industry-by-industry WIOT.
4.3
Critical Assessment of the Data
In general, the WIOD is well suited to serve as data source for the application of the decomposition formula presented in section 3. However, there are also some limitations worth mentioning. Firstly, Ghellar et al. (2012) criticize that trade flows are based on import statistics only. However, the authors of the WIOD argue that this choice was necessary as official bilateral trade flows were not fully consistent due to reporting errors. They argue that import flows were chosen as these flows were valued as more reliable than export data (Timmer, 2012). Secondly, while it is a big advantage that the WIOD does not rely on the proportionality assumption in the process of import allocation to the three use categories, the proportionality assumption is still used within these categories.
According to Timmer et al. (2015), this procedure is only a second-best solution but it is seen as inevitable due to a lack of additional information at a less aggregated level. Thus, they point to the importance of improved data collection on the sourcing and use of products by statistical institutes.
5
Results
The section is divided into three parts. Firstly, an overview about the decomposition results over time will be given. The subsequent subsections will focus on the development of the foreign and domestic value added in gross exports of the French and German automotive sector: Subsection 5.2 will link foreign value added to the concept of vertical specialization. The last subsection, 5.3, deals with the development of domestic value added.
5.1
Gross Export Decomposition of the French and German
Automo-tive Industry
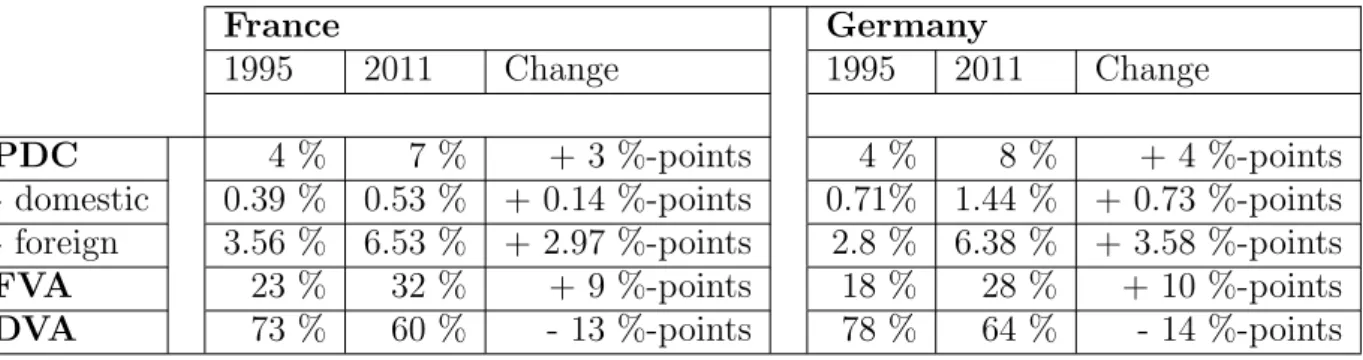
Table 2 shows the decomposition of gross exports according to formula 7 for the French and German automotive industry of 1995 as compared to 2011.6 In this context, it is important to highlight
that domestic value added is not only consisting of value added by the automotive sector but also of value from other industries of the country such as servicing, manufacturing etc.
France Germany
1995 2011 Change 1995 2011 Change
PDC 4 % 7 % + 3 %-points 4 % 8 % + 4 %-points - domestic 0.39 % 0.53 % + 0.14 %-points 0.71% 1.44 % + 0.73 %-points - foreign 3.56 % 6.53 % + 2.97 %-points 2.8 % 6.38 % + 3.58 %-points FVA 23 % 32 % + 9 %-points 18 % 28 % + 10 %-points DVA 73 % 60 % - 13 %-points 78 % 64 % - 14 %-points
Table 3
While the overall change in %-points for both country sectors differs only to a small extent, the initial values of domestic and foreign value added in 1995 differ more: In the French automotive sector, 73% of the value was created in France while roughly one quarter, 23%, was added by foreign countries. With a value of 78%, the domestic value added by the German economy in 1995 was slightly higher whereas the foreign value added, 18%, was smaller than in the French automotive sector. Similarly, the overall part of double counting in gross exports developed quite
similar from 4% in 1995 to 7% (FRA) and 8% (DEU) in 2011. Yet, there are differences with regard to the the development of the purely double counted fraction of domestic and foreign value. In France there was an increase in the purely double counted part of the foreign value added by 0.14%-points while in Germany there was an increase of 0.73%-points. Moreover, the change in the purely double counted fraction of foreign value added is more pronounced in gross exports of the German automotive sector so it differs by 0.61%-points. Timmer et al. (2014) also decomposed gross exports of the German automotive industry. Given the fact, that the authors did not account for the purely double counted component, the values presented by them coincide with calculations from table 2. While Timmer et al. (2014) focus on two points in time the present study sheds additional light on the development of foreign and domestic value added in gross exports over time.
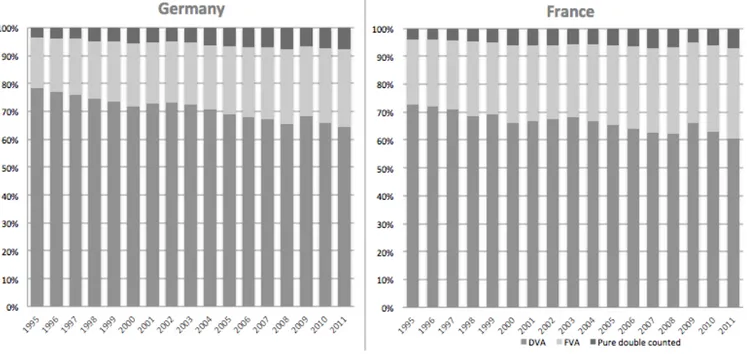
Figure 2: Decomposed Gross Exports
Looking at the development of foreign and domestic value from 1995 until 2011, a downward trend of domestic value added in gross exports of both country sectors can be identified. This downward trend was interrupted two times: Firstly, just after the turn of the millennium the domestic as well as the foreign value added stagnated. Yet, the decrease of domestic value added restarted in 2004. Secondly, the domestic (foreign) value added in gross exports of the automotive industry increased (decreased) in 2009 for both countries. These developments can be seen as the consequence of a general contraction of global trade in response to the burst of the dot com bubble in 2000 and the global financial crisis starting in the US in 2007. A demand reduction does not only affect the overall value of gross exports of a country but also its value added components from domestic and foreign sources. The mechanism behind this effect can be explained looking at the
elasticity of trade with respect to GDP as, for example, described by O’Rourke 2009. He points to the fact that a negative shock in demand leads to a more than proportional reduction of trade while GDP reacts proportionally. As previously shown, the value of gross exports comes either from domestic or foreign sources. The foreign value added is directly affected by variations of trade since it is determined by the usage of imported intermediates. On the other hand, domestic value added describes a country’s GDP which is included in gross exports. If GDP and the usage of imported intermediates (foreign value added in gross exports) were affected by a reduction in demand to the same extent, there would be a similar decrease in the absolute amount of GDP and foreign value added. Thus, the relative proportions would be untouched. Yet, GDP and the amount of intermediates react in an asymmetric way. Consequently, their value contribution shares differ and foreign value added in gross exports stagnates or declines. The effect is especially visible in 2009: While the German automotive industry suffered an overall drop in value of gross exports by 29%, the magnitude of drop in foreign and domestic value added in exports differed. The foreign value added declined by 33% whereas the domestic value added, GDP, in exports was reduced by 25%. Similarly, the foreign value added in gross exports of the French automotive sector declined by 24% while the domestic value added suffered a lower reduction of 14%, thus leading to an overall decline in value of gross exports of 18%. However, in 2011 both the French and German automotive sector reached again their respective pre crisis levels of gross exports.
5.2
Foreign Value Added in Gross Exports as a Measure of Vertical
Specialisation
As stated in section 2, Hummels et al. (2001) conceptualized the idea of vertical specialization. According to them, the vertical specialization pattern of a country can be proxied by the value of imported inputs being used for the production of goods which are further exported. Thus, in the mathematical framework for the decomposition of gross exports on an aggregate level provided by Koopman et al. (2014) vertical specialization is measured as the foreign value added share in gross exports. In contrast to the VAX ratio proposed by Johnson and Noguera (2009), the concept of vertical specialization can also be transferred to a decomposition on the sectoral level (Wang et al. 2013). In this context, one fact is worth mentioning: while in the previous subsection purely double counted content was excluded from the foreign value added share, it is necessary to be included in the calculation of the degree of vertical specialization. The reason being that double counting also gives information about the extent to which a country is involved in the process of global
value creation and to what degree the country is specialized. Consequently, purely double counted content of foreign value added is included in the foreign value added fraction.
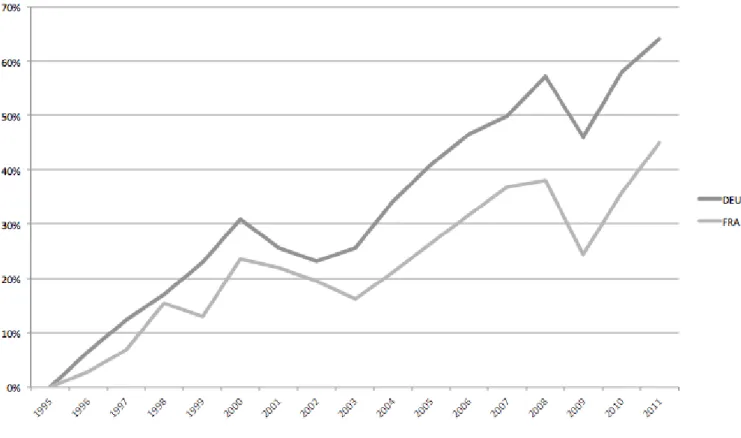
In order to shed light on the different degree of specialization of the French and German auto-motive industry over time, figure 3 depicts the development of vertical specialization in comparison to its initial value of 1995.
Figure 3: Vertical Specialization over Time (%-change compared to 1995)
Given the fact that foreign value added in the German automotive sector’s gross exports was initially smaller than the one in France (21% (DEU) compared to 27%(FRA)), the intensity of vertical specialization was more pronounced in the German than in the French automotive industry. From 1995 to 2011, vertical specialization in the automotive sector of Germany increased by 64% and in France by 45%.
During the period between the two crises, from 2003 until 2007/2008, the French as well as the German automotive industry experienced a considerable increase in vertical specialization. As presented in section 2, the driving force behind this development is offshoring and an increase in sourcing of intermediate inputs from abroad. Price pressure from international competitors forced companies to reorganize their value chain. Marin (2010) highlights the importance of cost reduction for international firms to stay competitive in international markets. Hence, countries with a lower wage level such as Eastern European countries as well as China and India were increasingly
involved in the process of value creation (Timmer et al. (2014). For German companies, Marin (2010) identifies the proximity to Eastern European markets as crucial determinant for the decision to outsource activities to these countries. In this context, it is worth mentioning that there is far less work on the topic of specialization patterns which are specific for France. Thus, it is not possible to access whether the less pronounced specialization of the french automotive sector in the 2000s is determined by differences regarding the distance to new offshoring markets in Eastern Europe.
5.3
Domestic Value Added in Gross Exports
Figure 4 shows both total gross exports and domestic value added in gross exports of the French and German automotive sector. In order to enable a comparison over time, all values are expressed in prices of 1995. Therefore, values have been deflated using annual data on producer prices in industry from Eurostat.
Figure 4: Domestic Value Added in Gross Exports in Mio. of US $
For the time period from 1995 to 2011, there is a great difference between growth of total gross exports of the French and German automotive sectors: While French gross exports increased by a factor of 1.9, German gross exports more than doubled (factor of DEU: 2.33). With regard to the finding of subsection 5.1, figure 4 reveals an important dynamic: As a consequence of the ongoing fragmentation of production, the share of value added in gross export, which is generated by domestic firms, is declining. However, a glance at the increase of absolute numbers of domestic
value contribution suggests that France and Germany benefitted from their reorganization of value chains. However, this intuition is countered with a finding of Timmer et al. (2013), who point to the importance of increasing demand from abroad for products of the automotive industry during the time period from 1995 until 2008. By recalculating total factor income from activities along the global value chain for constant demand, the authors find that the change in the production structure was not growth enhancing for income and value creation. This finding seems to be in line with results from other authors such as Sinn (2006): Within the German automotive industry he detected a decline in domestic value added per unit of output. However, the change in the production structure and hence the increase in vertical specialization might have been essential for the competitiveness of the automotive industry in Germany and France. As outlined in the previous subsection, Marin (2010) values vertical specialization as necessary to compete in international markets. Consequently, the reorganization of supply chains can be seen as important precondition in attracting additional demand. This enables the economy to expand production and thus to generate value which is flowing back to its production factors. Hence, this finding can be valued as crucial argument to mitigate public concerns that increasing production sharing across countries had negative effects on the capability of an economy to reimburse its factors of production.
With regard to the development of absolute domestic value added in gross exports, a difference between the countries can be detected: In France the absolute domestic value added grew by 56%, whereas the increase in Germany was 91%. This gap might either stem from a difference in the increase of demand for products from the automotive sector or from different specialization patterns. The increase in demand for goods from the French automotive sector was lower than the increase in Germany. This fact is caused by a shift of demand for intermediate goods away from French industries triggering a loss of France’s position as provider of inputs for other countries. Furthermore, the gap could be due to differences in specialization in more or less skill intensive activities. While activities involving high-skilled labour add much value in the production process, activities involving medium and low-skilled labour add less. In general, Timmer et al. ( 2014) find that high income countries specialized more in high-skilled labour activities. For the German automotive sector, they find a skill-biased increase in demand for jobs: the use of low and medium-skilled workers increased by 6% and 24%, respectively, whereas the use of high medium-skilled labour grew by 50%. On the one hand, this fact is driven by the increased demand for German cars and on the other hand, by the reorganization of the value chain. However, a comparable analysis has not yet been done for the French sector. Hence, no distinct conclusion can be drawn with regard to the effect of differences in specialization on absolute gains of domestic value added.
6
Conclusion
The present paper is aimed at shedding light on the development of value added of the French and German automotive industry during the period from 1995 to 2011. With a decomposition method on the sectoral level based on the mathematical framework of Koopman, Wang and Wei (2014), gross exports of the automotive sector have been fully decomposed into their various components. The results seem to furnish proof to the fact that offshoring and increased sourcing of intermediates from abroad led to a declining domestic value added in gross exports of the automotive sector whereas, in turn, foreign value added increased. These findings are valid for France as well as for Germany. Linking the result on foreign value added to the concept of vertical specialization illustrated the fact that the vertical specialization process was more pronounced for the German than for the French automotive industry. A look at the absolute domestic value added revealed an important insight into the development of domestic value creation. Even though the domestic value added in relative terms is shrinking over time, it is increasing in absolute terms. At this point, there is a big difference between the French and German domestic value contribution over time: While the German automotive sector increased its domestic value added by 91%, the French value contribution in gross exports of the automotive industry increased only by 56%. Hence, the sectors which are involved in the production of export goods of the German automotive sector gained greater capacity to reimburse their production factors capital and labour. Some authors explain the overall growth of domestic value added in gross exports by a pronounced increase in demand. However, they point to the fact that sourcing of intermediates from low wage countries led to a loss of the French position as provider for inputs. As there exists no empirical analysis of specialization patterns of the French automotive industry, no profound evaluation on different gains through specialization can be made. Thus, there is room for further research.
References
David Autor, David Dorn, and Gordon Hanson. The china syndrome: Local labor market effects of import competition in the united states. American Economic Review, 103(6):2121–2168, 2013. Erik Dietzenbacher, Bart Los, Robert Stehrer, Marcel Timmer, and Gaaitzen de Vries. The
con-struction of world input-output tables in the wiod project. Economic Systems Research, 25(1): 71–98, 2013.
Ferdinand Dudenh¨offer. Wie viel deutschland steckt im porsche. Ifo Schnelldienst, 58(24), 2005. Eurostat. Producer prices in industry, total - annual data, percentage change [sts inppgr a]. CPB Netherlands Bureau for Economic Policy Analysis. Cpb worldtrade monitor.
Mark Ghellar, Marinos Tsigas, and Zhi Wang. How a global inter-country input-output table with processing trade account can be constructed from gtap database. Preliminary Draft, 2012. David Hummels, Jun Ishii, and Kei-Mu Yi. The nature and growth of vertical specialization in
world trade. Journal of International Economics, 54(1):75–96, 2001.
Robert Johnson and Guillermo Noguera. Accounting for intermediates: Production sharing and trade in value added. Journal of International Economics, 86(2):224–236, 2012.
Robert Koopman, Zhi Wang, and Shang-Jin Wei. Tracing value added and double counting in gross exports. American Economic Review, 104(2):459–494, 2014.
Wassily Leontief. Quantitative input and output relations in the economic system of the united states. The Review of Economics and Statistics, 18(3):105–125, August 1936.
Dalia Marin. The opening up of eastern europe at 20-jobs, skills and ”reverse maquiladoras” in austria and germany. Munich Discussion Paper, (14), 2010.
Kevin O’Rourke. Collapsing trade in barbie world.
Laura Puzzello. A proportionality assumption and measurement biases in the factor content of trade. Journal of International Economics, 87:105–111, 2012.
Hans-Werner Sinn. The pathological export boom and the bazaar effect: How to solve the german puzzle. The World Economy, 29(9):1157–1175, 2006.
Marcel Timmer. The world input-output database (wiod): Contents, sources and methods. WIOD Working Paper Series, (10), 2012.
Marcel Timmer, Bart Los, Robert Stehrer, and Gaaitzen de Vries. Fragmentation, incomes and jobs. an analysis of european competitiveness. 57th Meeting of Economic Policy, 2013.
Marcel Timmer, Abdul Azeez Erumban, Bart Los, Robert Stehrer, and Gaaitzen de Vries. Slicing up global value chains. Journal of Economic Perspectives, 28(2):99–118, 2014.
Marcel Timmer, Erik Dietzenbacher, Bart Los, Robert Stehrer, and Gaaitzen de Vries. An illus-trated user guide to the world input-output database: the case of global automotive production. Review of International Economics, 2015.
Zhi Wang, Shang-Jin Wei, and Kunfu Zhu. Quantifying international production sharing at the bilateral and sectoral level. NBER Working Paper, (19677), 2013.
Appendix
For ease of technical implementation, a less aggregated formula than equation 7 has been used to decompose bilateral gross exports. The formula is taken from Wang et al. (2013).
Esr = VsBss#Ysr+ VsLss#AsrBrrYrr+ VsLss#Asr G X t6=s,r BrtYtt + VsLss#AsrBrr G X t6=s,r Yrt+ VsLss#Asr G X t6=s,r G X u6=s,t BrtYtu + VsLss#AsrBrrYrs+ VsLss#Asr G X t6=s,r BrtYts+ VsLss#AsrBrsYss + VsLss#Asr G X t6=s BrsYst+ (VsBss− VsLss) #AsrLrrXr + VrBrs#Ysr+ VrBrs#AsrLrrYrr+ VrBrs#AsrLrrEr∗ + G X t6=s,r VtBts#Ysr+ G X t6=s,r VtBts#AsrLrrYrr+ G X t6=s,r VtBts#AsrLrrEr∗