Université de Montréal
The psychophysics of decision making in a
two-direction random dot motion target selection task
par Edmund Lam
Département de neurosciences Faculté de médecine
Mémoire présenté à la Faculté des études supérieures et postdoctorales en vue de l’obtention du grade de la Maîtrise en
sciences neurologiques
Avril 2014
Université de Montréal
Faculté des études supérieures et postdoctorales
Ce mémoire intitulé :
The psychophysics of decision making in a
two-direction random dot motion target selection task
Présenté par : Edmund Lam
a été évalué par un jury composé des personnes suivantes :
Numa Dancause, Ph.D. président-rapporteur John F. Kalaska, Ph.D. directeur de recherche Erik P. Cook, Ph.D. membre du jury
i
Résumé
La tâche de kinématogramme de points aléatoires est utilisée avec le paradigme de choix forcé entre deux alternatives pour étudier les prises de décisions perceptuelles. Les modèles
décisionnels supposent que les indices de mouvement pour les deux alternatives sont encodés dans le cerveau. Ainsi, la différence entre ces deux signaux est accumulée jusqu’à un seuil décisionnel. Cependant, aucune étude à ce jour n’a testé cette hypothèse avec des stimuli contenant des mouvements opposés. Ce mémoire présente les résultats de deux expériences utilisant deux nouveaux stimuli avec des indices de mouvement concurrentiels. Parmi une variété de combinaisons d’indices concurrentiels, la performance des sujets dépend de la différence nette entre les deux signaux opposés. De plus, les sujets obtiennent une performance similaire avec les deux types de stimuli. Ces résultats supportent un modèle décisionnel basé sur l’accumulation des indices de mouvement net et suggèrent que le
processus décisionnel peut intégrer les signaux de mouvement à partir d’une grande gamme de directions pour obtenir un percept global de mouvement.
Mots-clés : prise de décision, psychophysique, intégration sensorimotrice, kinématogramme
ii
Abstract
Random dot kinematograms are used in visual psychophysics with the two-alternative forced-choice paradigm to study the process of simple perceptual decisions. Mathematical models of this process assume that stochastic motion evidence for the two alternative choices is encoded in the brain, and that the difference in evidence is accumulated towards a decision bound. However, no study to date has tested this assumption using stimuli with different levels of mutually opposing evidence in both directions. This thesis presents the results of two
experiments using two novel stimuli with opposing coherent motion evidence. Over a variety of competing evidence combinations, subject performance was based on the net difference in the opposing signals. Furthermore, task performance was similar with both types of stimuli. These results support a decision model based on the accumulation of net evidence, and suggest that the decision process is capable of integrating motion evidence from a wide range of directions to obtain a global percept of motion.
Keywords: Decision making, psychophysics, sensorimotor integration, random dot motion,
iii
Table of Contents
Résumé ... i
Abstract ... ii
Table of Contents ... iii
List of Tables ... v
List of Figures ... vi
List of Abbreviations ... viii
Acknowledgements ... ix
I. Introduction
... 1I.1. The Psychophysics of Decision Making ... 2
I.1.1.Two-Alternative Forced-Choice Tasks ... 4
I.1.2. Random Dot Kinematograms ... 6
I.2. Models of Decision Making ... 12
I.2.1. Decision models with noiseless evidence accumulation ... 13
I.2.2. Drift Diffusion Models ... 15
I.2.3. Dual Drift Diffusion Models ... 19
I.2.4. Dual Diffusion Models with Mutual Inhibition ... 20
I.3 Objectives ... 22
I.3.1 Effect of directly competing motion ... 22
I.3.2 Integration of the global motion signal ... 24
II. Article
... 27 Abstract ... 29 Introduction ... 30 Methods ... 32 Results ... 50 Discussion ... 68 References ... 77 Tables ... 82 Figures ... 83 Figure/Table Legends ... 99iv
III. Overall Discussion
... 104III.1. Review of the main objectives ... 104
III.1.1. Effect of directly competing motion ... 104
III.1.2. Integration of the global motion signal ... 108
III.2. Quantifying motion evidence in RDKs ... 111
III.3. Limitations to the stimuli used ... 115
III.4. Future Directions ... 118
IV. Conclusion
... 127References
... 128v
List of Tables
vi
List of Figures
I. Introduction
Figure I.1: Illustration of psychometric functions for “yes-no” and 2AFC
paradigms . . . 3
Figure I.2: Random dot kinematogram . . . 7
Figure I.3: Single and dual drift-diffusion models . . . 17
Figure I.4: Network architecture of various decision models . . . 18
II. Article
Figure 1: Experimental paradigm . . . 83Figure 2: Spatial distributions of dot pixel displacements for the Narrow Coherence task . . . 84
Figure 3: Spatial distributions of dot pixel displacements for the Brownian Drift task . . . 85
Figure 4: Polar histograms of the frequencies of the directions of dot displacements for the Narrow Coherence (NC) task . . . 86
Figure 5: Polar histograms of the frequencies of the directions of dot displacements for the Brownian Drift (BD) task . . . 87
Figure 6: Auto-correlation analysis . . . 88
vii
Figure 8: The spatiotemporal motion filters used in the motion energy
analysis . . . 90
Figure 9: Psychometric curves for Experiment 1 . . . 91
Figure 10: Psychometric curves for Experiment 2 . . . 92
Figure 11: Psychometric curves for the two outlier subjects in Experiment 2 . . . 93
Figure 12: Psychometric curves for the remaining four subjects in Experiment 2 . . . 94
Figure 13: Framewise pixel displacement (FPD) measures for Experiment 2 . . . 95
Figure 14: Motion energy measures for Experiment 2 . . . 96
Figure 15: Reaction times as a function of motion signal measured in the NC (left figures) and BD trials (right figures) . . . 97
Figure 16: Dual-diffusion race model fit of the Experiment 1 RT data . . . 98
III. Discussion
Figure III.1: Motion energy (ME) values measured at different angles from the coherent motion for the Narrow Coherence (NC) and Brownian Drift (BD) stimuli . . . 113Figure III.2: Scatterplot of single-trial reaction times as a function of mean Framewise Pixel Displacement . . . 120
Figure III.3: Integration of single-trial FPD aligned to the start of the trial . . . 121
Figure III.4: Integration of single-trial FPD aligned to the end of the trial . . . 122
Figure III.5: Reverse correlation analysis of trial FPD averaged and aligned to the end of the trial . . . 123
viii
List of Abbreviations
2AFC Two-alternative forced-choice
BD Brownian Drift
dlPFC Dorso-lateral prefrontal cortex DPC Dorsal premotor cortex
DV Decision variable
FEF Frontal eye fields
FPD Framewise Pixel Displacement
LATER Linear Accumulation to Threshold with Ergodic Rate LBA Linear Ballistic Accumulator
LIP Lateral intraparietal area LFP Local field potential
M1 Primary motor cortex
MPC Medial premotor cortex
MT Middle temporal area
NC Narrow Coherence
PFC Prefrontal cortex
RDK Random dot kinematogram ROC Receiver operating characteristic
RT Reaction time
SC Superior colliculus
S1 Primary somatosensory cortex S2 Secondary somatosensory cortex V1 Primary visual cortex
ix
Acknowledgements
I would like to express my most sincere gratitude to my director Dr. John F. Kalaska for his guidance, support and encouragement throughout the duration of my project. I would also like to thank my project committee members Dr. Numa Dancause and Dr. Paul Cisek for their advice during my research. I would like to extend my appreciation to all the members of the lab for their company and support. I would like to thank to my parents, who have always encouraged me to pursue academic excellence. Finally I wish to express my gratitude to Rosa for her constant love and presence in my life.
I. Introduction
Decision making is a fundamental cognitive process that is studied in many disciplines, from political science, management science, and computer science, to economics, sociology and cognitive psychology. While each discipline studies different forms of decision making, the general decision process is similar: it involves “a commitment to a proposition or plan of action based on information and values associated with the possible outcomes” (Shadlen and Kiani, 2013). Decisions could concern such seemingly simple questions such as whether or not a sensory event had occurred (“signal detection”), what was the nature of the stimulus (“signal discrimination”), what action to take in response to the stimulus (“action selection”), or more complex questions such as what stocks to buy or sell, what restaurant to go to for dinner or for which political party to vote. The scope of this present work is to study the process of simple perceptual decision making, and to study the properties of the neural mechanisms underlying this process.
In this research project, I will examine how subjects making perceptual decisions about dots moving in different directions on a screen can give insight into how the brain integrates evidence for alternative choices. I start by giving an overview of several topics to provide context for the project. This introduction will consist of three sections. The first section is an overview of the psychophysics of decision making and random dot kinematograms. The second part will be an overview of the theoretical models of decision making. In the third part I will describe the objectives and hypotheses of the project. This introductory section is followed by one article detailing part of my work on the project. Finally I will conclude with
an overall discussion and a summary of the main findings, as well as a brief description of the further analyses of the experimental data that I am pursuing.
I.1. The Psychophysics of Decision Making
In the field of experimental psychology, the term “psychophysics” is typically used to characterize the study of how a sensory stimulus is experienced by an observer.
Psychophysical experiments involve perceptual tasks in which individual properties of a sensory stimulus are systematically manipulated to examine how these properties affect the observer’s experience of that stimulus (Fechner, 1966). Among the many properties of sensory processing, two have been heavily studied: the point at which an observer can detect a
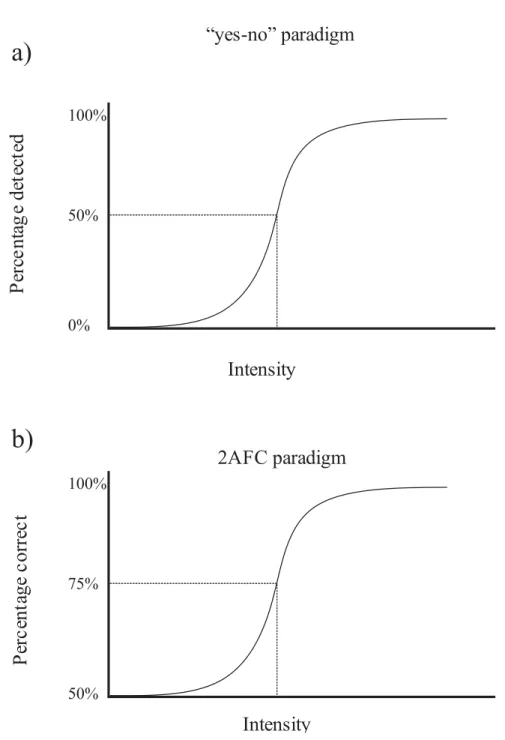
stimulus, called the detection threshold, and the point at which an observer can detect a difference in two similar stimuli, called the discrimination threshold (Gescheider, 2013). These properties can be measured using a simple “yes-no” task paradigm. For example, a simple auditory stimulus detection task could involve playing a tone at different intensities ranging from sub-threshold values to above threshold values and asking an observer to report whether or not they heard the tone. This task produces a psychometric function, as illustrated in Figure I.1a. By convention, the threshold for detection is set to the stimulus intensity at which observers report hearing the tone 50% of the time. In an auditory stimulus
discrimination task, on the other hand, two tones could be presented to the observer with varying relative differences in the intensity of the two tones. The observer is then asked to report whether the intensity of the two tones was the same or different. Stimulus
Intensity
Intensity
P
er
ce
nt
ag
e
de
te
ct
ed
P
er
ce
nta
ge
co
rr
ect
“yes-no” paradigm
2AFC paradigm
50% 100% 0% 75% 100% 50%a)
b)
timbre (Hirsh and Watson, 1996). Similar to the detection task, the threshold for
discrimination is set to the point at which observers report that the two tones are different 50% of the time. This simple “yes-no” paradigm has been used to study the stimulus properties of all sensory domains, from vision, hearing and touch to taste and smell. For example, in the domain of vision, this task has been used to measure detection and discrimination thresholds for luminance, contrast, and color as well as more complex percepts such as orientation and visual motion.
One of the limitations to the “yes-no” paradigm is that the observer must choose between reporting the presence or absence of an event. This can introduce a response bias, in which the observer might be more biased towards reporting a “yes” or “no” based on an internally defined response criterion (Swets, 1961; Macmillan and Creelman, 1996).
Furthermore, this response criterion could vary over time for the same observer. Therefore the measurement of sensory sensitivity can be contaminated by centrally-generated influences on the decision process. One paradigm that was developed in order to reduce the bias in the measure of sensory sensitivity is the two-alternative forced-choice task (Linschoten et al., 2001).
I.1.1.Two-Alternative Forced-Choice Tasks
The two-alternative forced-choice (2AFC) task asks a participant to make a decision between two alternative choices based on the sensory stimuli shown (Green and Swets, 1966; Swets, 1986; Macmillan and Creelman, 1996). While the “yes-no” paradigm presents the observers with a choice between the presence or absence of an event, the 2AFC task presents the observers with a choice between two possible event alternatives. For example, consider a 2AFC auditory stimulus discrimination task: Instead of the “yes-no” paradigm, where
observers are asked whether two tones have the same or different intensities, in the 2AFC paradigm, observers would be asked to indicate whether the first or second tone was more intense. As a further example, a vibrotactile stimulus detection task could involve a near-threshold vibration that is presented randomly to an observer’s right or left index finger. The observer must then report which index finger received the vibration stimulus. Similarly, a vibrotactile frequency discrimination task could involve two vibrations that are presented in two sequential time intervals to the observer. The observer is then asked to compare the frequencies of the two vibrations and report whether the first or second stimulus had a higher frequency vibration. By adjusting the difference in the vibration frequencies presented to the observer, one could generate a similar psychophysical curve to the ones generated with the “yes-no” paradigm. Since the observer must always choose one of the alternatives, their performance on 2AFC tasks will range from chance probability (50%) to perfect
discrimination (100%) and the discrimination threshold is set to 75% (Figure I.1b). With the development of neural recording techniques, psychophysics tasks were adopted by neurophysiologists to study the neural mechanisms of sensory processing.
Mountcastle and colleagues pioneered this approach in the 1960s, and were among the first to relate neural activity recorded in non-human primates with human psychophysics. They showed that neural activity in the primary afferents of anesthetized monkeys varied with the properties of a vibrational stimulus, and that this neural activity had a measurable quantitative association with the psychophysical performance of human observers performing a detection task with the same vibrotactile stimuli (Werner and Mountcastle, 1965; Mountcastle et al., 1967; Talbot et al., 1968).
Furthermore, the 2AFC paradigm proved to be useful in the study of the neural basis of decision making by allowing experimental neurophysiologists to study the activity of neurons during the deliberation process of a decision while it is being made (Gold and Shadlen, 2001; Cisek and Kalaska, 2002; Roitman and Shadlen, 2002; Cisek and Kalaska, 2005; Gold and Shadlen, 2007; Churchland et al., 2008). For example, Romo and colleagues used the vibrotactile frequency discrimination task to study the activity of neurons in the
somatosensory cortex (primary, S1; secondary S2), the premotor cortex (ventral, VPC; dorsal DPC; and medial, MPC), the prefrontal cortex (PFC) and the primary motor cortex (M1). While neurons in S1 encoded the sensory properties of the two vibration stimuli as they were presented (Hernández et al., 2000; Salinas et al., 2000), the activity of neurons in S2, VPC, DPC, MPC, PFC and M1 were correlated with later stages in the decision process, such as the encoding of the first vibration into working memory, the comparison of the two vibrational stimuli, as well as the animal’s final decision (Romo et al., 1999; Hernández et al., 2002; Brody et al., 2003; Romo et al., 2004; Hernández et al., 2010). In summary, researchers have embraced the combination of psychophysical measurements and neurophysiological
recordings in order to understand the neural basis of decision making.
I.1.2. Random Dot Kinematograms
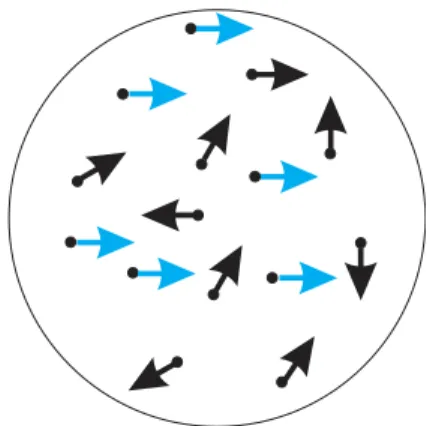
One stimulus commonly used in conjunction with 2AFC tasks to study decision making is the random dot kinematogram (RDK). Random dot motion was used as early as the 1970s to study the process of visual motion detection and discrimination (Braddick, 1974; Lappin and Bell, 1976; Ball and Sekuler, 1979). In a standard RDK (illustrated in Figure I.2), a group of dots are displaced randomly on a screen. In order to evoke a percept of coherent visual motion, a portion of these dots are chosen to move coherently in one direction
(Williams and Sekuler, 1984; Downing and Movshon, 1989; Britten et al., 1992). Used in a 2AFC direction discrimination paradigm, observers are asked to view an RDK stimulus and decide between two possible directions of coherent motion among the background of random dot motion.
Figure I.2: Random dot kinematogram
RDK stimuli are ideal psychophysical stimuli to study visual motion: they minimize position cues, the individual stimulus elements (dots) usually do not have any easily
recognizable features that would make them easy to identify and track individually, and they can be generated with easy control over other visual parameters, such as contrast, luminance, as well as the spatial-temporal frequency content of the stimulus (Newsome and Pare, 1988). Furthermore, RDK stimuli are ideal perceptual stimuli for decision-making studies for several other reasons. First, they tend to lead to longer reaction times than many other sensory stimuli. This led to the development of a reaction-time variant of the 2AFC paradigm in which
observers could indicate their choice as soon as they made their perceptual decision. This facilitates the study of the time course of the decision process by using the time of onset of the motor action that signals the subject’s decision as a distal surrogate for the time of the end of
the decision process (Roitman and Shadlen, 2002; Gold and Shadlen, 2007). Second, RDKs can easily provide different amounts of visual motion signal (“evidence”) by modifying the amount of coherently moving dots in the stimuli. Finally, the RDK stimulus paradigm offers a number of other ways in which to probe the decision-making process. For instance, one can transiently increase or decrease the amount of sensory evidence for different choices at different times in the trial (Huk and Shadlen, 2005; Thura and Cisek, 2014). The coherent-motion evidence signal and random-noise coherent-motions can be distributed onto different dots in different ways, such as partitioning them onto two separate sub-groups of dots for the entire duration of a stimulus, or onto continually-changing groups of dots according to different schedules (Williams and Sekuler, 1984; Snowden and Braddick, 1989; Pilly and Seitz, 2009; Schütz et al., 2010).
Similar to the aforementioned studies combining the vibrotactile discrimination task with neural recordings in the somatosensory cortex to study the neural basis of vibrotactile frequency discrimination, RDKs were combined with neurophysiological studies to show that the middle temporal (MT/V5) area of monkeys contributed to the perception of visual motion. MT is an extrastriate visual cortical area in which the majority of neurons are preferentially activated by moving visual stimuli (Dubner and Zeki, 1971; Zeki, 1974; Albright, 1984; Newsome et al., 1986; Mikami et al., 1986a, 1986b). The ability to detect coherent motion in an RDK stimulus was impaired in monkeys after lesions to the MT area (Newsome and Pare, 1988), as well as with a human patient with damage in the corresponding extrastriate visual cortex (Baker et al., 1991). A study by Britten et al. (1993) showed that motion sensitive neurons in area MT of monkeys would discharge at a rate proportional to the amount of coherent motion in their preferred direction of motion. The neurometric sensitivity profile of
these neurons as a function of stimulus motion coherence closely resembled the psychometric curves of the motion sensitivity of the animal observers performing a 2AFC RDK motion discrimination task (Britten et al., 1992), further solidifying the evidence that MT neurons contributed to the perception of visual motion.
RDK stimuli were subsequently used in further 2AFC action-choice tasks to study the relationship between neural activity in area MT and the process of decision making. When analyzed on a trial-to-trial basis, the variability of the firing rates of MT neurons was weakly but significantly correlated to the monkey’s choices (Britten et al., 1996; Cook and Maunsell, 2002). Furthermore, Salzman et al. (1992) demonstrated that microstimulation in area MT could bias the observing monkey's decision choice towards the preferred direction of motion of the neurons in the locally stimulated area. In addition, Ditterich et al. (2003) used a reaction-time version of the RDK task to demonstrate that microstimulation would speed up the monkey's reaction times towards the direction of preferred motion of the neurons in the stimulated area, and slow down reaction times in the opposite direction. These studies demonstrated that the activity of MT neurons was causally related to the perceptual decision-making process in the task.
To report their perceptual decisions, the monkeys typically made saccadic eye
movements in the direction of the perceived RDK motion. However, MT cells are not related to saccadic eye movements. To study how the monkeys linked the perceptual decision process to the planning and execution of the reporting saccadic eye movements, researchers then focused on saccade-related areas, such as the lateral intraparietal (LIP) in monkeys, where many cells discharge as a function of saccade direction and target spatial location (Robinson et al., 1978; Bushnell et al., 1981; Gnadt and Andersen, 1988; Platt and Glimcher, 1997, 1998).
A series of studies by Shadlen and colleagues subsequently established area LIP as an integral part of the decision making process. In an instructed-delay version of the RDK-stimulus task, Shadlen & Newsome (2001) showed that the time course of changes in the activity of saccade-related neurons in LIP varied with the coherence of the RDK stimuli. Furthermore, unlike MT neurons, the changes in activity of the LIP neurons were related to the monkeys’ perceptual decision, whether correct or wrong, that is, how the monkeys interpreted the stimuli rather than their actual physical properties (Shadlen and Newsome, 2001). Using a subsequent reaction-time variant of the RDK paradigm, Roitman & Shadlen (2002) showed that LIP neuronal activity increased gradually over the course of the trial between the onset of the RDK stimuli and the onset of the saccade, at a rate that was proportional to the amount of coherent motion in the neuron's preferred direction. Furthermore, when aligning the neuronal activity to the onset of the saccade, i.e., to the end of the decision process, the firing rate always reached a common level of activity regardless of the motion coherence of the stimuli and rate of accumulation in each trial, suggesting that the decision process was terminated and a saccade initiated once a critical firing rate was reached in LIP.
In another study, Huk & Shadlen (2005) presented brief motion pulses in the RDK stimuli and showed that these pulses increased the firing rate of neurons when the pulse was presented in the neuron’s preferred direction, and decreased activity when the pulse was presented in the opposite direction. Furthermore, the changes in neural activity caused by the motion pulses long outlasted the stimulus changes themselves, consistent with a process of accumulation and retention of the sensory evidence during the trial. A subsequent study by Hanks et al. (2006) showed that microstimulation in LIP during a RDK task led to similar choice biases and RT shifts as the microstimulation studies in area MT described earlier,
further supporting the existence of an integration process in LIP and establishing a causal role between activity in LIP and the choice behaviour of the monkeys. A study by Kiani et al. (2008) showed that when the duration of the RDK stimuli was controlled by the experimenter and variable from trial to trial, the performance of the subjects improved as a function of both RDK stimulus coherence and the duration of observation of the stimuli, also consistent with an evidence integration process. Somewhat surprisingly, however, the observers seemed to adopt a strategy of accumulating information towards a critical decision value rapidly after the onset of the RDK stimuli and terminating the decision process before the end of the stimulus
presentation and ignoring any subsequent sensory input, thereby not profiting from the extra evidence available at the end of longer RDK stimuli. Finally a study by Churchland et al. (2008) extending the RDK task from two to four alternative choices found that the same principles of evidence accumulation towards a threshold could apply to more a complex four-choice task. They also found a gradual non-directional increase in activity as a function of time, even in trials in which there was no coherent motion signal. This non-directional progressive increase in activity is consistent with an “urgency” signal that is thought to drive the DV closer to the decision bound as time progresses in the trial, causing a shortening of the decision process especially in the situation of weak sensory evidence (Ditterich, 2006;
Churchland et al., 2008).
Taken as a whole, these studies presented a strong body of evidence that LIP activity could be related to the accumulation of motion evidence towards a decision, and that the decision process terminated once LIP neuronal activity reached a critical firing rate, triggering the report saccade.
Other studies have used the RDK stimuli to show decision-related activity in the superior colliculus (SC) (Horwitz and Newsome, 1999, 2001), and the dorso-lateral prefrontal cortex (dlPFC) (Kim and Shadlen, 1999). In summary, RDK stimuli have been used with the 2AFC paradigm to study the neural correlates of decision making in a number of eye
movement-related structures, and have yielded extensive evidence consistent with a decision-making process that involves the temporal accumulation of sensory evidence to a decision threshold.
I.2. Models of Decision Making
Experimental psychologists have developed mathematical models to understand how the decision making process works in a 2AFC task. More recently, neurophysiologists have also started using variants of the same models to explain how neuronal activity may be involved in the decision process. One of the main frameworks for modeling the computational basis of decision-making involves a diffusion-like process (Ratcliff, 1978; Smith and Ratcliff, 2004). These models have several similarities: they share common assumptions, they all aim to model key features, and they all address similar questions.
There are three fundamental assumptions underlying these diffusion models, which have been formalized by Bogacz et al. (2006). First, evidence supporting the two alternative choices is integrated over time. Second, this integration process is subject to random
fluctuations or “noise”. Third, a decision is reached once sufficient evidence is integrated to choose one option over the other. The first assumption can be further extended into the neuron/anti-neuron hypothesis, whereby the momentary sensory evidence is encoded by separate “neuron” and “anti-neuron” input populations, with the two populations encoding the
sensory inputs (evidence) for the opposite choices (Gold and Shadlen, 2001). The activity from these pools is then sent to a decision-making mechanism that integrates the encoded evidence for each choice over time either independently, or as a difference in evidence for the two choices, depending on the type of model used.
According to Smith and Ratcliff (2004), there are two features that must be upheld in order to have a plausible model of the 2AFC task. First, the model must accurately represent an observer's reaction times and success rates on varying difficulties of trials. Second, the model must also predict differences in these behavioural measurements when correct or incorrect choices are made. With the advent of neurophysiological research into decision making, a third feature has also emerged - the model should have a plausible neural representation in the brain (Ditterich, 2006).
Finally, these models address several key questions about the decision making process. One question is whether the evidence for the alternative choices is integrated separately by different accumulators, or whether evidence is integrated as a difference between the evidence for the two alternative choices. Another question focuses on the variability of the integration process, the sources of this variability and its ultimate influence on the decision process.
In the following sections I will review four classes of mathematical models of decision making and how they fit with the 2AFC paradigm.
I.2.1. Decision models with noiseless evidence accumulation
The LATER (linear accumulation to threshold with ergodic rate) model, developed by Roger Carpenter, was among the first models to describe the reaction time distributions during simple stimulus detection and movement initiation tasks (Carpenter, 1981; Carpenter and Williams, 1995). In this model, there is no variability in the momentary accumulation of
evidence during a given trial. Instead evidence is accumulated at a constant rate in a ramp-like fashion towards a predefined threshold at which the movement is then initiated. Between trials of the same stimulus strength, however, the rate of accumulation is subject to random
variability; this is the only source of noise in the LATER model. As a result, during repeated trials with the same stimulus, the slope and resulting duration of evidence accumulation will vary between trials with a certain mean and standard deviation. The value of the mean and standard deviation changes when the strength of the sensory signals changes. To accommodate differences in response priorities such as speed versus precision, the LATER model assumes that subjects can adjust the height of the decision threshold. Lowering the decision threshold would allow for faster but less accurate responses, while raising the decision threshold would result in slower but more accurate decisions (Reddi and Carpenter, 2000). In addition, the LATER model assumes that subjects can change the start point of the evidence accumulation process in order to adjust their decision process on the basis of prior knowledge, such as the probability of different stimuli or response choices, or the differential reward value of different responses (Carpenter and Williams, 1995). The LATER model can predict distributions of RTs that fit well with reaction-time distributions during simple movement initiation tasks in a wide range of task conditions (Gold and Shadlen, 2007). However, in the context of the 2AFC task, the LATER model has limitations. First - each LATER module only accumulates
evidence for one alternative and does not address how evidence between two alternatives would be compared. Second, the single-module version of the LATER model usually does not successfully predict choice probabilities and errors in even simple single-response tasks. In order to address these limitations, two or more LATER units can be linked together into increasingly complex circuits to race against each other towards two alternate choices to
predict response times and success/error rates in a variety of different tasks (Asrress and Carpenter, 2001; Leach and Carpenter, 2001; Reddi et al., 2003; Sinha et al., 2006; Story and Carpenter, 2009; Noorani and Carpenter, 2011; Noorani et al., 2011).
Another model with noiseless within-trial evidence accumulation is the Linear Ballistic Accumulator (LBA) model (Brown and Heathcote, 2005, 2008). Similar to the Carpenter models that use two LATER units, the LBA model accumulates evidence for two competing choices separately in two noiseless “ballistic” accumulators, and the rate of accumulation of evidence varies randomly between trials of similar evidence strength. In addition to the
variable rate of accumulation, the LBA model allows for a second source of random inter-trial variability - a variable starting point for the accumulation process from trial to trial. This extra source of variability allows the LBA model to account for reaction times and success/error rates over a range of different task conditions without having to invoke different combinations of computational modules in different tasks, as is the case with the LATER model.
Both the LATER and LBA models assume that the main source of variability in the decision process arises between trials (inter-trial variability). However another family of models assumes that the main source of variability occurs within each trial (intra-trial variability) in the stochastic accumulation of evidence, which can be described as a random walk drift-diffusion process. The next three classes of models all use noisy instantaneous evidence accumulation in their design.
I.2.2. Drift Diffusion Models
An early precursor to the drift diffusion model was independently developed during WWII by Abraham Wald to test the quality of batches of munitions being manufactured (Wald, 1945, 1973), as well as by Alan Turing to help his code-breaking work (Good, 1979; Donovan,
2014). Called the sequential probability ratio test, this procedure was developed as a way to repeatedly test a hypothesis against its alternative and reach a statistically reliable decision as quickly as possible when presented with sequential samples of ambiguous evidence (Bogacz et al., 2006; Shadlen and Kiani, 2013). Several years later, the drift-diffusion model combined the idea of accumulation of repeated sequential samples of ambiguous evidence with a
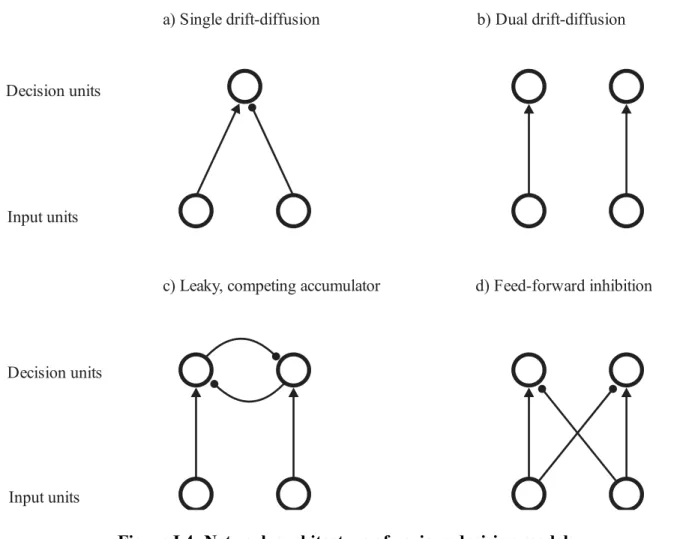
sequential test procedure based on the mathematics of drift-diffusion (random walk) processes to characterize the reaction time latencies and choice probabilities in a 2AFC task (Stone, 1960; Laming, 1968; Ratcliff, 1978). In the original formulation of the drift diffusion model (illustrated in Figure I.3a and I.4a), the evidence for the two choices in the 2AFC task is compared, and the difference in evidence supporting the two choices is accumulated by a single decision variable (DV) over time. The model has an upper and lower decision bound, with the upper bound corresponding to the evidence required to choose one choice, and the lower bound corresponding to the second choice. The DV will integrate the difference in evidence over time until it reaches one of these bounds. At that point, the decision process is terminated and the corresponding choice is selected (Ratcliff and McKoon, 2008). According to drift-diffusion models, the mean rate of evidence accumulation across many trials is
determined by the quality and quantity of sensory evidence, like the LATER and LBA models. However, unlike the LATER and LBA models, inter-trial variability in response timing and choices for a constant stimulus is due to moment-to-moment stochastic noise in the
Figure I.3: Single and dual drift-diffusion models
choose H1
choose H1
choose H2
Accu
m
ul
at
ed
ev
id
en
ce
f
or
h1
ove
r h2
A
cc
um
ula
te
d
ev
id
en
ce f
or
h
1
A
ccu
m
ul
at
ed
ev
id
en
ce f
or
h
2
choose H2
a)
b)
a) Single drift-diffusion
c) Leaky, competing accumulator
b) Dual drift-diffusion d) Feed-forward inhibition Input units Decision units Input units Decision units
Figure I.4: Network architecture of various decision models
The original formulations of the drift-diffusion models assumed perfect integration, that is, the value of the DV at any given moment accurately reflected the entire stream of sensory evidence accumulated up to that time. A modification of this model was proposed by Busemeyer and Townsend (1993), who introduced a “leakage” factor to the accumulation of evidence. This leak works like a high-pass filter, so that at each moment in time, the leaky accumulator “forgets” a certain amount of the evidence that had been accumulated up to that time while adding the new incoming evidence to the DV. This converted the process into an Ornstein-Uhlenbeck process (Uhlenbeck and Ornstein, 1930; Smith and Ratcliff, 2004) in which earlier evidence is weighed less strongly than the most recent evidence.
Both the perfect and leaky integration versions of this model have been successful at accurately modelling behavioural data in a wide range of variants of the 2AFC task (Smith and Ratcliff, 2004; Ratcliff and McKoon, 2008). However, one of the criticisms with the original drift diffusion model with a single DV and two decision thresholds is that it does not fit very well with the physiological properties of neurons in the brain. While neurons can both increase and decrease their activity, they cannot have a negative firing rate and cannot realistically represent a decision variable that can arrive at two different decisions by crossing over either an upper or lower threshold (Ratcliff et al., 2007).
I.2.3. Dual Drift Diffusion Models
While the original drift diffusion model integrates the difference in evidence for both choices, dual drift diffusion models use two diffusion processes to accumulate evidence for each choice independently (LaBerge, 1962; Vickers, 1970; Bogacz et al., 2006; Ratcliff et al., 2007). The decision process ends once one of the integration processes reaches their respective thresholds. An illustration of this model is shown in Figure I.3b and I.4b. Like the LATER and LBA models, each drift diffusion module accumulates evidence only for its preferred choice, but the dynamics of the decision process is determined by the stochastic noise of the drift-diffusion process.
The idea of a race between two drift diffusion accumulators was more physiologically plausible than the single-accumulator drift diffusion model. The two accumulators could be represented in the brain as two populations of neurons with opposite choice preferences competing by increasing their activity towards a critical firing rate (Ditterich, 2006; Ratcliff et al., 2007). Furthermore, while the single-accumulator drift diffusion model was limited to two
choices by design, the dual drift diffusion model could be extended to incorporate multiple choices as additional separate accumulators.
However, there were still limitations to the dual drift diffusion model. Psychophysical evidence suggested that subjects’ choice behaviour was being driven by the difference in evidence for different response choices (Gold and Shadlen, 2001; Mazurek et al., 2003; Niwa and Ditterich, 2008). The accumulation of the difference in evidence is particularly
advantageous because it is approximately equivalent to the calculation of the log likelihood ratio for different alternative hypotheses, which is a robust criterion to make decisions based on noisy or uncertain evidence (Carpenter and Williams, 1995; Gold and Shadlen, 2001, 2007). Moreover, LIP neurons were shown to be positively affected by evidence in their preferred direction, and negatively affected by the opposite direction (Roitman and Shadlen, 2002; Mazurek et al., 2003; Bollimunta and Ditterich, 2012). This suggested that a difference comparison was being made, which was not being used in the dual drift diffusion models. This problem was addressed with dual diffusion models with mutual inhibition.
I.2.4. Dual Diffusion Models with Mutual Inhibition
These models resemble the dual drift diffusion model in which two diffusion processes race against each other, but the two processes each accumulate a decision variable that represents the net evidence for or against their preferred choice. The net evidence is obtained through a process of mutual inhibition between the two integrators. This process of mutual inhibition can be modeled in different ways (Ditterich, 2006). Usher and McClelland (2001) proposed a “leaky, competing accumulator model”, in which two sensory input units feed evidence supporting each of the alternate choices separately into two accumulating decision units. These two decision units will then mutually inhibit each other by lateral feedback of their
output signals onto the accumulator of the other decision unit. An illustration of this model is shown in Figure I.4c. Alternatively, Mazurek et al. (2003) proposed a feed-forward inhibition model. Instead of having the two accumulating decision units mutually inhibit each other, the two sensory input units coding for evidence for the two choices would each send two
projections, one excitatory to the decision unit whose preferred choice corresponds to their preferred sensory input, and one inhibitory to the other decision unit that prefers the alternative choice (Ditterich et al., 2003; Mazurek et al., 2003; Ditterich, 2006). In this manner, each decision unit will receive an excitatory input from the sensory input unit corresponding to its preferred choice, and an inhibitory input from the sensory input unit corresponding to the opposite choice. An illustration of this model is shown in Figure I.4d. The convergence of the two oppositely-signed sensory inputs onto each accumulator results in both accumulators receiving a combined input equal to the net difference in sensory evidence favouring the two choices.
Since dual diffusion models with mutual inhibition integrate the difference in evidence for the two choices, these models are largely indistinguishable from a single-accumulator drift diffusion model in their ability to predict and fit behavioural data (Smith and Ratcliff, 2004; Bogacz et al., 2006; Ditterich, 2006). However, as mentioned by Ratcliff et al. (2007), the race process incorporated in mutual inhibition models provide a more biologically plausible
framework that more accurately resembles decision related neural activity such as the ramping activity of LIP neurons reported by Roitman and Shadlen (2002).
In summary, many computational models have been proposed to model the process of decision-making in a 2AFC task. Most models satisfy the goals of accurately predicting the psychophysical data and the neural data (Smith and Ratcliff, 2004) and they all have the same
common assumptions: These models assume that evidence is accumulated towards a threshold, this accumulation process is noisy, and that a decision is made once enough evidence is accumulated for one choice over the other (Bogacz et al., 2006).
I.3 Objectives
I.3.1 Effect of directly competing motion
The first objective of my research project was to determine the effect of directly competing motion on the decision process in a 2AFC RDK task. While RDKs have been one of the most common stimuli used in perceptual decision-making studies, in most cases these stimuli only used coherent motion in one direction in a given trial. Meanwhile, 2AFC decision-making models assume that evidence is integrated for both possible choices. In these conventional RDK stimuli, the only evidence for the choice in the non-coherent direction would be stochastic noise due to the random dot motions that happen to be in the direction opposite to the coherent motion signal.
Furthermore, for decision-making models that assume that the decision variable accumulates the net difference in the activity of the neuron and anti-neuron input populations, the decision variable should be insensitive to factors that might affect both input populations equally (Gold and Shadlen, 2001). Extensive psychophysical and neurophysiological evidence is consistent with a decision variable that accumulates the net sensory evidence provided by the neuron/anti-neuron input populations (Britten et al., 1993; Roitman and Shadlen, 2002; Ratcliff et al., 2007; Bosking and Maunsell, 2011; Bollimunta and Ditterich, 2012; Bollimunta et al., 2012). However, this fundamental assumption of the drift-diffusion model cannot be fully validated by the standard RDK stimuli used in decision-making studies, because they
only use one direction of coherent motion against a background of random visual motion. As a result, the difference in evidence for the two alternative choices is essentially equivalent to the total coherent motion provided in only one direction in the standard RDK stimuli.
Furthermore, Liston and Stone (2013) recently critiqued the conventional RDK stimuli used in decision-making studies as not being a “true” 2AFC decision because these RDK do not show evidence for both of the alternative choices in each trial. This assertion was based on the original definition of the 2AFC task, in which the term “alternative” was meant to indicate the perceptual comparison of two alternative stimuli or signals, and not just the a priori
existence of two alternative choices (Green and Swets, 1966; Macmillan and Creelman, 1996). If only one signal is presented, the task can still be performed as a yes-no paradigm task. For example, an observer of a single coherent motion RDK could use a strategy in which they observe each stimulus and attempt to discern whether or not it contains evidence for only one of the two choices, such as rightward motion. If they perceive motion in that direction (“yes”), they choose the rightward target, but if they do not perceive rightward motion, they reject that choice (“no”) and choose the leftward target by default. This introduces the same potential choice biases due to a priori response criteria that were one of the limitations of “yes-no” paradigms. According to Liston and Stone (2013), a “true” 2AFC RDK motion discrimination task would require an RDK stimulus in which two signals of evidence compete against each other in the same trial.
Opposing motion has been used in RDK stimuli to study the psychophysics and neurophysiology of visual motion perception, especially the perception of so-called
“transparent motion”, that is, simultaneous motion in different directions in the same spatial location (Snowden et al., 1991; Snowden et al., 1992; Qian and Andersen, 1994, 1995).
However, directly opposing motion RDK stimuli have not yet been used to study its effect on the process of perceptual decisions about the direction of global motion (see next section).
This knowledge gap leads to the following questions: What happens to the behavioural psychophysics if we present stimuli with mutually-competing opposing motion? Is the process really dependent on the net difference in evidence, or could the mutually contradictory
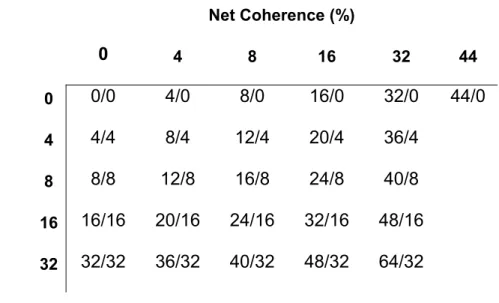
evidence actually interfere in the decision-making process? In order to explore these questions we generated modified RDK stimuli which contained two simultaneous opposing coherent motions. Different amounts of coherent motion in both directions were combined to produce RDK stimuli that had the same relative net coherent motion in one of the two directions, but different amounts of simultaneous coherent motions in both opposing directions. We
hypothesized that with competing motion, the decision process will still be mainly driven by the net amount of coherent evidence towards the correct choice.
I.3.2 Integration of the global motion signal
Standard RDK stimuli used in decision-making research provide coherent motion in only one of two opposite directions. In addition, all of the coherent dots move in parallel, by definition. As a result, the coherent motion signal is carried explicitly by the parallel motions of a subset of moving dots. What would happen if the coherent motion signal was instead implicitly embedded in the motions of dots moving in many different directions to create a net bias in the distribution of dot motions? Would observers be able to integrate the distributed motion signals in order to get a single global percept of net motion direction? This has been tested in a series on studies of the ability of human subjects to perceive the net global motion signal from a wide range of local motion signals (e.g. Williams and Sekuler, 1984;
2009; Schütz et al., 2010). These studies used RDK stimuli in which moving dots were displaced in a range of directions that was selected from a uniform or Gaussian distribution of directions centered on one true direction of global motion bias. Human observers were able to integrate the local motion signals spread in many directions to perceive the net direction of global motion.
However, again like conventional RDK stimuli with coherent motion in only one direction, the global motion stimuli did not contain an opposing component of coherent dots moving in the anti-direction. Indeed, if the width of the distribution of motion signals got too broad and started to include motions in nearly opposite directions, the ability of subjects to perceive a global motion direction decreased. At the limit, when the motions were selected uniformly from the full 360 degree continuum, subjects unsurprisingly failed to perceive any net global motion (Williams and Sekuler, 1984). Therefore the second objective of my work was to explore the effect of presenting different amounts of two opposing coherent motion signals whose presence was implicitly embedded across a broad range of dot motion directions in the RDK stimuli.
A more recent study by Niwa and Ditterich (2008) used varying amounts of coherent motion in three equidistant directional axes separated by 120 degrees. Observers’ reaction times and target choices were driven by the net direction of motion evidence pooled across the three streams of coherent motion presented in each trial. This indicated that the decision was based on the total distribution of responses across populations of input neurons with a broad range of motion direction preferences. Moreover, the choice behaviour of the subjects could be simulated successfully by a three-accumulator drift-diffusion model driven by the net output of three neuron/anti-neuron populations. In this model, each accumulator integrated the
difference between the motion signal generated by its own sensory input “neurons” that preferred the same direction of motion and the average signal of the two other sensory input sources preferring the other two directions of motion (Niwa and Ditterich, 2008). Neurons in the area LIP of monkeys performing the same task appeared to sum that net motion signal (Bollimunta and Ditterich, 2012; Bollimunta et al., 2012). However, as with other global motion studies using RDK stimuli, the stimuli in the Niwa and Ditterich (2008) study did not explicitly contain competing opposing motions in each of the three streams of coherent motion.
To explore how the psychophysics of the 2AFC task was affected by presenting competing coherent motion spread across many directions, we used two different algorithms to generate RDK stimuli. In one of the stimuli, called the “Narrow Coherence” (NC) stimuli, the coherent motion was confined to the left and right directions, so that the two competing coherent motions are explicitly displayed in the dot motions. In contrast, in the “Brownian Drift” (BD) stimulus, this coherent motion signal was distributed implicitly across many directions by adding a coherent-motion vector component to the otherwise random Brownian motion vector of the RDK dots. Our hypothesis was that if the decision process integrates motion signals from a wide range of directions, then observers’ psychophysical reaction times and success rates should be identical for both NC and BD stimuli in a 2AFC RDK coherent-motion discrimination task.
28 Title Page
Title: Choosing sides: they psychophysics of target choices using random dot kinematograms
with mutually contradictory evidence.
Abbreviated Title: Random dot motion with directly opposing evidence Author names and affiliations
Edmund Lam1,2, John F. Kalaska1,2
1Département de neurosciences, Université de Montréal, Québec, Canada
2Groupe de Recherche sur le Système Nerveux Central (GRSNC), Université de Montréal,
Québec, Canada
Conflict of Interest: The authors declare no competing financial interests.
Acknowledgements: This work was supported by the Canadian Institutes of Health Research
(CIHR) operating grant MOP-97944. E.L. was supported by the Natural Sciences and
Engineering Research Council (NSERC) Alexander Graham Bell Canada Graduate Scholarship and the Fonds de recherche du Québec – Santé (FRQS) Master’s Training Award. We thank C. Pack and E. Cook for their helpful comments on motion energy analysis.
29
Abstract
Random-dot kinematograms (RDKs) are often used in two-alternative forced-choice (2AFC) tasks to study how the brain decides among two perceptual or motor choices based on noisy evidence. Some current models assume that two pools of sensory neurons code the motion evidence in two opposite directions; the difference of these inputs is then accumulated in a decision variable. However, conventional RDKs contain only one direction of coherent motion against a background of random “noise” motion. Here, we explored the psychophysics of RDKs with mutually contradictory evidence. Different amounts of coherent motion were presented simultaneously in both directions to produce RDKs that had the same amount of net coherent motion, but different combinations of coherent motions in opposing directions. The two competing coherent-motion components were either confined to the two exactly opposite directions against a background of random motion (“narrow coherence” stimuli, NC), or spread across many directions of motion by adding a coherent-motion vector to the otherwise random motion of some of the dots (“Brownian drift” stimuli, BD). The choice behaviour of 12 human subjects was primarily driven by the net coherence of motion across a range of combinations of opposing coherent motions for both NC and BD stimuli. Nevertheless, reaction times (RTs) decreased for low net-coherence stimuli as the total amount of coherent motion and motion variability increased. This reduction in RTs can be reproduced with a simple two-accumulator drift-diffusion model with feed-forward inhibition by increasing the stochastic noise variability of the accumulation process.
30
Introduction
The brain continuously accumulates sensory information about the external world and uses it to make decisions about actions with its surrounding environment (Gold and Shadlen, 2007; Cisek and Kalaska, 2010). Random-dot kinematogram (RDK) visual-motion stimuli have been widely used in two-alternative forced-choice (2AFC) tasks to study how the brain decides among two competing sensory or motor choices (Newsome et al., 1989; Kim and Shadlen, 1999; Roitman and Shadlen, 2002; Ratcliff et al., 2003a; Palmer et al., 2005; Ratcliff et al., 2007; Niwa and Ditterich, 2008; Resulaj et al., 2009; Kiani et al., 2013).
One computational framework for modeling decision making proposes a decision variable which accumulates noisy evidence across time and can be simulated mathematically by a bounded drift-diffusion process (Ratcliff, 1978; Gold and Shadlen, 2001; Mazurek et al., 2003; Smith and Ratcliff, 2004; Bogacz et al., 2006; Gold and Shadlen, 2007; Eckhoff et al., 2008; Ditterich, 2010). In 2AFC tasks, the models assume that a pair of neuron and “anti-neuron” populations with opposite motion direction preferences separately encode the sensory evidence supporting each choice (Gold and Shadlen, 2001; Mazurek et al., 2003; Gold and Shadlen, 2007). The decision variable then integrates the moment-to-moment difference in activity between these two sensory inputs.
While extensive psychophysical and neurophysiological evidence is consistent with a decision variable that accumulates the difference in sensory evidence provided by the
neuron/anti-neuron inputs (Roitman and Shadlen, 2002; Ratcliff et al., 2007; Bosking and
Maunsell, 2011; Bollimunta and Ditterich, 2012), conventional RDKs contain only one direction of coherent motion against a background of random motion. As a result, the coherent motion
31
signal is encoded primarily by the neural input population that prefers that motion direction, while any motion signals near the preferred direction of the “anti-neuron” population would result from the stochastic directional variability in the random motion background (Britten et al., 1993; Bosking and Maunsell, 2011). The net motion evidence is essentially equivalent to that of the sensory signal encoded by the one input population that is activated by the coherent motion component of the RDK stimulus, and so does not provide a strong test of the assumption of an accumulation of the net difference in motion evidence (Liston and Stone, 2013).
In this study, we explored the psychophysics of RDK stimuli with mutually contradictory evidence. Different amounts of coherent-motion signals in both directions were presented
simultaneously to produce RDKs that had the same amount of net coherent-motion signal in one direction, but different levels of balanced mutually-contradictory “base” coherent motions in both opposing directions. The two competing motion components were either confined to the two exactly opposite directions against a background of residual random motion (“narrow coherence” stimuli , NC), or spread across all possible directions of motion by adding a coherent motion component bias to the otherwise random Brownian motion of the RDK dots (“Brownian drift” stimuli, BD).
Our results show that the choice behaviour of 12 human subjects was primarily driven by the net coherence of motion across a broad range of different levels of opposing coherent
motions. Behaviour was very similar for both NC and BD stimuli, which suggests that the decision-making process extracts motion evidence across a wide range of motion directions, whether the motion signal is confined to two opposite directions or broadly distributed across a wide range of dot motion directions (Jazayeri and Movshon, 2006; Bosking and Maunsell, 2011). Furthermore, the total amount of signal motion had a secondary impact on choice behaviour; at
32
low net-coherence levels, reaction times (RTs) decreased as total motion signal and associated motion variability increased. The choice behaviour of the subjects across different levels of net and total signal strength could be replicated by a simple two-accumulator drift-diffusion process with mutual feed-forward inhibition between the output of the neuron and anti-neuron channels at the input stage of the accumulators, by increasing the level of instantaneous stochastic noise as a function of base coherence level.
Methods
Human Subjects8 male and 4 female subjects with ages ranging from 20-36 years old were recruited for the present study. Subjects had normal or corrected to normal vision and were naïve to the
experimental objectives. All experiments conformed to the rules and guidelines established by the Comité d’éthique de la recherche en santé de l’Université de Montréal. Subjects read and signed an informed consent form before participating in the study.
Experimental Setup
Experiments were conducted in a darkened room with a 19 inch flat-screen TFT LCD monitor (Samsung SyncMaster 191T Plus, 60 Hz). Subjects sat at a viewing distance 60 cm from the monitor and subjects recorded their response choices by moving a computer mouse. The experimental stimuli were generated on a PC computer running Windows 7, and Matlab (R2008b; The Mathworks, Natick MA) with the Psychophysics Toolbox Extension (Brainard, 1997; Pelli, 1997). Data were collected and stored with custom-written Matlab routines.
33
Experimental Task
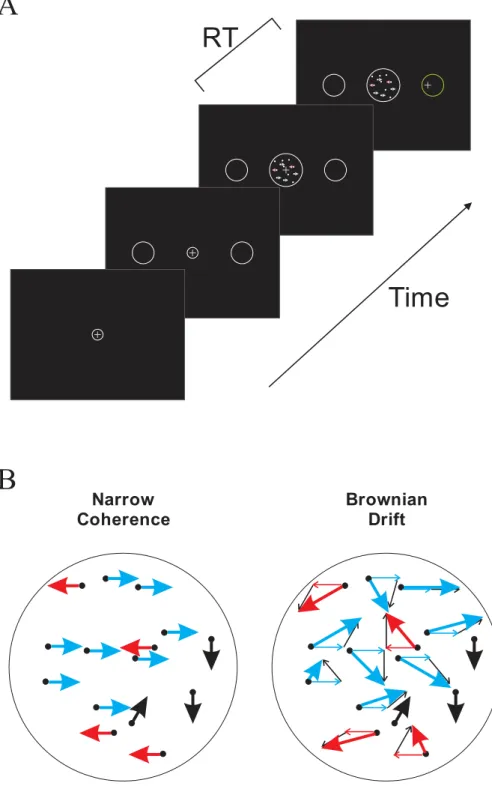
Subjects completed a series of trials in which they had to determine the direction of overall motion in a random-dot kinematogram (RDK) stimulus that usually contained two variable-strength opposing motion “signals” to the right or left (“signal-R” and “signal-L”, respectively) against a variable-strength background of random-motion “noise”, (Figure 1A). Each trial had four epochs. The first epoch was the center-fixation epoch, which began when a small central white circle (diam: 0.5 deg visual angle) appeared. The subject had to move the mouse to position an on-screen cursor in the central circle and hold it there for 700ms. Two large white circular peripheral targets then appeared to the left and right of the central cue (diameter: 4 deg, distance from center: 12.5 degrees) for 700ms (target-display epoch). Next, the RDK epoch began when the central circle disappeared and a dynamic RDK motion stimulus appeared in the center of the screen, subtending 5 degrees of visual angle. Subjects were told to look at the stimulus and to determine the direction of the motion stimulus. The subjects’ head was not fixed and no explicit eye fixation controls were used. Once the subjects made a decision about the net direction of visual motion, they reported the decision by moving the mouse to displace the on-screen cursor from the center circle to the peripheral target located in the same direction as their estimate of the signal motion. Once the cursor exited the center circle, the RDK stimulus froze on the last presented frame and the RDK epoch ended. The choice Reaction Time (RT) was measured as the duration of the RDK epoch from the onset of the RDK stimulus to the exit of the cursor from the small central window. The fourth epoch was the movement-time (MVT) epoch from the exit of the central start circle to the entrance into the chosen target circle. At the end of the trial, the subjects where shown the correct target by changing the correct target’s color from
34
white to green. Simultaneously, the subjects received an auditory cue that confirmed whether they had made the correct choice (one short beep, 400Hz) or an incorrect choice (two short beeps, 240Hz and 200Hz).
Subjects were given the general instruction to “move as quickly and as accurately as possible to the target in the direction of perceived motion”, but were not given any explicit instructions to bias their behaviour to either speed or accuracy of choices. Furthermore, no hard constraint was made on the duration of the subjects’ reaction times (RT), beyond a trial time-out if the subjects did not respond in less than 10 seconds. As a result, each subject established their own preferred speed/accuracy trade-off criterion.
Visual Stimuli – Random dot kinematogram (RDK) algorithms
The RDK-generating algorithms used in this experiment created three interleaved sequences of image frames that presented sets of dots that carried the coherent-motion signal as well as random-noise dots. Similar to some previous RDK algorithms (Shadlen and Newsome, 2001; Roitman and Shadlen, 2002; Niwa and Ditterich, 2008; Pilly and Seitz, 2009; Bollimunta and Ditterich, 2012), three sets of dot sequences were interleaved so that the dots from one sequence were presented every three frames. As such, the first group of dots were plotted on frames [1, 4, 7 …], while the second group of dots were plotted on frames [2, 4, 8 …], and the third group of dots were plotted on frames [3, 4, 9 …] and so on. With a frame rate of 60 Hz, successive frames from one random-dot sequence were plotted every 50 ms. However, unlike those previous RDK algorithms in which coherent motion occurred in only one direction against a background of random motion, most of the stimuli in the present study were designed to present motion signals
35
of different strengths in two opposite directions simultaneously, against a background of random dot motions. The procedure was as follows.
The algorithm first initialized the dot pattern for each of the 3 dot sequences by randomly distributing the dots in a 5x5 degree square area. The dots were subsequently masked by a circular aperture of 5 degrees in diameter. Each dot filled a square with an edge size of two pixels (0.055 degrees). The dot density was 33.4 dots/(deg2 · s). This comprised 3 groups of 14 dots moving in the three separate interleaved frames, for a total of 42 dots in the full RDK sequence. However, because of the circular mask, somewhat fewer than 42 dots were usually visible at any one time. To plot the movement of the dots in the next frame in their sequence, each dot was assigned a Brownian motion vector with a constant length but a random direction. The dots were then divided into three subgroups. The first subgroup of dots conveyed the rightward motion signal (signal-R), while the second subgroup of dots conveyed the leftward motion signal (signal-L). The remaining dots formed the third subgroup, which provided the random-noise component of the visual stimulus. The different stimulus conditions were created by modifying the relative number of dots assigned to these three subgroups.
We used two different methods to displace the signal dot subgroups in the stimuli, illustrated in Figure 1B. In the “Narrow-Coherence” (NC) stimulus set, a vector component in the assigned signal direction replaced the assigned Brownian motion vectors of the signal dots for that frame, similar to most standard RDK stimuli. The resulting apparent coherent motions of the two signal dot subgroups in the NC stimuli were narrowly confined to leftward and rightward displacements parallel to the horizontal axis, and were therefore explicitly visible in their frame-wise displacements.
36
In contrast, in the “Brownian-Drift” (BD) stimulus set, the coherent signal vector component of the signal dots was added to their assigned Brownian motion vector. As a result, the coherent motion component of the signal dot displacements in the BD stimuli was not
confined to the horizontal axis, but was instead embedded implicitly in signal dot motions across a broad range of directions, similar to the RDK stimuli often used in global-motion studies (Williams and Sekuler, 1984; Watamaniuk et al., 1989; Watamaniuk and Sekuler, 1992). Furthermore, while the signal dots had a fixed speed (2°/s) in the NC stimuli, the signal dot speeds ranged from 0°/s - 4°/s in the BD stimuli (see below).
Between successive frames of the three sets of random-dot sequences, each dot was randomly chosen to be in one of the 3 dot subgroups. As a result, the displacement of any given dot between two successive image frame pairs could be a signal-R or signal-L vector or a random-noise vector, so that the nature of the motion signal provided by each dot had a short lifetime.
Importantly, however, the dots themselves had extended lifetimes. Unlike many RDK stimuli (Shadlen et al., 1996; Kim and Shadlen, 1999; Shadlen and Newsome, 2001; Pilly and Seitz, 2009; Schütz et al., 2010; Kiani et al., 2013), the dots were not randomly repositioned to
new positions in the stimulus array between pairs of frames in a sequence. Instead, the positions of the dots in each of the three interlaced sequences of frames were incremented progressively in each frame according to their random assignment into each of the three dot subgroups. As a result, the dots in the NC and BD stimuli had a long lifetime and created the illusion of sets of dots in continuous noisy motion, with different relative strengths of motion in the two opposing signal directions rather than an evanescent “snow” of transient flickering dots that moved in different directions. The random-replacement procedure has some advantages for studying pure
37
visual movement direction perception mechanisms (Huk and Meister, 2012). However, most ecologically-natural moving stimuli that the visual system evolved to process are usually generated by the continuous sequential changes in the spatial location of physical objects that exist over periods of time much longer than the 50ms repeat rate of the frames in the RDK dot sequences. Pilot studies using NC, BD and standard RDK stimuli generated with random replacement of dots between successive pairs of frames (not presented here) confirmed that the psychophysical performance of subjects using the NC and BD stimuli were consistent with all the major trends reported many times in subjects responding to RDK stimuli with random replacement (Britten et al., 1992, 1993; Shadlen and Newsome, 2001; Roitman and Shadlen, 2002; Palmer et al., 2005; Niwa and Ditterich, 2008; Pilly and Seitz, 2009; Bollimunta and Ditterich, 2012). Moreover, other comparative studies have reported similar results, supporting the idea that the visual system obtains a global percept of motion direction primarily by
processing the directional displacements of the dots between successive corresponding frames, and does not rely solely on the additional motion information that might be available in the temporally evolving spatial paths of individual dots in stimuli with prolonged dot lifetimes (Williams and Sekuler, 1984; Snowden and Braddick, 1989; Watamaniuk et al., 1989; Tripathy and Barrett, 2004; Pilly and Seitz, 2009). This supported the basic generality and robustness of the findings in this study, and indicated that they could not be an idiosyncratic product of the way in which the motion illusions were generated.