Circula(ng microRNAs as diagnos(c marker in breast cancer
pa(ents and their deregula(on under neoadjuvant
chemotherapy
Breast cancer is the leading cause of death by cancer among women and there is an urgent need to improve its diagnosis and prognosis. MicroRNAs (miRNAs) are non-coding RNAs that regulate gene expression and many have been implicated in breast cancer. In this article, we focus on circulating miRNAs as biomarkers for breast
cancers and we describe the deregulation of their expression during neoadjuvant chemotherapy (NAC).
Conclusions
1)
Accurate biomarkers for minimally invasive diagnosis of primary and metastatic
breast cancer was identified ;
2)
NAC induces expression of miR-34a in plasma and tumor tissue, which could be
involved in anti-tumor effect and cardiotoxicity of chemotherapy agents.
1. Circula(ng miRNAs signature as diagnos(c marker in breast cancer pa(ents
The expression of 188 plasma miRNAs was determined in 101 patients with primary or metastatic breast cancer and 20 healthy women. We found 116 miRNAs modified in both primary and metastatic breast cancer patients compared to controls.
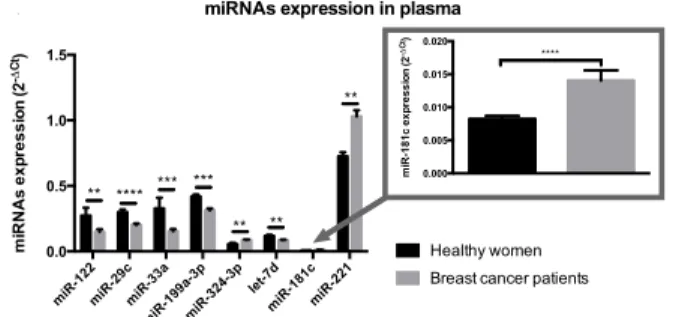
A diagnostic model, based on 8 miRNAs (Fig. 1) measured in 71 breast cancer patients and 14 healthy women, was designed. The validity of this classification model has then been confirmed on an independent cohort of 30 patients and 6 controls
Receiver operating characteristic (ROC) curve derived from the 8-miRNAs based diagnostic tool exhibited an area under the curves (AUC) of 0,95 in the validating cohort
Circulating miRNAs expression was assessed in plasma and tumor of 25 patients before and after the NAC. 25 plasma miRNAs are significantly modified after NAC (Fig. 2). Tumor suppressor miR-34a is highly upregulated in plasma at the end of NAC (Fig. 3A). This miRNA displays also an increased expression in the tumor tissue after NAC in 7 patients with pathological partial response to NAC (Fig. 3B). This work demonstrates for the first time that NAC induces expression of miR-34a in plasma and tumor tissue that might be involved in the anti-tumor effect of the chemotherapy. Studying the kinetic of miR-34a expression during NAC revealed that its level is especially increased after anthracycline-based chemotherapy (Fig. 3C). Moreover, miR-34a upregulation after anthracycline is correlated with troponin upregulation in NAC treated patients, suggesting a role of this miRNA in anthracycline-mediated cardiotoxicity (Fig. 3D).
2. Effect of neoadjuvant chemotherapy (NAC) on miRNAs
Pierre Frères, Claire Josse, Stéphane Wenric, Nicolas Bovy, Meriem Boukerroucha, Ingrid Struman, Vincent Bours, Guy Jerusalem
GIGA-‐Research, Human Gene6cs, Université de Liège
Contact : pierre.freres@gmail.com
20 25 30 35 40 -1 0 1 2 Ct Ct (NA1 - D-8 ) miR-34a miR-451 miR-122 Upregulated miRNAs
miRNAs P-value FDR Fold-change
miR-106a <0.05 0.08 1.4 miR-122 <0.01 <0.01 1.9 miR-126 <0.01 <0.05 1.3 miR-139-5p <0.001 <0.05 1.5 miR-15b <0.01 <0.05 1.3 miR-197 <0.05 0.1 1.2 miR-199a-3p <0.01 0.1 1.4 miR-223 <0.01 0.09 1.2 miR-328 <0.05 <0.05 1.3 miR-34a <0.0001 <0.001 2.5 miR-374b <0.01 0.07 1.3 miR-423-3p <0.05 <0.05 1.2 miR-425 <0.01 <0.01 1.8 miR-503 <0.01 0.06 1.6 ! Downregulated miRNAs
miRNAs P-value FDR Fold-change
miR-127-3p <0.01 0.08 0.7 miR-150 <0.05 0.06 0.5 miR-29c <0.05 0.1 0.8 miR-324-3p <0.05 0.06 0.6 miR-329 <0.05 0.06 0.6 miR-376a <0.05 0.2 0.7 miR-376c <0.01 0.2 0.7 miR-382 <0.01 0.3 0.7 miR-409-3p <0.01 0.2 0.7 miR-411 <0.05 0.1 0.8 miR-451 <0.01 <0.05 0.5 !
NA1$
D&8$
A
B
C
NA1 NA2 D-8 3M 0 10 20 30 40 50 NAC mi R-34a exp ressi on (f ol d-ch an ge) *** **** ***miR-34a expression in plasma
NA1 D-8 0 20 40 60 80 100 NAC mi R-34a exp ressi on (2 -Δ Ct)
miR-34a expression in tumor tissues
* A B C NA1 D-8 0 20 40 60 80
miR-34a expression in plasma
NAC mi R-34a exp ressi on (2 -Δ Ct) **** D 0.1 1 10 100 1000 0 1 2 3
miR-34a expression (log10*2-ΔCt)
Tr
oponin T
Correlation between upregulation of plasma miR-34a and troponins T
miR-122miR-29cmiR-33a miR-199a-3pmiR-324-3p let-7d miR-181cmiR-221 0.0 0.5 1.0 1.5 mi RNAs exp ressi o n (2 -Δ Ct) Healthy women Breast cancer patients ** **** *** *** ** ** ** 0.000 0.005 0.010 0.015 0.020 mi R-181c exp ressi o n (2 -Δ Ct) ****
miRNAs expression in plasma A B AUC = 0.95 sensibility = 0.9 specificity = 0.83 threshold = 0.3
Figure 1 : 8 circulating miRNAs significantly dysregulated in breast cancer patients
Figure 2 : Circulating miRNAs significantly dysregulated after NAC
Figure 3 : miR-34a upregulation under NAC
NA1 NA2 D-8 3M 0 10 20 30 40 50 NAC mi R-34a exp ressi o n (f o ld -ch an g e) *** **** ***
miR-34a expression in plasma
NA1 D-8 0 20 40 60 80 100 NAC mi R-34a exp ressi o n (2 -Δ Ct)
miR-34a expression in tumor tissues
* A B C NA1 D-8 0 20 40 60 80
miR-34a expression in plasma
NAC mi R-34a exp ressi o n (2 -Δ Ct) **** D 0.1 1 10 100 1000 0 1 2 3
miR-34a expression (log10*2-ΔCt)
Tr
oponin T
Correlation between upregulation of plasma miR-34a and troponins T