RESEARCH
Safety, efficacy and clinical
generalization of the STAR protocol:
a retrospective analysis
Kent W. Stewart
1*, Christopher G. Pretty
1, Hamish Tomlinson
1, Felicity L. Thomas
1, József Homlok
3,
Szabó Némedi Noémi
4, Attila Illyés
4, Geoffrey M. Shaw
2, Balázs Benyó
3and J. Geoffrey Chase
1Abstract
Background: The changes in metabolic pathways and metabolites due to critical illness result in a highly complex
and dynamic metabolic state, making safe, effective management of hyperglycemia and hypoglycemia difficult. In addition, clinical practices can vary significantly, thus making GC protocols difficult to generalize across units.The aim of this study was to provide a retrospective analysis of the safety, performance and workload of the stochastic targeted (STAR) glycemic control (GC) protocol to demonstrate that patient-specific, safe, effective GC is possible with the STAR protocol and that it is also generalizable across/over different units and clinical practices.
Methods: Retrospective analysis of STAR GC in the Christchurch Hospital Intensive Care Unit (ICU), New Zealand
(267 patients), and the Gyula Hospital, Hungary (47 patients), is analyzed (2011–2015). STAR Christchurch (BG target 4.4–8.0 mmol/L) is also compared to the Specialized Relative Insulin and Nutrition Tables (SPRINT) protocol (BG target 4.4–6.1 mmol/L) implemented in the Christchurch Hospital ICU, New Zealand (292 patients, 2005–2007). Cohort mortality, effectiveness and safety of glycemic control and nutrition delivered are compared using nonparametric statistics.
Results: Both STAR implementations and SPRINT resulted in over 86 % of time per episode in the blood glucose (BG)
band of 4.4–8.0 mmol/L. Patients treated using STAR in Christchurch ICU spent 36.7 % less time on protocol and were fed significantly more than those treated with SPRINT (73 vs. 86 % of caloric target). The results from STAR in both Christchurch and Gyula were very similar, with the BG distributions being almost identical. STAR provided safe GC with very few patients experiencing severe hypoglycemia (BG < 2.2 mmol/L, <5 patients, 1.5 %).
Conclusions: STAR outperformed its predecessor, SPRINT, by providing higher nutrition and equally safe, effective
control for all the days of patient stay, while lowering the number of measurements and interventions required. The STAR protocol has the ability to deliver high performance and high safety across patient types, time, clinical practice culture (Christchurch and Gyula) and clinical resources.
Keywords: Glycemic control, Intensive care unit, Hyperglycemia, Hypoglycemia, Model-based, Personalized,
Patient-specific, Stochastic, Targeted
© 2016 Stewart et al. This article is distributed under the terms of the Creative Commons Attribution 4.0 International License (http://creativecommons.org/licenses/by/4.0/), which permits unrestricted use, distribution, and reproduction in any medium, provided you give appropriate credit to the original author(s) and the source, provide a link to the Creative Commons license, and indicate if changes were made.
Open Access
*Correspondence: kent.stewart@pg.canterbury.ac.nz
1 Department of Mechanical Engineering, Centre for Bio-Engineering, University of Canterbury, Private Bag 4800, Christchurch 8140, New Zealand
Background
Stress-induced insulin resistance, resulting in hypergly-cemia, is often experienced by intensive care unit (ICU) patients [1–3] and is associated with increased morbid-ity and mortalmorbid-ity [1, 2, 4]. Glycemic variability in these highly dynamic patients has also been independently related to increased mortality [5, 6]. Studies have shown that safe, effective glycemic control (GC) that modulates exogenous insulin and/or nutrition significantly reduces the number of negative effects of dysglycemia [7–9], including reductions in the rate and severity of organ fail-ure [10] and cost of care [11, 12].
The stress response a critically ill patient experiences is highly complex, variable and dynamic [13], making safe, effective control of blood glucose (BG) difficult. This is one reason a number of studies may have failed to achieve consistent, safe and effective GC [14–20]. These negative and inconclusive outcomes could be largely due to the studies having a significant increase in the risk of hypoglycemia (17–29 % <2.2 mmol/L), which is associ-ated with increased mortality [21–23], and can be asso-ciated with large changes in patient response to insulin over short periods [13, 24, 25], particularly in the first 48 h [26], where many hypoglycemic events occur and there is a strong association with mortality [22].
It is thus possible that previous studies failed to achieve safe consistent GC due to the GC protocols not being able to observe or identify individual patient-specific dynamics, but providing GC based on an absolute BG value. A more patient-specific approach to GC is needed to successfully manage such significant inter- and intra-patient variability [24, 27]. The ability to provide safe, effective control across patients and clinical practice is a necessary requirement before being able to assess the impact of GC on clinical outcomes.
The tablet-computer-based stochastic targeted (STAR) GC protocol provides patient-specific GC [28, 29]. STAR uses a clinically validated pharmacokinetic and phar-macodynamic model of the insulin–glucose system [30,
31] and a cohort-based model of insulin sensitivity vari-ability [32, 33] to compute optimal patient-specific insu-lin and nutrition interventions that maximize control and nutrition, while maintaining a maximum 5 % risk of BG < 4.4 mmol/L [28, 29]. STAR also allows variable 1- to 3-hourly BG measurement frequency to help manage nursing workload. STAR has been the standard of care in Christchurch Hospital ICU, Christchurch, New Zealand, and in the Kálmán Pándy Hospital ICU, Gyula, Hungary, since 2011. The predecessor of STAR in Christchurch was the Specialized Relative Insulin and Nutrition Tables (SPRINT) [8, 10].
The aim of this dual-center retrospective analysis is to demonstrate that patient-specific, safe, effective GC is
possible with the STAR protocol and that it is also gener-alizable across/over different units and clinical practices. Methods
Comparisons
This dual-center retrospective analysis makes two com-parisons to assess.
1. Performance and safety: STAR is compared to SPRINT in Christchurch to provide a comparison between patient protocols in the same unit, and dem-onstrate equivalent or better performance and safety of STAR to a successful protocol [8].
2. Generalizability: STAR Christchurch is compared to STAR Gyula to test generalizability of safety and per-formance over significantly different clinical practice cultures and approaches.
The metrics compared are:
• Performance: Percentage of time in BG band (4.4– 8.0 mmol/L) [34].
• Safety: Number of severe hypoglycemic cases (BG < 2.2 mmol/L) [21].
• Safety: Number of moderate hypoglycemic cases (BG < 4.0 mmol/L) [22].
Patients and protocols
Cohorts
This study compares clinical data from three cohorts: 1. Patients treated using STAR in Christchurch
Hospi-tal ICU, Christchurch, New Zealand, from June 2011 to May 2015.
2. Patients treated using STAR in Kálmán Pándy Hos-pital ICU, Gyula, Hungary, from December 2011 to May 2015.
3. Patients treated using SPRINT in Christchurch Hospi-tal ICU, Christchurch, NZ, from July 2005 to May 2007. The following patients in these three cohorts were excluded: those who spent less than 10 h on protocol and were fed on average greater than 120 % of their SCCM/ ACCP caloric target [35]. Patients who spent less than 10 h on protocol were excluded as they were considered to not have a significant amount of time on protocol to fairly assess the performance or be clinically affected by good GC. Patients who were fed greater than 120 % of their calorific target were excluded as this is well outside the recommendations of STAR and SPRINT, as well as well-accepted clinical guidelines. The number of patient episodes excluded due to each of these filtering criteria is given in Table 1.
Patients on the STAR protocol who did not target the 4.4–8.0 mmol/L BG band were also excluded. Thus, all STAR patients compared used the STAR framework in the same manner with respect to BG and nutrition tar-gets. It should be noted that all SPRINT patients targeted the 4.0–6.1 mmol/L BG band as the SPRINT protocol was not flexible to different targets.
Demographic data for these cohorts are presented in Tables 2 and 3, aligned with the two main comparisons. Some data are unavailable for the STAR Gyula cohort in Table 3 due to differences in the typical data collected. The missing data do not impact the assessment of gener-alizability of the safety and performance of STAR.
Ethics, consent and permissions
The Upper South Regional Ethics Committee, New Zea-land, granted approval for the retrospective audit, anal-ysis and publication of the Christchurch patient data. According to the local ethical codes in Hungary, the study of the Gyula cohort was considered a clinical data audit and only required depersonalization of data with-out the need for individual patient consent to analyze or publish the anonymized data.
Clinical practice and implementation: Christchurch Hospital ICU, New Zealand
STAR has been the standard of care in the Christchurch Hospital ICU since June 2011. This facility is a mixed medical, tertiary affiliated ICU. Starting criteria for STAR in Christchurch is two successive BG measurements over 8 mmol/L within a 4-h period. IV insulin is delivered in hourly bolus form, with added background infusions of up to 3U/h when insulin requirements are high and sus-tained [28, 29]. Blood for BG measurement was typically taken directly from an arterial line and measured using an Arkray Super-Glucocard™ II glucometer (Arkray, Minnesota, USA) (2011–2012) or a Roche Accu-Chek Inform II (F. Hoffmann-La Roche Ltd, Basel, Switzerland) (2012–2015).
SPRINT, the predecessor to STAR, used the same entry criteria as STAR and used the same insulin delivery pro-cedures [8, 10]. Blood for BG measurement was also typically taken directly from an arterial line and meas-ured using an Arkray Super-Glucocard™ II glucometer (Arkray, Minnesota, USA). Both SPRINT and STAR rely on closely related models of the glucose–insulin system [30, 36]. SPRINT was a paper-based protocol that was developed using the model to optimize recommended insulin and nutrition delivery based on measured BG and previous interventions [8]. However, in use, SPRINT could not explicitly calculate insulin sensitivity, or for-ward-predict the outcomes of interventions. In contrast,
Table 1 Episode filtering statistics
Number of episodes (%) SPRINT Christchurch STAR Christchurch STAR Gyula
Initial number 487 625 68
Different GC target to protocol 0 (0.0 %) 225 (36.0 %) 11 (16.2 %)
Episode length <10 h 58 (11.9 %) 49 (7.8 %) 6 (8.8 %)
Fed over 120 % target 74 (15.2 %) 15 (2.4 %) 4 (5.9 %)
Remaining for analysis 355 (72.9 %) 336 (53.8 %) 47 (69.1 %)
Table 2 Patient demographics for the STAR and SPRINT Christchurch cohorts
Data are presented as median [inter-quartile range (IQR)] where appropriate
Cohort
character-istics SPRINT Christchurch STAR Christchurch P value
Total patients 292 267
Age 63 [48:73] 65 [55:72] 0.28
Percent male 62.7 65.5 0.48
Length of ICU stay 6.2 [2.7:13.0] 5.7 [2.5:13.4] 0.70
% Operative 38.7 34.8 0.38 APACHE II score 19.0 [15.0:24.5] 21.0 [16.0:25] <0.05 APACHE II RoD (%) 29.0 [16.0:51.0] 33.0 [15.0:53.0] 0.41 ICU mortality (%) 18.2 24.3 0.08 Hospital mortality (%) 26.0 30.0 0.35 Hospital SMR 0.76 0.86 – Mortality on GC protocol (%) 5.5 6.4 0.72
Table 3 Patient demographics for the STAR Christchurch and Gyula cohorts
Data are presented as median [inter-quartile range (IQR)] where appropriate
Cohort characteristics STAR Gyula STAR Christchurch P value
Total patients 47 267
Age 66 [58:71] 65 [55:72] 0.72
Percent male 61.7 65.5 0.62
Length of ICU stay 14 [8.0:20.5] 5.7 [2.5:13.4] <0.05 APACHE II score 32.0 [28.0:36.0] 21.0 [16.0:25] <0.05
ICU Mortality (%) 38.3 24.3 0.05
Mortality on GC protocol
STAR implements the glucose–insulin model on tab-let computer and therefore identifies insulin sensitivity, allowing forward prediction of interventions to optimize treatments, directly manage the risk of hypoglycemia and personalize care [28].
For both protocols in Christchurch Hospital ICU, patients received a similar feed type. SPRINT patients are typically fed enterally with either Glucerna™ 1 Cal. (34.3 % carbohydrate, 16.7 % protein, 14.4 g/L fiber, Abbott Labs, Illinois, USA) or Diabetic Resource (36 % carbohydrate, 24 % protein, 12 g/L fiber, Nestle Health Science, Epalinges, Switzerland). Similarly, STAR patients are typically fed Glucerna™ Select (31 % carbohydrate, 20 % protein, 21.1 g/L fiber, Abbott Labs, Illinois, USA). Note all carbohydrate concentrations exclude indigest-ible fiber. All the formulas used are within 1–4 % of total carbohydrate and protein content and thus provide very similar nutrition content for the patients over all of the years. For both protocols, parenteral nutrition is used occasionally to supplement enteral nutrition when necessary.
For both protocols, the same ACCP guidelines are used to determine the patients daily calorific goal intake of 25 kcal/kg/day [35] and enteral nutrition is advised between 30 and 100 % of this calorific goal [8, 28], although fixed nutrition rates and rates up to 120 % of calorific goal were included in this study. The main dif-ference between the SPRINT and STAR feeding regime was SPRINT modulated feeding in steps up to ±10 % and effectively targeted 60–70 % of calorific goal [8], whereas STAR modulated feeding in steps up to ±30 % and tar-geted 100 % of calorific goal [28].
Clinical practice and implementation: Gyula Hospital ICU, Hungary
Kálmán Pándy County Hospital (Gyula, Hungary), which is also a mixed ICU, has been using STAR in the medical ICU since December 2011. This ICU is markedly differ-ent from Christchurch in terms of clinical GC practices. IV insulin is delivered via continuous infusion, and local nutrition guidelines specify aggressive early parenteral nutrition to supplement enteral nutrition to a similar goal feed rate of 25 kcal/kg/day. Patients are transitioned from parenteral to enteral nutrition as their stay progresses, and STAR modulates both rates to obtain total delivery values between 30 and 100 % of the daily goal.
Starting criteria for STAR in Gyula are also two suc-cessive BG measurements over 8 mmol/L within a 4-h period, but are subject to the clinician’s choice, depend-ing on expected length of stay and severity of illness of the patient. This difference in patient selection is given in Table 3, with the Gyula cohort having much higher Apache II scores and ICU length of stay. BG is measured
using the E77 Elektronika Dcont Optimum or Dcont Personal Glucometers (E77, Budapest, Hungary) with blood taken directly from an arterial line. It should be noted that only one STAR tablet is available for use in the Kálmán Pándy County Hospital, thus limiting the patient numbers and increasing the severity of illness of these patients, as it was typically used for the most ill patients.
Patients and episodes of GC
As a single patient may be treated by a protocol on sev-eral distinct occasions separated by significant breaks, a distinction is made between a patient and an episode of GC. A patient is considered to be a person with the same ICU admission number, and an episode is considered to be a period of contiguous treatment by GC. Therefore, there can be multiple episodes per patient.
An episode was defined as a period of GC (10 h or more) in which there are no breaks in BG measurements longer than 5 h. If a gap in data exceeded 5 h, it was con-sidered that GC had been stopped and restarted. Con-sidering the maximum measurement interval is 3 h, this choice accounts for reasonable variance in measurement intervals.
Analysis and statistics
The mortality on GC was calculated by working out the number of patients that died while on the GC protocol or within 5 h of the GC protocol ending. This statis-tic is used to identify patients for whom GC might have impacted their ICU mortality.
Blood glucose performance statistics are presented in median and inter-quartile range of individual patients mean and standard deviations of blood glucose as per Finfer et al. [36]. All hypoglycemia and other rare occur-rences were manually verified. Due to irregular sampling intervals, patient episode BG data were also analyzed after linear interpolation at 60-min intervals. The BG val-ues at 60-min intervals (either clinical or interpolated) are presented in median and inter-quartile range of indi-vidual episodes mean and standard deviations of BG, as above.
The mean hourly nutrition rates of glucose reported in Table 5 are nutrition rates excluding the hours patients were not fed, as occasionally patients could not be fed due to clinical reasons irrespective of the GC proto-col. The standardized mortality ratio (SMR) calculated in Table 2 was calculated using the APACHE II Risk of Death.
Nonparametric statistics are used exclusively for all the comparative tests due to the typically skewed dis-tributions of BG, insulin dose and other data. P values were computed using the Mann–Whitney rank-sum test for all continuous data and the Chi-squared test for
categorical data. P values <0.05 are considered statisti-cally significant.
Results
STAR versus SPRINT Christchurch
The cohort demographics in Table 2 show the SPRINT and STAR Christchurch cohorts have no significant dif-ference in gender, age, operative status or ICU length of stay. However, the STAR cohort had higher APACHE II scores and ICU mortality rates than the SPRINT cohort.
Table 5 presents the per-patient and per-episode GC safety and performance of STAR and SPRINT in Christchurch. These results show that both STAR and SPRINT protocols resulted in over 86 % time in the BG band of 4.4–8.0 mmol/L per episode (86.6 and 93.0 %, respectively), while maintaining safe control of severe hypoglycemia (BG < 2.2 mmol/L, 1.5 vs. 0.3 % of patients, respectively). SPRINT’s lower and tighter BG target range (4.4–6.1 mmol/L), resulted in an increased inci-dence of moderate hypoglycemia (BG < 4.0 mmol/L, 62.0 vs. 26.3 % of patients for SPRINT and STAR, respec-tively) compared with STAR.
Table 4 presents the cohort results of GC safety and performance of STAR and SPRINT in Christchurch. In targeting this 4.4–8.0 mmol/L range using model-pre-dictive methods to personalize treatment, STAR reduced
clinical workload in the same ICU (13.6 measurements per day per patient compared to 15.8, P < 0.05, Table 4) and increased nutrition delivery per episode compared with SPRINT (achieving 86 % of ACCP calorific goal feed compared to 73 %, P < 0.05, Table 5), when allowed to feed. It did so while maintaining consistent GC for a more critically ill and thus potentially more metabolically variable cohort [13].
STAR Christchurch versus STAR Gyula
The cohort demographics in Table 3 show the STAR Christchurch and Gyula cohorts have no significant dif-ference in gender or age. However, the STAR Gyula had much higher APACHE II scores (32 vs. 21, P < 0.05), ICU length of stay (14 vs. 5.7 days, P < 0.05) and ICU mor-tality rates (38.3 % vs. 24.3, P = 0.05) than the STAR Christchurch cohort.
Despite a significant increase in the severity of illness, STAR demonstrated consistent effective GC perfor-mance over the Gyula cohort. Table 5 shows that both Christchurch and Gyula STAR cohorts achieved over 86 % of time in its target range (4.4–8.0 mmol/l) per episode (86.6 and 87.1 %, respectively, P = 0.81), while maintaining very safe control of hypoglycemia per epi-sode, <4.0 mmol/L (0.0 and 0.9 % of time, respectively,
P < 0.05).
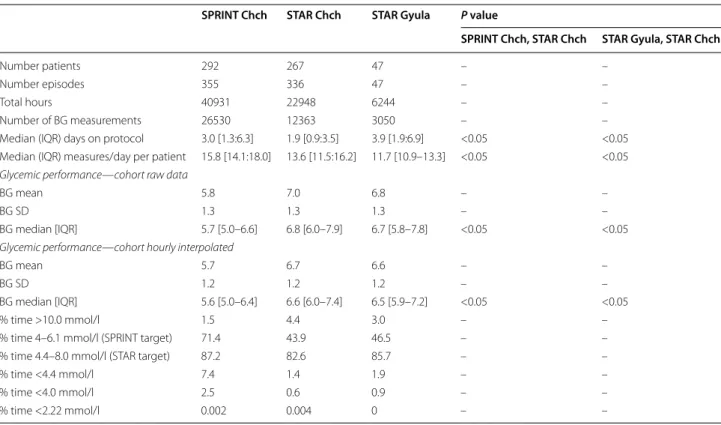
Table 4 Cohort glycemic control results for the STAR and SPRINT cohorts in Christchurch and Gyula Hospital ICU
Data are presented as median [inter-quartile range (IQR)] where appropriate
SPRINT Chch STAR Chch STAR Gyula P value
SPRINT Chch, STAR Chch STAR Gyula, STAR Chch
Number patients 292 267 47 – –
Number episodes 355 336 47 – –
Total hours 40931 22948 6244 – –
Number of BG measurements 26530 12363 3050 – –
Median (IQR) days on protocol 3.0 [1.3:6.3] 1.9 [0.9:3.5] 3.9 [1.9:6.9] <0.05 <0.05 Median (IQR) measures/day per patient 15.8 [14.1:18.0] 13.6 [11.5:16.2] 11.7 [10.9–13.3] <0.05 <0.05
Glycemic performance—cohort raw data
BG mean 5.8 7.0 6.8 – –
BG SD 1.3 1.3 1.3 – –
BG median [IQR] 5.7 [5.0–6.6] 6.8 [6.0–7.9] 6.7 [5.8–7.8] <0.05 <0.05
Glycemic performance—cohort hourly interpolated
BG mean 5.7 6.7 6.6 – –
BG SD 1.2 1.2 1.2 – –
BG median [IQR] 5.6 [5.0–6.4] 6.6 [6.0–7.4] 6.5 [5.9–7.2] <0.05 <0.05
% time >10.0 mmol/l 1.5 4.4 3.0 – –
% time 4–6.1 mmol/l (SPRINT target) 71.4 43.9 46.5 – –
% time 4.4–8.0 mmol/l (STAR target) 87.2 82.6 85.7 – –
% time <4.4 mmol/l 7.4 1.4 1.9 – –
% time <4.0 mmol/l 2.5 0.6 0.9 – –
Figure 1 shows the STAR BG distributions in these two ICUs are almost identical although P < 0.05 due to very large number of measurements. The per-patient BG mean and standard deviation were also very similar for both of the cohorts (P = 0.6 and 0.5, respectively). Thus, this evidence suggests that STAR is able to deliver con-sistent GC to different cohorts with significantly different clinical practices and illness severity.
Table 4 presents the cohort results of GC safety and performance of STAR in Christchurch and Gyula. Com-pared with the Christchurch, the Gyula clinical staff chose to use longer intervention intervals (11.7 vs. 13.6 measurements per day, P < 0.05) and feed a significantly higher amount of glucose per episode (5.1 vs. 7.4 g/h,
P < 0.05, Table 5), largely due to their higher carbohydrate parenteral feed regime, thus demanding higher insulin dosing per episode (2.7 vs. 3.2 U/h, P < 0.05, Table 5) and amplifying the effects of insulin sensitivity variations [24]. This ultimately resulted in the Gyula cohort having
a higher occurrence of moderate hypoglycemia (26.3 vs. 53.2 % of patients BG < 4.0 mmol/L, P < 0.05).
Discussion
Cohort Demographics
Table 2 shows that there has been a shift in severity of ill-ness in the Christchurch ICU over the past 7 years, with the patients on STAR being more critically ill on average than those on SPRINT. This phenomenon is not wholly unexpected. Increasing economic and demographic stress worldwide has placed greater demand on limited bed spaces. In highly occupied units like Christchurch (2.2 beds/1000 people), admission may be limited to the more critically ill [37].
The apparent increase in ICU mortality of patients on STAR compared with SPRINT could be due to the ICU experiencing a reduction in pressure to transfer patients not expected to survive to the ward. The hospital SMR reported in Table 2 shows an increase between the SPRINT
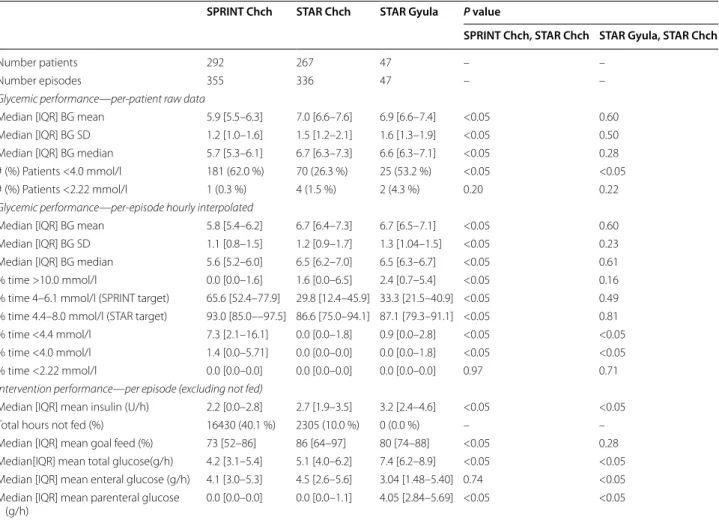
Table 5 Per-patient and per-episode glycemic control results for the STAR and SPRINT cohorts in Christchurch and Gyula Hospital ICU
Data are presented as median [inter-quartile range (IQR)] where appropriate
SPRINT Chch STAR Chch STAR Gyula P value
SPRINT Chch, STAR Chch STAR Gyula, STAR Chch
Number patients 292 267 47 – –
Number episodes 355 336 47 – –
Glycemic performance—per-patient raw data
Median [IQR] BG mean 5.9 [5.5–6.3] 7.0 [6.6–7.6] 6.9 [6.6–7.4] <0.05 0.60 Median [IQR] BG SD 1.2 [1.0–1.6] 1.5 [1.2–2.1] 1.6 [1.3–1.9] <0.05 0.50 Median [IQR] BG median 5.7 [5.3–6.1] 6.7 [6.3–7.3] 6.6 [6.3–7.1] <0.05 0.28 # (%) Patients <4.0 mmol/l 181 (62.0 %) 70 (26.3 %) 25 (53.2 %) <0.05 <0.05 # (%) Patients <2.22 mmol/l 1 (0.3 %) 4 (1.5 %) 2 (4.3 %) 0.20 0.22
Glycemic performance—per-episode hourly interpolated
Median [IQR] BG mean 5.8 [5.4–6.2] 6.7 [6.4–7.3] 6.7 [6.5–7.1] <0.05 0.60 Median [IQR] BG SD 1.1 [0.8–1.5] 1.2 [0.9–1.7] 1.3 [1.04–1.5] <0.05 0.23 Median [IQR] BG median 5.6 [5.2–6.0] 6.5 [6.2–7.0] 6.5 [6.3–6.7] <0.05 0.61 % time >10.0 mmol/l 0.0 [0.0–1.6] 1.6 [0.0–6.5] 2.4 [0.7–5.4] <0.05 0.16 % time 4–6.1 mmol/l (SPRINT target) 65.6 [52.4–77.9] 29.8 [12.4–45.9] 33.3 [21.5–40.9] <0.05 0.49 % time 4.4–8.0 mmol/l (STAR target) 93.0 [85.0––97.5] 86.6 [75.0–94.1] 87.1 [79.3–91.1] <0.05 0.81 % time <4.4 mmol/l 7.3 [2.1–16.1] 0.0 [0.0–1.8] 0.9 [0.0–2.8] <0.05 <0.05 % time <4.0 mmol/l 1.4 [0.0–5.71] 0.0 [0.0–0.0] 0.0 [0.0–1.8] <0.05 <0.05 % time <2.22 mmol/l 0.0 [0.0–0.0] 0.0 [0.0–0.0] 0.0 [0.0–0.0] 0.97 0.71
Intervention performance—per episode (excluding not fed)
Median [IQR] mean insulin (U/h) 2.2 [0.0–2.8] 2.7 [1.9–3.5] 3.2 [2.4–4.6] <0.05 <0.05 Total hours not fed (%) 16430 (40.1 %) 2305 (10.0 %) 0 (0.0 %) – – Median [IQR] mean goal feed (%) 73 [52–86] 86 [64–97] 80 [74–88] <0.05 0.28 Median[IQR] mean total glucose(g/h) 4.2 [3.1–5.4] 5.1 [4.0–6.2] 7.4 [6.2–8.9] <0.05 <0.05 Median [IQR] mean enteral glucose (g/h) 4.1 [3.0–5.3] 4.5 [2.6–5.6] 3.04 [1.48–5.40] 0.74 <0.05 Median [IQR] mean parenteral glucose
and STAR Christchurch cohorts (0.76 vs. 0.86, respectively). This suggests that the APACHE II risk of death scores is slightly more representative of the cohort’s illness in the STAR cohort compared with the SPRINT cohort. The sig-nificant difference in the severity of illness between the STAR Gyula cohort and the Christchurch cohorts is largely due to the different entrance criteria, as only one STAR tab-let computer is available and STAR is thus reserved for the more critically ill patients, as clinically selected.
STAR versus SPRINT
Compared with SPRINT, both STAR cohorts had slightly lower time in the 4.4–8.0 mmol/L band per episode (86.6 and 87.1 % vs. 93.0 %). SPRINT targeted a lower and tighter range (4.4–6.1 mmol/L), resulting in an increased incidence of moderate hypoglycemia (BG < 4.0 mmol/L, 62.0 vs. 26.3 % and 53.2 % of patients) compared with STAR. However, recent studies have shown that time in the essentially same band, 3.9–7.8 mmol/L, is associated with improved outcomes [34], supporting this slightly higher upper target limit of 8.0 mmol/L.
Flexibility to patient-specific requirements is a critical aspect of the STAR model-based protocol as the tablet application allows nursing staff to enter any information that may change the patient’s insulin or nutrition require-ments. This approach allows STAR to adapt to patient-specific needs and provide appropriate recommendations that take into account all necessary considerations. Con-versely, STAR achieved 96.8 % compliance from nursing staff (unchanged interventions) for nutrition delivery and 99.5 % for insulin interventions.
SPRINT was deliberately designed to target nutrition to 60–70 % or lower for control, which reduced insulin requirements and thus risk of hypoglycemia [31, 38]. SPRINT had a maximum 2-h measurement rate for the same reasons of risk mitigation which increased work-load relative to STAR’s 3-h maximum. In addition, the tighter SPRINT target (4.4–6.1 mmol/L) is also part of the reason for this increased nurse workload and lower feeding on SPRINT. For STAR, the use of stochastic risk models and virtual patient design in silico enabled the lower workload and play a role in the higher nutrition possible, although a wider overlapping target band also enables some of this increased nutrition
Both STAR and SPRINT Christchurch have the same starting and stopping criteria. However, patients on STAR Christchurch required insulin therapy for 36.7 % fewer days than SPRINT (P < 0.05, Table 4). Differences that could account for this significant reduction in length of treatment for a more critically ill cohort include:
1. Significantly reduced incidence of moderate hypogly-cemia (BG < 4.0 mmol/L) with STAR.
2. Slightly higher median BG with STAR, with similar BG in the 4.4–8.0 mmol/L range.
3. Increased mortality on the STAR protocol.
4. Increased amount of carbohydrate, protein, fiber and nutrition content delivered by STAR.
The number of patients experiencing moderate hypo-glycemia is not enough to account for the size of this change. A recent analysis by Krinsley et al. [34] sug-gests that the 3.9–7.8 mmol/L band, similar to that tar-geted by STAR, is beneficial. Despite the lower median BG for SPRINT, the time in the 4.4–8.0 mmol/L band is very similar for both protocols. ICU and hospital mor-tality were higher for STAR due to changes in the illness severity and demographic factors, as given in Table 2. However, the percentage mortality while on the respec-tive GC protocol is very similar (5.5 vs. 6.4 %, P = 0.72, Table 2), suggesting that the reduction in period of GC is less likely to be attributed to the cohorts respective mortality. This outcome leaves the increased carbohy-drate, protein, fiber and overall nutrition intake as a potential reason for the reduced length of GC. How-ever, there is significant debate about the role of energy and protein delivery in critical illness [39], with some literature showing increased calorific intake levels that are still below the 100 % calorific goal have ben-eficial effects [40] and others showing no effect [41]. In this study, the median per-episode feed for the STAR Christchurch cohort was 86 % of calorific goal feed, shown by Heyland et al. [42] to be a region of reduced risk of death. BG [mmol/L] 0 2 4 6 8 10 12 14 Cummulative Freq 0 0.1 0.2 0.3 0.4 0.5 0.6 0.7 0.8 0.9 1
Cohort BG CDF - Resampled Hourly
STAR Chch STAR Gyula SPRINT
Fig. 1 BG CDF—resampled hourly. Cumulative density plots
compar-ing the STAR Christchurch, STAR Gyula, SPRINT Christchurch cohorts hourly resampled BG. The target band 4.4–8.0 mmol/L is shown in the
STAR Christchurch versus STAR Gyula
STAR entry criteria were the same in both units based on hyperglycemia (BG > 8.0 mmol/L) or clinician choice. STAR was used for a patient through their entire stay or multiple episodes of stay in Gyula and is the standard of care for the Christchurch ICU for all GC. Hence, the study, while a retrospective analysis, is run essentially prospectively in that all patients who had STAR with the same target band were included from each unit.
One difference between Gyula and Christchurch cohorts is that with a single tablet to run STAR in Gyula, clinician’s likely chose the more ill patients they thought would benefit. This choice could likely have biased the severity of illness upwards, as well as the length of stay (Table 3). It may have similarly affected the difference in ICU mortality in Table 3, although this comparison is sig-nificantly underpowered given the low patient numbers in Gyula and could thus also be due to statistical varia-tion. Hence, variation in these cohorts is biased by this choice, and the results in Table 3 could be due to one or a combination of these factors, making GC in this cohort easier or more difficult depending on the patients selected. However, this difference is not as relevant to showing that STAR can provide safe, effective GC results across very different patients and clinical practices.
In the STAR Christchurch cohort, four patients expe-rienced severe hypoglycemia, and in the Gyula cohort, two patients experienced severe hypoglycemia. STAR’s model-based predictive GC forward predicts potential patient-specific behavior using the 5th and 95th percen-tile, choosing an intervention to optimize the placement of these stochastic bounds [28, 33]. Therefore, all of the hypoglycemic cases occurred outside of STAR’s cohort-based model-predictive bounds. Each of these patients had a 99th percentile (outlier) patient-specific model-based insulin sensitivity during their hypoglycemic epi-sode, and the number of events suggests this is a 1-in-100 event, which broadly matches the cohort results given in Table 5.
Limitations
A total of 19 patients were excluded from the STAR Christchurch (15) and Gyula (4) analysis as they received more than 120 % of ACCP recommended caloric target on average. In some instances, the high level of nutrition may be clinically specified, but in most cases the high level of nutrition is due to nursing staff choosing to fix enteral and/or parenteral feed on STAR.
The discrepancy in patient numbers between the two STAR cohorts, over approximately the same time period, is due to only one of STAR tablet being available in Gyula, compared with 10 in Christchurch. The number of patients in the Gyula cohort is low, and therefore, we do
not have enough power (52 %, p test) for comparison to the Christchurch cohort in relation to raw mortality on the STAR GC protocol in Gyula, or morbidity and per-patient BG statistics (e.g., per-per-patient TIB, mean/median BG). Sufficiently more patients would be required for a well powered outcome study on mortality or morbidity.
It should be noted that there was patient selection bias for STAR Gyula, creating significantly different cohorts in terms of ICU length of stay and severity of illness (P < 0.05, Table 3). The difference in the cohorts could result in GC being more complex or simpler in the Gyula cohort relative to the Christchurch cohort due to more severely ill patients being more variable or possibly longer length of stay patients being more stable.
It is worth noting that both severe hypoglycemic events on STAR, in Christchurch, occurred at high fixed nutri-tion rates over 100 % of ACCP goal feed, but <120 %. High fixed nutrition rates raise a patients BG all else equal, resulting in the need for higher or maximum insu-lin rates to control hyperglycemia. The large amount of insulin in the patient then amplifies any small changes in the patient’s insulin sensitivity due to changes in condi-tion, significantly reducing the ability to control BG safely and effectively [24]. Despite high fixed nutrition inputs, up to 120 % goal feed in some cases, making glycemic control more difficult, it is also an important feature of the STAR application, allowing it to be more flexible to specific clinical needs. However, in these specific cases lower (100 % or less) and/or variable nutrition would have allowed greater safety [28].
As mentioned previously, STAR and SPRINT target dif-ferent BG bands (4.4–8.0 mmol/L and 4.4–6.1 mmol/L, respectively). These BG targets overlap but vary in width and level of BG, and therefore, the comparison of these two protocols in terms of percentage of time in 4.4-8.0 mmol/L BG band may be an unfair statistic consider-ing that only one the protocols actually targeted this band. The only way to fairly compare the two protocols perfor-mance would be if they both targeted the same BG target.
To compare the STAR GC protocol to other ICU GC protocols is difficult as the cohorts need to be similar, and the same statistics need to be reported. Considering performance, safety and workload to achieve them, other studies have shown similar performance based on time in band [43–46]. STAR achieved these performance and safety results with a lower relative clinical workload over a much larger, more diverse and relatively very ill cohort. With the data available, it appears that STAR performs very well in comparison with other current ICU GC pro-tocols with better safety and lower workload. However, a best protocol cannot be determined without the same statistics being reported and the cohorts being much more similar.
Sensor error can affect the quality of control [47], particularly in target to value protocols [48]. SPRINT was designed in silico to be robust to these errors for the Arkray Super-Glucocard™ II glucometers used (CV < 10 % [49]). STAR is more robust to this error as its integral-based identification of insulin sensitivity in the model filters the error [50], and its target to range approach and the outlying changes in insulin sensitivity in the stochastic model used to guide control are more robust to these errors. In addition, Christchurch Hospital ICU changed to the more reliable Accu-Chek Infor II glu-cometer in 2012 (CV ≤ 3.2 % [51]). The Gyula unit used a E77 Elektronika Dcont Optimum or Dcont Personal Glu-cometers (CV < 4.6 %).
By using model-based predictive GC tailored to patient-specific metabolic response, through identifying their respective time variant insulin sensitivity, safe and effective GC can be offered. With the stochastic models of insulin sensitivity variability used, STAR thus directly manages inter- and intra-patient variability to improve safety. Other protocols could have failed in the past due to their inability to adjust for this inter- and intra-patient variability via model-based GC on a computer. Consider-ing that this study is a retrospective analysis, as opposed to a randomized control trial, we cannot explicitly link the outcomes to GC. Thus, the main focus of this study is to demonstrate that safe, effective and generalizable GC is possible.
Conclusions
This retrospective, observational study analyzed the GC safety, performance and generalizability of the STAR protocol in Christchurch, New Zealand and Gyula, Hun-gary. Results of STARs predecessor, SPRINT, were pre-sented for comparison. Patients on the STAR protocol spend over 86 % of all time on protocol within the goal 4.4-8.0 mmol/L BG band, with very few occurrences of severe or moderate hypoglycemia. STAR outperformed SPRINT by providing higher nutrition and safe, effective control for all days of stay, as well as reducing time on protocol and workload.
Overall, in Christchurch, the STAR framework has shown an ability to adapt well to a wide range of situa-tions, and provide safe and effective treatment at all times. It has also reduced clinical burden in the ICU, by lowering the number of measurements and interventions needed to achieve equivalent control to SPRINT, while improving safety.
A key criterion for success in any protocol is the ability to demonstrate high performance and high safety across patient types, time, clinical practice culture and clinical resources. The results of the STAR protocol in Gyula, Hungary, are used to analyze this criterion. The results
show that STAR has comprehensively met these crite-ria, with the BG distributions of the two cohorts being almost identical even though the clinical practices are significantly different.
Thus, this research shows how a model-based and per-sonalized approach to GC can safely improve care and reduce workload across differing clinical practices.
Abbreviations
STAR: stochastic targeted; GC: glycemic control; BG: blood glucose; APACHE: Acute Physiology and Chronic Health Evaluation; SPRINT: Specialized Relative Insulin and Nutrition Tables; IQR: inter-quartile range; ICU: intensive care unit; SCCM: Society of Critical Care Medicine; ACCP: American College of Chest Physicians; IV: intravenous; CDF: cumulative distribution function.
Authors’ contributions
JGC, GS, CP and BB conceived and developed the STAR protocol. GS assisted implementing the protocol in the Christchurch ICU, New Zealand. AI and SNN implemented the protocol in the Kálmán Pándy ICU, Gyula, Hungary. KS, HT, JH and FT assisted in the Christchurch implementation, software development for STAR and the data collection, analysis and interpretation of the data. KS, CP and JGC drafted the manuscript. All authors read and approved the final manuscript.
Author details
1 Department of Mechanical Engineering, Centre for Bio-Engineering, University of Canterbury, Private Bag 4800, Christchurch 8140, New Zealand. 2 Department of Intensive Care, Christchurch Hospital, Christchurch, New Zealand. 3 Department of Control Engineering and Information Technol-ogy, Budapest University of Technology and Economics, Budapest, Hungary. 4 Department of Intensive Care, Kálmán Pándy Hospital, Gyula, Hungary.
Acknowledgements
We acknowledge the support of UC Doctoral Scholarships for Kent Stewart and Felicity Thomas, as well as funding from EU FP7, RSNZ IRSES mobility grants and the HRC of NZ.
Competing interests
The authors declare that they have no competing interests. Received: 5 October 2015 Accepted: 8 March 2016
References
1. Capes SE, Hunt D, Malmberg K, Gerstein HC. Stress hyperglycaemia and increased risk of death after myocardial infarction in patients with and without diabetes: a systematic overview. Lancet. 2000;355:773–8. 2. Finney SJ, Zekveld C, Elia A, Evans TW. Glucose control and mortality in
critically ill patients. JAMA. 2003;290:2041–7.
3. McCowen KC, Malhotra A, Bistrian BR. Stress-induced hyperglycemia. Crit Care Clin. 2001;17:107–24.
4. Krinsley JS. Association between hyperglycemia and increased hospital mortality in a heterogeneous population of critically ill patients. Mayo Clin Proc. 2003;78:1471–8.
5. Egi M, Bellomo R, Stachowski E, French CJ, Hart G. Variability of blood glucose concentration and short-term mortality in critically ill patients. Anesthesiology. 2006;105:244–52.
6. Krinsley JS. Glycemic variability: a strong independent predictor of mor-tality in critically ill patients. Crit Care Med. 2008;36:3008–13.
7. Van den Berghe G, Wouters P, Weekers F, Verwaest C, Bruyninckx F, Schetz M, Vlasselaers D, Ferdinande P, Lauwers P, Bouillon R. Intensive insulin therapy in the critically ill patients. N Engl J Med. 2001;345:1359–67. 8. Chase JG, Shaw G, Le Compte A, Lonergan T, Willacy M, Wong XW, Lin
protocol for tight glycaemic control in critically ill patients: a clinical practice change. Crit Care. 2008;12:R49.
9. Krinsley JS. Effect of an intensive glucose management protocol on the mortality of critically ill adult patients. Mayo Clin Proc. 2004;79:992–1000. 10. Chase JG, Pretty CG, Pfeifer L, Shaw GM, Preiser JC, Le Compte AJ, Lin
J, Hewett D, Moorhead KT, Desaive T. Organ failure and tight glycemic control in the SPRINT study. Crit Care. 2010;14:R154.
11. Krinsley JS, Jones RL. Cost analysis of intensive glycemic control in criti-cally ill adult patients. Chest. 2006;129:644–50.
12. Van den Berghe G, Wouters PJ, Kesteloot K, Hilleman DE. Analysis of healthcare resource utilization with intensive insulin therapy in critically ill patients. Crit Care Med. 2006;34:612–6.
13. Pretty CG, Le Compte AJ, Chase JG, Shaw GM, Preiser JC, Penning S, Desaive T. Variability of insulin sensitivity during the first 4 days of criti-cal illness: implications for tight glycemic control. Ann Intensiv Care. 2012;2:17.
14. Finfer S, Delaney A. Tight glycemic control in critically ill adults. JAMA. 2008;300:963–5.
15. Brunkhorst FM, Engel C, Bloos F, Meier-Hellmann A, Ragaller M, Weiler N, Moerer O, Gruendling M, Oppert M, Grond S, Olthoff D, Jaschinski U, John S, Rossaint R, Welte T, Schaefer M, Kern P, Kuhnt E, Kiehntopf M, Hartog C, Natanson C, Loeffler M, Reinhart K. Intensive insulin therapy and pen-tastarch resuscitation in severe sepsis. N Engl J Med. 2008;358:125–39. 16. Griesdale DE, de Souza RJ, van Dam RM, Heyland DK, Cook DJ, Malhotra
A, Dhaliwal R, Henderson WR, Chittock DR, Finfer S, Talmor D. Intensive insulin therapy and mortality among critically ill patients: a meta-analysis including NICE-SUGAR study data. Can Med Assoc J. 2009;180:821–827. 17. Treggiari MM, Karir V, Yanez ND, Weiss NS, Daniel S, Deem SA.
Inten-sive insulin therapy and mortality in critically ill patients. Crit Care. 2008;12:R29.
18. Kalfon P, Giraudeau B, Ichai C, Guerrini A, Brechot N, Cinotti R, Dequin PF, Riu-Poulenc B, Montravers P, Annane D, Dupont H, Sorine M, Riou B. Tight computerized versus conventional glucose control in the ICU: A randomized controlled trial. Intensive Care Med. 2014;40:171–81. 19. Hamimy W, Khedr H, Rushdi T, Zaghloul A, Hosni M, Aal AA. Application of
conventional blood glucose control strategy in surgical ICU in develop-ing countries: Is it beneficial? Egypt J Anaesth. 2015;32(1):123–129. 20. Van den Berghe G, Wilmer A, Hermans G, Meersseman W, Wouters PJ,
Milants I, Van Wijngaerden E, Bobbaers H, Bouillon R. Intensive insulin therapy in the medical ICU. N Engl J Med. 2006;354:449–61. 21. Egi M, Bellomo R, Stachowski E, French CJ, Hart GK, Taori G, Hegarty C,
Bailey M. Hypoglycemia and outcome in critically ill patients. Mayo Clin Proc. 2010;85:217–24.
22. Bagshaw SM, Bellomo R, Jacka MJ, Egi M, Hart GK, George C. The impact of early hypoglycemia and blood glucose variability on outcome in criti-cal illness. Crit Care. 2009;13:R91.
23. Finfer S, Liu B, Chittock DR, Norton R, Myburgh JA, McArthur C, Mitchell I, Foster D, Dhingra V, Henderson WR, Ronco JJ, Bellomo R, Cook D, McDon-ald E, Dodek P, Hebert PC, Heyland DK, Robinson BG. Hypoglycemia and risk of death in critically ill patients. N Engl J Med. 2012;367:1108–18. 24. Chase JG, Le Compte AJ, Suhaimi F, Shaw GM, Lynn A, Lin J, Pretty CG,
Razak N, Parente JD, Hann CE, Preiser J-C, Desaive T. Tight glycemic con-trol in critical care-The leading role of insulin sensitivity and patient vari-ability: a review and model-based analysis. Comput Methods Programs Biomed. 2011;102:156–71.
25. Langouche L, Vander Perre S, Wouters PJ, D’Hoore A, Hansen TK, Van den Berghe G. Effect of intensive insulin therapy on insulin sensitivity in the critically ill. J Clin Endocrinol Metab. 2007;92:3890–7.
26. Thomas F, Pretty CG, Fisk L, Shaw GM, Chase JG, Desaive T. Reducing the impact of insulin sensitivity variability on glycaemic outcomes using separate stochastic models within the STAR glycaemic protocol. Biomed Eng Online. 2014;13:43.
27. Dickson JL, Gunn CA, Chase JG. Humans are horribly variable. Int J Clin Med Imaging. 2014;1(2).
28. Fisk L, Lecompte A, Penning S, Desaive T, Shaw G, Chase G. STAR develop-ment and protocol comparison. IEEE Trans Biomed Eng. 2012;59:3357–64. 29. Evans A, Le Compte A, Tan CS, Ward L, Steel J, Pretty CG, Penning S, Suhaimi
F, Shaw GM, Desaive T. Stochastic targeted (STAR) glycemic control: design, safety, and performance. J Diabetes Sci Technol. 2012;6:102–15.
30. Lin J, Razak NN, Pretty CG, Le Compte A, Docherty P, Parente JD, Shaw GM, Hann CE, Geoffrey Chase J. A physiological intensive control
insulin-nutrition-glucose (ICING) model validated in critically ill patients. Comput Methods Programs Biomed. 2011;102:192–205.
31. Chase JG, Suhaimi F, Penning S, Preiser JC, Le Compte AJ, Lin J, Pretty CG, Shaw GM, Moorhead KT, Desaive T. Validation of a model-based virtual trials method for tight glycemic control in intensive care. Biomed Eng Online. 2010;9:84.
32. Lin J, Lee D, Chase JG, Shaw GM, Hann CE, Lotz T, Wong J. Stochastic modelling of insulin sensitivity variability in critical care. Biomed Signal Process Control. 2006;1:229–42.
33. Lin J, Lee D, Chase JG, Shaw GM, Le Compte A, Lotz T, Wong J, Lonergan T, Hann CE. Stochastic modelling of insulin sensitivity and adaptive glycemic control for critical care. Comput Methods Programs Biomed. 2008;89:141–52.
34. Krinsley JS, Preiser J-C. Time in blood glucose range 70–140 mg/dL > 80% is strongly associated with increased survival in non-diabetic critically ill adults. Crit Care. 2015;19(1):179–189.
35. Cerra FB, Benitez MR, Blackburn GL, Irwin RS, Jeejeebhoy K, Katz DP, Pingleton SK, Pomposelli J, Rombeau JL, Shronts E, Wolfe RR, Zaloga GP. Applied nutrition in ICU patients. A consensus statement of the American College of Chest Physicians. Chest. 1997;111:769–78.
36. Finfer S, Wernerman J, Preiser J-C, Cass T, Desaive T, Hovorka R, Joseph JI, Kosiborod M, Krinsley J, Mackenzie I, Mesotten D, Schultz MJ, Scott MG, Slingerland R, Van den Berghe G, Van Herpe T. Clinical review: consensus recommendations on measurement of blood glucose and reporting glycemic control in critically ill adults. Crit Care. 2013;17:229.
37. Chase JG, Shaw GM. How standard is the “S” in SMR? Intensive Care Med. 2011;38(1)1–3. doi:10.1007/s00134-011-2392-0
38. Lonergan T, Le Compte A, Willacy M, Chase JG, Shaw GM, Hann CE, Lotz T, Lin J, Wong X-WW. A pilot study of the SPRINT protocol for tight glycemic control in critically Ill patients. Diabetes Technol Ther. 2006;8:449–62. 39. Preiser J-C, van Zanten AR, Berger MM, Biolo G, Casaer MP, Doig GS,
Griffiths RD, Heyland DK, Hiesmayr M, Iapichino G, Laviano A, Pichard C, Singer P, Van den Berghe G, Wernerman J, Wischmeyer P, Vincent J-L. Metabolic and nutritional support of critically ill patients: consensus and controversies. Crit Care. 2015;19:1–11.
40. Alberda C, Gramlich L, Jones N, Jeejeebhoy K, Day AG, Dhaliwal R, Heyland DK. The relationship between nutritional intake and clinical outcomes in critically ill patients: results of an international multicenter observational study. Intensive Care Med. 2009;35:1728–37.
41. Arabi YM, Aldawood AS, Haddad SH, Al-Dorzi HM, Tamim HM, Jones G, Mehta S, McIntyre L, Solaiman O, Sakkijha MH, Sadat M, Afesh L. Permis-sive underfeeding or standard enteral feeding in critically ill adults. N Engl J Med. 2015;372(25):2398–2408.
42. Heyland DK, Cahill N, Day AG. Optimal amount of calories for critically ill patients: depends on how you slice the cake! Crit Care Med. 2011;39:1. 43. Amrein K, Ellmerer M, Hovorka R, Kachel N, Fries H, von Lewinski D, Smolle
K, Pieber TR, Plank J. Efficacy and safety of glucose control with space glucose control in the medical intensive care unit—an open clinical investigation. Diabetes Technol Ther. 2012;14:690–5.
44. Van Herpe T. LOGIC-insulin algorithm—guided versus nurse-directed blood glucose control during critical illness. Diabetes Care. 2013;36:188–94. 45. Rood E, Bosman R, Van der Spoel J, Taylor P, Zandstra D. Use of a computerized guideline for glucose regulation in the ICU improved both guideline adher-ence and glucose regulation. J Am Med Inform Assoc 2004;12(2):172–181. 46. Kulnik R, Plank J, Pachler C, Wilinska ME, Groselj-Strele A, Rothlein D,
Wufka M, Kachel N, Smolle KH, Perl S, Pieber TR, Hovorka R, Ellmerer M. Evaluation of implementation of a fully automated algorithm (enhanced model predictive control) in an interacting infusion pump system for establishment of tight glycemic control in medical intensive care unit patients. J Diabetes Sci Technol. 2008;2:963–70.
47. Boyd JC, Bruns DE. Chapter 16 Monte Carlo simulation in establishing analytical quality requirements for clinical laboratory tests, vol. 467. 1st ed. Amsterdam: Elsevier; 2009.
48. Le Compte AJ, Pretty CG, Shaw GM, Chase JG. Glucometer accuracy and implications for clinical studies. Crit Care. 2012;16(Suppl 1):P173. 49. Arkray. GlucocardTM test strip 2 data sheet. Japan: Arkray Inc; 2007. 50. Hann CE, Chase JG, Lin J, Lotz T, Doran CV, Shaw GM. Integral-based
param-eter identification for long-term dynamic verification of a glucose-insulin system model. Comput Methods Programs Biomed. 2005;77:259–70. 51. Roche Diagnostics. ACCU-CHEK comfort curve—test strip sheet.