https://doi.org/10.1007/s00204-018-2368-8 TOXICOKINETICS AND METABOLISM
The role of roughage provision on the absorption and disposition
of the mycotoxin deoxynivalenol and its acetylated derivatives
in calves: from field observations to toxicokinetics
Bonnie Valgaeren1,2 · Léonard Théron3 · Siska Croubels4 · Mathias Devreese4 · Siegrid De Baere4 ·
Els Van Pamel5 · Els Daeseleire5 · Marthe De Boevre6 · Sarah De Saeger6 · Arnau Vidal6 · José Diana Di Mavungu6 · Philipp Fruhmann7,8 · Gerhard Adam8 · Alfons Callebaut9 · Calixte Bayrou10 · Vincent Frisée3 · Anne‑Sophie Rao3 · Emilie Knapp3 · Arnaud Sartelet3 · Bart Pardon1 · Piet Deprez1 · Gunther Antonissen4,11
Received: 28 March 2018 / Accepted: 29 November 2018 © Springer-Verlag GmbH Germany, part of Springer Nature 2018
Abstract
A clinical case in Belgium demonstrated that feeding a feed concentrate containing considerable levels of deoxynivalenol (DON, 1.13 mg/kg feed) induced severe liver failure in 2- to 3-month-old beef calves. Symptoms disappeared by replacing the highly contaminated corn and by stimulating ruminal development via roughage administration. A multi-mycotoxin contamination was demonstrated in feed samples collected at 15 different veal farms in Belgium. DON was most prevalent, contaminating 80% of the roughage samples (mixed straw and maize silage; average concentration in positives: 637 ± 621 µg/ kg, max. 1818 µg/kg), and all feed concentrate samples (411 ± 156 µg/kg, max. 693 µg/kg). In order to evaluate the impact of roughage provision and its associated ruminal development on the gastro-intestinal absorption and biodegradation of DON and its acetylated derivatives (3- and 15-ADON) in calves, a toxicokinetic study was performed with two ruminat-ing and two non-ruminatruminat-ing male calves. Animals received in succession a bolus of DON (120 µg/kg bodyweight (BW)), 15-ADON (50 µg/kg BW), and 3-ADON (25 µg/kg) by intravenous (IV) injection or per os (PO) in a cross-over design. The absolute oral bioavailability of DON was much higher in non-ruminating calves (50.7 ± 33.0%) compared to ruminat-ing calves (4.1 ± 4.5%). Immediately followruminat-ing exposure, 3- and 15-ADON were hydrolysed to DON in ruminatruminat-ing calves. DON and its acetylated metabolites were mainly metabolized to 3-glucuronide, however, also small amounts of DON-15-glucuronide were detected in urine. DON degradation to deepoxy-DON (DOM-1) was only observed to a relevant extent in ruminating calves. Consequently, toxicity of DON in calves is closely related to roughage provision and the associated stage of ruminal development.
Keywords Biodegradation · Calf · Deoxynivalenol · 3- and 15-Acetyldeoxynivalenol · Mycotoxin · Toxicokinetics
Introduction
Mycotoxins are toxic secondary metabolites, produced by different fungal species, predominantly of the genera
Asper-gillus, Penicillium and Fusarium. In the temperate climate
of Western Europe, Fusarium is one of the most important toxigenic fungal genera infecting different cereal crops (Schatzmayr and Streit 2013). Although members of this genus can cause grain yield losses, the interest in Fusarium head blight is primarily fuelled by the ability of the major-ity of the Fusarium species to produce mycotoxins. These mycotoxins exhibit toxicity and pose a potential acute or chronic health threat to humans and animals upon ingestion of contaminated food or feed (Antonissen et al. 2014, 2015;
Bonnie Valgaeren and Léonard Théron contributed equally to this work.
Alfons Callebaut: Deceased.
Electronic supplementary material The online version of this article (https ://doi.org/10.1007/s0020 4-018-2368-8) contains supplementary material, which is available to authorized users. * Gunther Antonissen
Gunther.Antonissen@UGent.be
Bennett and Klich 2003). The mycotoxin deoxynivalenol (DON) is one of the most frequently detected Fusarium mycotoxins in feed and feed raw materials (Kovalsky et al.
2016). DON is a type B trichothecene mainly produced by
F. graminearum and F. culmorum (Bottalico 1998). It is well known that DON acts as an inhibitor of the protein synthesis at the ribosomal level (Thompson and Wannemacher 1986). Therefore, it is suggested that rapidly proliferating cells and tissues with high protein turnover rates, such as the immune system, liver, and gastrointestinal tract are most affected (Maresca 2013; Pestka and Smolinski 2005). Hence, this can lead to poor production results in farm animals and an enhanced susceptibility to infectious diseases (Antonissen et al. 2014).
In addition to the free mycotoxin DON, other forms that are plant derived, such as deoxynivalenol-3-β-d-glucoside
(DON3G), or fungus-derived, such as 3-acetyldeoxynivale-nol (3-ADON), and 15-acetyldeoxynivale3-acetyldeoxynivale-nol (15-ADON), are frequently detected in food and feed as well (Berthiller et al. 2013; Broekaert et al. 2015a; De Boevre et al. 2012; Van Asselt et al. 2012). In pigs, both ADONs are completely absorbed following oral administration, while the oral bio-availability of DON and acetylated derivatives is rather low in broiler chickens (Broekaert et al. 2015b). For DON, it has been demonstrated multiple factors might influence the oral bioavailability of DON such as the prandial state (fed versus fasted), the administration of a bolus versus the administration of contaminated feed, feed composition, and breed (Broekaert et al. 2015b; Eriksen and Pettersson 2004; Goyarts and Dänicke 2006; Prelusky et al. 1988; Saint-Cyr et al. 2015). Taking into account the substantial to complete presystemic hydrolysis of both ADONs, in broiler chickens and pigs, these acetylated forms can be regarded as potent as DON itself with regard to systemic toxicity (Broekaert et al. 2015b). The same has been reported for DON3G in pigs where a complete presystemic hydrolysis takes place (Broekaert et al. 2017). Furthermore, DON and its acety-lated forms are metabolized to DON-glucuronides (GlcA) or DON-sulfate, which are both phase II metabolites (Payros et al. 2016; Schwartz-Zimmermann et al. 2015). Glucuro-nidation of DON has been identified as a major biotransfor-mation pathway in mammals (Maul et al. 2012). In contrast, DON-3-GlcA is only a minor phase II metabolite in broilers and turkey poults. It has been demonstrated that poultry bio-transform DON more extensively to the sulfate conjugate, such as DON-3α-sulfate, pointing towards species-specific metabolism (Devreese et al. 2015; Wan et al. 2014). Besides, sulfonation has been described for rats, however, its mecha-nism had not yet been elucidated (Schwartz-Zimmermann et al. 2014; Wan et al. 2014).
In general, the susceptibility of ruminants to DON is sug-gested to be low, as DON is converted into the less toxic de-epoxy-deoxynivalenol (DOM-1) by the ruminal flora
(Fink-Gremmels 2008). Studies by Ingalls (1996) and Yoshi-zawa et al. (1986) showed that ruminating cattle might toler-ate diets containing up to 14.6 mg DON/kg feed for 3 weeks without major health effects. However, Dänicke et al. (2005) reported a transiently increased post-prandial ammonia con-centration in the rumen and a reduction in duodenal flow of microbial protein when feeding cows a wheat-based diet contaminated with DON, at concentrations of 3.1–3.5 mg DON/kg of daily diet at a reference dry matter (DM) con-tent of 88%. Consequently, the impact of DON ingestion in ruminants is still controversial and needs further clarifica-tion. Fink-Gremmels (2008) suggested that there is a cor-relation between the ruminal capacity to inactivate certain mycotoxins, and the likelihood of adverse health effects in cattle. A diet that provides sufficient amounts of roughage is required to maintain a functional ruminal flora. On the other hand, intensive feeding regimes, which are used in the specialized modern veal and beef industry in order to maximize production efficiency, include an increased feed concentrate provision (containing grains such as wheat, bar-ley and corn). In the beef industry, rations are very variable. Some farms are known to feed a ration with a low roughage to feed concentrate ratio in order to maximize energy intake and growth, leading to a delay of ruminal development and fermentation (Zhang et al. 2018). In contrast, the veal indus-try is highly integrated, and the diet is similar for all farms. The calves are predominantly fed with milk replacer, com-plemented with a minimum of 250 g to 2 kg per day per calf of a mixture of 90% whole grains, mixed with 10% chopped straw. This roughage to feed concentrate ratio is insufficient to induce normal rumination and ruminal fermentation (Ber-ends et al. 2014; Webb et al. 2015).
The European Food Safety Authority (EFSA) panel on contaminants in the food chain (CONTAM) noted that the risk for DON and its acetylated metabolites could be higher for pre-ruminant animals such as calves (Knutsen et al. 2017). Accordingly, the European Union maximum guidance levels of DON in complete feed for young calves (< 4 months of age) are lower compared to adult ruminants, 2 versus 5 mg DON/kg feed, respectively (2006/576/EC). However, current legislation does not take into account acet-ylated forms of DON and the variation in ruminal develop-ment between different ruminant production systems such as dairy, beef and veal into account.
Furthermore, data from monogastric animals showed that also mycotoxin contamination levels below these European guidance levels can compromise several intestinal functions, such as digestion, absorption, permeability, and suscepti-bility to intestinal and systemic infectious diseases, which can result in lower productivity and poor health of animals (Antonissen et al. 2014, 2015; Bouhet and Oswald 2005; Gallo et al. 2015; Pinton and Oswald 2014). Besides gastro-intestinal toxicity, DON-induced hepatotoxicity was reported
in piglets fed a DON-contaminated diet (1.5–2.8 mg/kg feed) for 4–5 weeks (Bracarense et al. 2012; Gerez et al. 2015). Also, in in vitro studies with porcine and human hepatocytes exposed to different doses of DON (0.1–100 µg/mL), p38 activation initiated the apoptotic response resulting in cas-pase-3 activation (Königs et al. 2008; Mikami et al. 2004).
The negative impact of Fusarium contaminated diets at levels below the EU guidance levels was also observed in young calves during a clinical case at our department [Clinic for Ruminants of the University of Liège (Belgium)] and could be attributed to a non-optimal ruminal development caused by a shortage of roughage. This clinical case, which is described in detail in the next paragraph, together with the fact that studies investigating the role of ruminal develop-ment in the absorption and biodegradation of DON and its acetylated forms in calves are lacking, formed the basis for the current study. Therefore, the aims of this study were (1) to determine the occurrence of mycotoxins in veal feed com-ponents, (2) and to assess the toxicokinetic characteristics and absolute oral bioavailability of DON and its acetylated derivatives (3-ADON and 15-ADON) in ruminating and non-ruminating calves. In addition to DOM-1, major phase II metabolites were studied.
Clinical case report
In January 2015, a large commercial beef crossbred Bel-gian Blue farm (500 calvings/year, births non-seasonalized, bovine viral diarrhea-free status) submitted a case of fatal icterus in a 2-month-old calf (calf 1) to the Clinic for Rumi-nants of the University of Liège (Belgium) for necropsy. Prior to this case, on the same farm one calf with severe icterus died, however, no further examinations were per-formed. In the past, a case of icterus due to a Salmonella Dublin hepatocholecystitis had also been diagnosed on this farm (Ronzoni et al. 2013). Gross pathology revealed gen-eralized icterus, mild bilirubinuria, splenomegaly, and no macroscopic lesions to the liver. Subsequently, a few weeks later another 2-month-old calf (calf 2) was referred to the clinic. On clinical examination the animal was lethargic, and had a normal body temperature, generalized icterus, and mild diarrhea. Blood analysis showed severe ane-mia, leukocytosis, bilirubineane-mia, and increased levels of aspartate aminotransferase (AST), and gamma-glutamyl transferase (GGT) (Supplementary Table 1). The blood lead and copper levels were within the normal range, and the calf tested negative for leptospirosis by serology. The animal was hospitalized and treated symptomatically with fluid therapy [0.9% NaCl intravenously (2 mL/kg/h)] and choleretics (Hepalac™, Savetis, Quevert, France). During hospitalization the animal was fed milk replacer (10% of BW in 5 meals per day) and commercial calf feed concentrate.
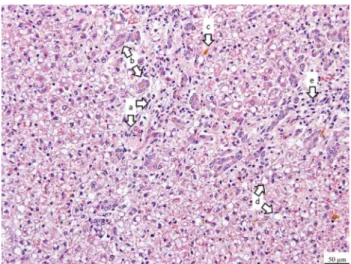
After 4 days the calf recovered and was discharged from the clinic. Finally, a third calf (calf 3) was referred to the clinic. The animal was in poor clinical condition, with a more pronounced chronic liver failure characterized by very high glutamate dehydrogenase (GLDH) blood levels, but no anemia (Supplementary Table 1). Despite supportive symp-tomatic treatment the animal died within a few hours fol-lowing submission to the clinic. Necropsy showed petechia and hemorrhages in the abomasum, congestive mucosae in the distal bowel, white debris in the kidney medulla, dark urine and splenomegaly. Bile bacteriology and leptospirosis PCR on urine was negative. Histopathological examination of the liver revealed a severe degeneration associated with a disruption of the parenchyma, fibrosis, biliary hyperplasia, cholestasis, steatosis, and infiltration of lymphocytes and macrophages, compatible with chronic metabolic disorder (Fig. 1).
Taking into account the fact that only 2- to 3-month-old calves were affected, a nutritional etiology was suspected. On the farm, calves were housed individually and fed milk replacer and commercial calf starter feed concentrate until 1 month of age. No calves with icterus were observed in this age category. Between 1 and 3 months of age, the animals were group-housed, and fed milk replacer and a farm-made feed concentrate, composed of cornmeal, barley flakes, wheat bran pellet, dehydrated beet pulp, tanned soybeans, de-hulled spelt, cacao pods, molasses, minerals, vitamins and trace elements. At farm level four out of 150 calves showed icterus. Animals older than 3 months were group-housed and fed the same farm-made feed concentrate, but no milk replacer, and showed no symptoms. Subsequently, the presence of mycotoxins in the feed was analyzed by a vali-dated multi-mycotoxin liquid chromatography–tandem mass
Fig. 1 Liver histopathology of calf no. 3 (hematoxylin and eosin staining) showing severe degeneration associated with a disruption of the parenchyma, fibrosis (a), biliary hyperplasia (b), cholestasis (c), steatosis (d), and infiltration of lymphocytes and macrophages (e)
spectrometry method (LC–MS/MS) at the national refer-ence laboratory for mycotoxins (CODA-CERVA, Tervuren, Belgium). The different feed commodities were analyzed for the presence of the following mycotoxins: aflatoxin B1 (AFB1), B2 (AFB2), G1 (AFG1), G2 (AFG2) and M1 (AFM1) (only in milk replacer sample), DON, 3-ADON, 15-ADON, fumonisin B1 (FB1), B2 (FB2) and B3 (FB3), ochratoxin A
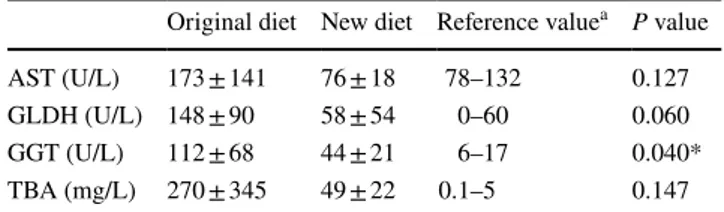
(OTA), T-2 toxin (T-2), HT-2 toxin (HT-2) and ZEN. The cornmeal was highly contaminated with several Fusarium mycotoxins, i.e., 4.27 mg DON, 1.40 mg 15-ADON, 0.05 mg 3-ADON and 0.42 mg ZEN per kg. Furthermore, DON was also found in soybeans (0.68 mg/kg), wheat bran (0.37 mg/ kg), and spelt (0.23 mg/kg). Besides, 15-ADON was also detected in the soybeans (0.15 mg/kg) and a low level of T-2 (0.02 mg/kg) was found in the spelt. The cacao pods were contaminated with 15-ADON (0.22 mg/kg) and OTA (0.004 mg/kg). The final mycotoxin level in the total farm-made feed concentrate was 1.13 mg DON and 0.15 mg ZEN per kg. No mycotoxins were detected in the milk replacer. Consequently, the mycotoxin concentration of the admin-istered diet did not exceed the EU maximum guidance lev-els for DON (2 mg/kg) and ZEN (0.5 mg/kg) (2006/576/ EC), although, clear clinical symptoms of liver failure were observed in calves fed this diet and other causes of liver failure, such as salmonellosis, leptospirosis, and lead and copper intoxication, were excluded. Therefore, to demon-strate the possible role of mycotoxins, blood values of liver enzymes and liver function markers were assessed prior and after a diet change. Blood samples were withdrawn from six different calves of 2- to 3-month-old of two different pens, and different liver enzymes and liver function markers were analyzed (Table 1). Subsequently, the diet of these animals was changed to a new diet. To stimulate ruminal develop-ment roughage, more specifically hay, was introduced into the diet. Besides, the source of corn was changed, since the
original cornmeal made one quarter of the farm-made feed concentrate and was highly contaminated with Fusarium mycotoxins. After 2 weeks, blood levels of liver enzymes and function markers were analyzed again in the same six calves (Table 1). Blood values of liver enzymes and liver function markers differed statistically compared prior and after dietary change, as demonstrated by a paired t test (SPSS 24.0, Chicago, IL, USA). A significant decrease was observed for GGT (P = 0.040).
Materials and methods
Occurrence of mycotoxins in veal feed components
Sample collection
On 15 Flemish veal farms (5 farms specialized in raising Holstein Friesian veal calves, 5 in raising Belgian Blue veal calves and 5 in raising crossbred calves), a total of 45 feed samples were collected. On each farm, samples of the milk replacer, roughage source and feed concentrate were col-lected. The sampled milk replacers, so-called nill product, were composed of a variable percentage of whey powder supplemented with vitamins, minerals, and variable degree of different vegetable protein and energy sources such as soya, pea and wheat. Sampled feed concentrates were com-posed of wheat, corn and barley. The roughage source was either mixed straw [wheat straw in 11 out of 15 farms, mix of wheat and rapeseed straw (2/15) or maize silage (2/15)]. Each time two subsamples of 250 g were taken in three bags (of 20 kg) of the feed concentrate, at two different loca-tions per bag (n = 6). For the roughage source, three bags of mixed straw were sampled at two different locations (n = 6), and maize silage were sampled at three different locations (n = 3). Finally, milk replacer samples were collected at three different moments whilst running out of the silo (n = 3). All samples were kept at < − 15 °C until analysis. Subsequently, the subsamples were thawed and pooled per farm per feed component (milk replacer, roughage and feed concentrate) and analyzed for mycotoxin contamination.
Analysis of milk replacer samples
Chemicals, products and reagents Water was of high-per-formance liquid chromatography (HPLC) grade [generated by a Milli-Q Gradient purification system (Millipore, Biller-ica, MA, USA)]. Methanol (MeOH, ULC–MS), acetonitrile (ACN, LC–MS) and acetic acid (AA, ULC–MS) were sup-plied by Biosolve B.V. (Valkenswaard, The Netherlands).
Analytical standards of AFB1, AFB2, DON, FB1, FB2,
OTA, T-2 and ZEN were purchased from Sigma-Aldrich (Bornem, Belgium). Alternariol (AOH), and alternariol
Table 1 Blood concentrations of liver enzymes and liver function
markers in six 2- to 3-month-old calves fed a Fusarium mycotoxin-contaminated diet (original diet, 1.13 mg DON and 0.15 mg ZEN per kg feed) and 2 weeks after the diet was changed to a new source of corn and the introduction of hay (new diet)
Values are presented as means ± SD
AST aspartate aminotransferase, GLDH glutamate dehydrogenase, GGT gamma-glutamyl transferase, TBA total bile acids
*Significantly different between calves fed the original diet compared to animals fed the new diet
a Smith and Magdesian (2009)
Original diet New diet Reference valuea P value
AST (U/L) 173 ± 141 76 ± 18 78–132 0.127 GLDH (U/L) 148 ± 90 58 ± 54 0–60 0.060 GGT (U/L) 112 ± 68 44 ± 21 6–17 0.040* TBA (mg/L) 270 ± 345 49 ± 22 0.1–5 0.147
monomethyl ether (AME) were obtained from Fermentek (Jerusalem, Israel). 13C
15-DON, 13C17-3-ADON, 13C24-T-2
and 13C
18-ZEN were used as internal standards (ISs) and
obtained from Coring System Diagnostix GmbH (Gern-sheim, Germany). The latter also provided 3-ADON and 15-ADON.
Preparation of standard solutions Stock solutions of AFB1,
AFB2, AOH, AME, DON, 3-ADON, 15-ADON, T-2, and ZEN were prepared in ACN at a concentration of 1 mg/mL and stored at < − 15 °C. MeOH was used to dissolve the standards of FB1, FB2 and OTA (1 mg/mL), and stock solu-tions were also stored at < − 15 °C. Working solusolu-tions were prepared freshly in HPLC-grade water and protected from light.
Milk replacer sample pretreatment Extraction of mycotox-ins from milk replacer was performed by means of a two-fold extraction procedure. Two gram of milk replacer was weighed in a falcon tube protected from light and 15 mL of MeOH were added. After 30 min extraction on a horizon-tal shaker, the sample was centrifuged for 10 min at 4000g and the supernatant was collected in a separate falcon tube, also protected from light. This extraction was repeated using 15 mL of ACN/H2O/AA (79/20/1, v/v) and the supernatant was added to the first one. The total extract was centrifuged for 5 min at 4000g and evaporated to 4 mL in a separate tube. This extract was filtered through a 0.22-µm PVDF fil-ter (Millipore) and stored at 7 °C until analysis.
UPLC–MS/MS conditions The ultra-performance liquid chromatography–tandem mass spectrometry (UPLC–MS/ MS) system consisted of an Acquity™ H-Class chro-matographic system coupled to a Xevo TQ-S® MS/MS
triple quadrupole system, both from Waters (Milford, MA, USA). Chromatographic separation was performed using an Acquity CSH Fluoro-Phenyl column (1.7 µm, 150 × 2.1 mm i.d., waters) column set to 60 °C. The mobile phase consisted of H2O + 0.3% AA (A) and MeOH + 0.3%
AA (B) at a flow-rate of 0.4 mL/min. The gradient was initiated with 0% mobile phase B, immediately increased to 15% B and held at 15% B for 4.5 min and subsequently linearly increased to 60% B. After 7.5 min at 60% B, the gradient was set to 80% B for 4.5 min and re-equilibrated at 0% B prior to the next injection. The mass spectrometer operated at a source and desolvation temperature of 130 °C and 500 °C, respectively. Depending on the compound, the electrospray ionization (ESI) interface operated in negative and positive mode alternately in each run. Mul-tiple reaction monitoring (MRM) was used for measuring two product ions for each mycotoxin (only one product ion for the ISs). Sample tray temperature was set to 7 °C and 5 µL of each sample were injected into the UPLC–MS/MS
system for analysis. Data analysis was performed using the MassLynx software version 4.1 (Waters).
In‑house method validation The developed method was
validated in compliance with the recommendations as defined by the European Community (2002/657/EC) and with reference guidelines defined in other EU, FDA docu-ments and IUPAC guidelines (Heitzman 1994; Thompson et al. 2002; VICH GL 49 2011) for the following param-eters: specificity, linearity (r2), recovery (R), repeatability
(RSDr), reproducibility (RSDR), limit of detection (LOD)
and quantification (LOQ). Matrix-matched calibration plots were constructed for the quantification of the ana-lytes. Evaluating the linearity, the homogeneity of vari-ance was checked before fitting the linear model. The lin-earity was interpreted graphically using a scatter plot. The precision was calculated in terms of the relative standard deviation (RSD). LOD was calculated as three times the standard error of the intercept, divided by the slope of the standard curve; the LOQ was determined in a similar way, differing by six times the standard error. The calculated LOD and LOQ were verified by the signal-to-noise ratio (S/N), which should be more than 3 and 10, respectively, according to the IUPAC guidelines (Thompson et al.
2002).
For all mycotoxins studied, the criteria of linearity and specificity were fulfilled. Average R varied between 85.1 and 108.4% which is within the acceptance criteria for recovery (80–110%) as specified in Commission Decision 2002/657/EC. RSDr and RSDR ranged between 0.4 and
12.5% and between 1.5 and 13.8%, respectively. LOD was calculated as three times the standard error of the inter-cept, divided by the slope of the standard curve; the LOQ was determined in a similar way, differing by six times the standard error. The calculated LOD and LOQ were veri-fied by the signal-to-noise ratio (S/N), which should be more than 3 and 10, respectively, according to the IUPAC guidelines (Thompson et al. 2002). The LOD and LOQ values were within the range of 1–86 µg/kg and 2–171 µg/ kg, respectively (Supplementary Tables 2 and 3).
Analysis of roughage and feed concentrate samples
Sample preparation and LC–MS/MS analysis was per-formed as previously described (Monbaliu et al. 2010). The following mycotoxins were analyzed: AFB1, AFB2,
AFG1 and AFG2, altenuene, AOH, AME, DON, 3-ADON, 15-ADON, diacetoxyscirpenol, enniatin B (ENNB), FB1, FB2, FB3, fusarenon-X, neosolaniol, nivalenol, OTA,
roquefortine-C, sterigmatocystin, T-2, HT-2 and ZEN (Monbaliu et al. 2010).
Toxicokinetic study of DON and its acetylated metabolites
Animal trial
A toxicokinetic study was performed with two fully rumi-nating male calves [Holstein Friesian, 5 months old, mean body weight (BW) of 80 ± 5 kg] and two non-ruminating male calves (Holstein Friesian, 1 month old, 49 ± 3 kg BW). Animals were obtained from a commercial breeder at the age of 2 weeks, and individually housed at the experimental unit of the Faculty of Veterinary Medicine of Ghent Univer-sity until the experiment. Ruminating calves were fed milk replacer complemented with roughage and concentrate feed until the age of 12 weeks. After weaning they were given roughage (hay and straw) and water ad libitum, as well as 1 kg of commercial calf feed concentrate (Kalvermix, Van Huffel, Nevele, Belgium) daily until 1 week before the start of the experiment. During the 1 week acclimatization period prior to the experiment and during the study period rumi-nating calves received only hay and water ad libitum. Non-ruminating calves were fed 2 L of a solution of a commer-cial milk replacer (110 g/L; Vitaspray™, Vitamex, Drongen, Belgium) three times daily from arrival at the test facility until the end of the study period. Mycotoxin contamination of the administered milk replacer, concentrate feed and hay was also analyzed as described under section “Analysis of milk replacer samples” and “Analysis of roughage and feed concentrate samples”. No mycotoxins were detected. Each animal received successively a single bolus of DON (120 µg/ kg BW), or 15-ADON (50 µg/kg BW), or 3-ADON (25 µg/kg BW) by intravenous (IV) injection in the right jugular vein or per os by oesophageal tube (PO) in a crossover design with a 4-day wash-out period between each administration. The administered doses were based on the maximum contamina-tion level of the selected mycotoxins (seccontamina-tion “Occurrence of mycotoxins in veal feed components”) and the average daily feed intake. DON, 15-ADON, and 3-ADON had > 99% purity (Fermentek, Jerusalem, Israel). The mycotoxins were dissolved in analytical grade ethanol (EtOH, Merck, Brus-sels, Belgium), yielding a stock solution of 10 mg/mL. The DON, 15-ADON, or 3-ADON bolus was prepared imme-diately prior to administration by further diluting the stock solution with 0.9% NaCl solution up to a concentration of 1 mg/mL. After oral administration of the toxins, 500 mL of tap water was administered to flush the gavage tube. Animals were deprived of feed 12 h before the administration of the mycotoxin until 12 h post-administration (p.a.). Following mycotoxin bolus administration, blood samples (4 mL) were collected in heparinized tubes from an 18G catheter in the left jugular vein before administration (t = 0), at 5, 15, 30 and 45 min p.a. and at 1, 1.5, 2, 2.5, 3, 4, 6, 8, 10, 12, 24, 36, 48, 72 and 96 h p.a. Blood samples were centrifuged (2851g,
10 min, 4 °C) and plasma was stored at ≤ − 15 °C until further analysis. Urine samples were collected after manual stimulation of the praeputium before administration (t = 0) and at 3, 6, 9, 12, 24, 36, 48, 72 and 96 h p.a., and stored at ≤ − 15 °C until further analysis. The animal experiment was approved by the Ethical Committee of the Faculty of Veteri-nary Medicine and the Faculty of Bioscience Engineering of Ghent University (EC2014/93-approved on 4/09/2014).
Analysis of DON and metabolites in calf plasma
Chemicals, products and reagents The analytical
stand-ards of DON, 3-ADON and 15-ADON were obtained from Fermentek. The standard of DOM-1 was purchased from Sigma-Aldrich (Bornem, Belgium). The IS, 13C
15-DON
was obtained from Romer Labs (Tulln, Austria). The ana-lytical standard of DON-3-glucuronide (DON-3-GlcA) was synthesized as described by Fruhmann et al. (2012). DON-3-sulfate (DON-3-S), DON-15-sulfate (DON-15-S), 3-ADON-15-sulfate (3-ADON-15-S) and 15-ADON-3-sul-fate (15-ADON-3-S) analytical standards were synthesized as described by Fruhmann et al. (2014). All standards were stored at ≤ − 15 °C. All solvents and reagents used for LC–MS/MS analysis (water, MeOH, ACN and ammonium acetate) were of LC–MS grade and obtained from Biosolve (Valkenswaard, The Netherlands), while solvents used for sample preparation (ACN, EtOH) were of analytical grade and obtained from VWR (Leuven, Belgium). Millex®
GV-PVDF filter units (0.22 µm) were obtained from Millipore.
Preparation of standard solutions Stock solutions were pre-pared in EtOH (DON, 3-ADON and 15-ADON at 10 mg/ mL). The standards of DOM-1 and 13C
15-DON were
pur-chased as solutions of 50 and 25 µg/mL in ACN, respec-tively. The standards of 3-GlcA, 3-S, DON-15-S, 3-ADON-15-S and 15-ADON-3-S were dissolved in ACN, yielding a stock solution of 20 µg/mL. The stock solu-tions were stored at ≤ − 15 °C.
Combined standard working solutions of 1.0, 0.1, 0.01 and 0.001 µg/mL of all mycotoxins (except the IS) were prepared by mixing an appropriate aliquot of each stock and/ or working solution, followed by further dilution in MeOH. For the IS, a working solution of 0.1 µg/mL was prepared in MeOH. The working solutions were stored at 2–8 °C.
Plasma sample pretreatment Twenty-five µL of a 0.1 µg/ mL IS working solution was added to 250 µL of plasma sample, followed by a vortex mixing (10 s) step. After the addition of 750 µL of ACN, the samples were vortex mixed for 30 s and centrifuged for 10 min at 8517g and 4 °C. The supernatant was transferred to another tube and evaporated using a gentle stream of nitrogen (N2; ~ 40 °C) till dryness. The dry residue was reconstituted in 250 µL of H2O/MeOH
(95/5, v/v), vortexed for 15 s, passed through a 0.22 µm Millex® GV-PVDF syringe filter and transferred into a
vial. A 10-µL aliquot was injected onto the UPLC–MS/MS instrument.
UPLC–MS/MS conditions UPLC–MS/MS conditions were as previously described in section “Analysis of milk replacer samples”. Chromatographic separation was achieved on an Acquity UPLC® CS Fluoro-Phenyl column (1.7 µm;
150 × 2.1 mm i.d.) in combination with an Acquity Van-guard pre-column of the same type, both from Waters. The mobile phase A consisted of 20 mM ammonium acetate in water, while the mobile phase B was MeOH. The gra-dient was initiated with 1% mobile phase B for 0.5 min (0–0.5 min), subsequently linearly increased to 15% B over 0.5 min (0.5–1.0 min) and held at 15% for 4.5 min (1.0–5.5 min), followed by a linear increase to 60% B over 0.5 min (5.5–6.0 min) and immediately followed by a linear increase to 99% B over 2.5 min (6.0–8.5 min). The column was rinsed at 99% B for 1.5 min (8.5–10.0 min), followed by a linear gradient to the initial conditions (10.0–10.2 min) and a re-equilibration for 4.8 min (10.2–15.0 min) at 1% B prior to the next injection. The flow-rate was 0.4 mL/min. The temperatures of the column oven and autosampler tray were set to 45 °C and 6 °C, respectively.
The UPLC column effluent was interfaced to a Xevo TQ-S® MS/MS system, equipped with an ESI probe
oper-ating in the positive or negative mode (all from Waters). Depending on the compound, the ESI interface operated in negative and positive mode alternately in each run. In combination with the mobile phase (50% A, 50% B, flow-rate: 200 µL/min) instrument parameters were optimized by direct infusion of working solutions of 1.0 µg/mL of each compound (flow-rate: 20 µL/min). The following parameters were used: capillary voltage: 3.0 kV, source offset: 60 V, desolvation temperature: 600 °C, desolvation gas: 800 L/h, cone gas: 150 L/h, nebulizer pressure: 7.0 bar, LM resolution 1 and 2: 2.72 and 2.86, respectively, HM resolution 1 and 2: 14.90 and 15.15, respectively, ion energy 1 and 2: 0.2 and 0.7, respectively, collision gas flow: 0.2 mL/min. MS/MS acquisition was performed in the MRM mode. The MRM transitions that were monitored for DON and metabolites and the IS are shown in Supplementary Table 4.
In‑house method validation Method validation was as previously described in section “Analysis of milk replacer samples”. The following parameters were evaluated for all analytes of interest in calf plasma: linearity between 0.1 and 200 ng/mL; within-run and between-run accuracy and precision at a concentration level of 5.0 and 50.0 ng/ mL; LOQ and LOD, respectively, DON: 0.2 and 0.01 ng/ mL, 3-ADON: 0.1 and 0.015 ng/mL, 15-ADON: 5.0 and 1.74 ng/mL, DON-3-S/DON-15-S: 0.2 and 0.01 ng/mL,
3-ADON-15-S: 0.5 and 0.004 ng/mL, 15-ADON-3-S: 0.2 and 0.006 ng/mL, DOM-1: 0.5 and 0.08 ng/mL,
DON-3-GlcA: 5.0 and 0.612 ng/mL; stability during 3 freeze–thaw cycles, carry-over and specificity. The results are shown in Supplementary Table 5 and fell within the acceptance ranges.
Toxicokinetic analysis Toxicokinetic analysis was
per-formed using a non-compartmental model (WinNonlin 6.3, Pharsight, USA). Plasma levels below LOQ were not included in the analysis. Following major toxicokinetic parameters of DON and 3-ADON following IV administra-tion were calculated: C0, plasma concentration at time = 0 h; AUC 0–t, area under the plasma concentration–time curve
from time 0 h to last sampling point with a plasma concen-tration above LOQ (DON: ruminating calves 8 h and non-ruminating calves 48 h, 3-ADON: non-ruminating calves 2.5 h and non-ruminating 2 h p.a., respectively); AUC 0–∞, area
under the plasma concentration–time curve from time 0 h to infinity; AUCs were calculated using the linear up-log down method; Cl, total body clearance; kel, elimination rate constant; T1/2el, half-life of elimination; Vd, volume of
dis-tribution. Since 15-ADON was only measured following IV administration until 15 min after administration, and even not measured following PO administration, toxicokinetic analysis could not be performed. Additionally, following toxicokinetic parameters of DON after PO administration were calculated: Cmax, maximum plasma concentration,
Tmax, time to maximal plasma concentration, and the abso-lute oral bioavailability (F) of DON according to the for-mula: [F (%) = (AUC 0–t DON PO/AUC 0–t DON IV) × 100]. Since
3-ADON was either not detected or below LOQ in rumi-nating calves, and only traces of 3-ADON were detected in plasma of non-ruminating calves, toxicokinetic analysis could not be performed. Taking into account that per group
n = 2, no statistical analysis has been performed. Analysis of DON and metabolites in calf urine
Chemicals, products and reagents Analytical standards of DON, DOM-1, 3-ADON, 15-ADON and 13C
15-DON (IS)
were obtained from Sigma Aldrich (Bornem, Belgium). The analytical standard of DON-3-GlcA was synthesized as described by Fruhmann et al. (2012) and kindly supplied by Dr. Huybrechts (CODA-CERVA). All standards were stored at ≤ − 15 °C. Water was of HPLC grade (generated by a Milli-Q Gradient purification system (Millipore)). MeOH was of LC–MS grade and obtained from Biosolve, while ACN was of analytical grade and obtained from VWR. Acetic acid (glacial, 100%) and formic acid (98–100%) were obtained from Merck (Darmstadt, Germany). Magne-sium sulphate anhydrous (> 99.5%) was obtained from Alfa
Aesar (Haverhill, Massachusetts, USA). Sodium chloride (> 99.5%) was obtained from VWR.
Preparation of standard solutions Stock solutions were
pre-pared in MeOH (DON, DOM-1, 3-ADON and 15-ADON at 10 µg/mL). The IS 13C
15-DON was purchased as a
solu-tion of 25 µg/mL in ACN. The standard of DON-3-GlcA was delivered as a solution of 1 µg/mL in ACN. Stock solu-tions were stored at ≤ − 15 °C. Working solusolu-tions of 1.0, 0.1, 0.01 and 0.001 µg/mL containing a mixture of standard solutions of all mycotoxins (except the IS) were prepared by mixing an appropriate aliquot of each stock and/or working solution, followed by further dilution. For the IS, a work-ing solution of 0.1 µg/mL was prepared in MeOH. Workwork-ing solutions were stored at 2–8 °C.
Urine sample preparation To 2.0 mL of urine sample 100 µL of a 0.1 µg/mL IS working solution were added, followed by a vortex mixing (10 s) step. Then, 18 mL of ACN/water/formic acid (52/45/3, v/v) were added and sub-sequently, 4 g of anhydrous magnesium sulphate and 1 g of sodium chloride were added. Samples were vigorously shaken by hand, and subsequently placed on an Agita-tor (Agitelec, Paris, France) decanter overhead shaker for 30 min, and centrifuged at 4000g for 6 min. Five mL of the organic phase were evaporated to dryness under a gen-tle nitrogen stream at 40 °C. Finally, the residue was redis-solved in 500 µL of injection solvent (MeOH/water, 10/90, v/v), vortexed for 15 s, passed through a 0.22 µm Millex®
GV-PVDF syringe filter and transferred to a vial. A 10-µL aliquot was injected onto the column.
UPLC–MS/MS conditions UPLC–MS/MS conditions were as previously described in section “Analysis of milk replacer samples”. Data acquisition and processing have been per-formed with MassLynx™ version 4.1 and QuanLynx®
version 4.1 software (Waters). A Waters Acquity UPLC®
HSS T3 (1.8 µm, 100 × 2.1 mm i.d.) column was used. The mobile phase A consisted of H2O/AA (99.9/0.1, v/v) and
the mobile phase B was MeOH/AA (99.9/0.1, v/v). The gradient was initiated with 1% mobile phase B for 0.5 min, subsequently linearly increased to 45% B over 5.5 min, fol-lowed by a linear increase to 99% B over 1.5 min, finally the gradient was set to 1% B for 1.5 min and re-equilibrated at 1% B prior to the next injection. The flow-rate was 0.4 mL/ min. The temperatures of the column oven and autosampler tray were set to 40 °C and 6 °C, respectively.
The Xevo TQ-S® MS/MS system was equipped with
an ESI probe operating in the positive or negative mode. Depending on the compound, the ESI interface operated in negative and positive mode alternately in each run. The following parameters were used: capillary voltage: 3.0 kV, source offset: 60 V, desolvation temperature: 600 °C,
desolvation gas: 500 L/h, cone gas: 50 L/h, nebulizer pres-sure: 9.0 × 10⁻⁶ bar. Two selected MRM transitions with a
specific dwell-time were optimized for each analyte, in order to increase the sensitivity and the selectivity of the mass spectrometric conditions (Supplementary Table 6).
In‑house method validation Method validation was as previously described in section “Analysis of milk replacer samples”. Results of the validation characteristics of the LC–MS/MS method were in compliance with the criteria mentioned in European Commission Decision (2002/657/ EC) (Supplementary Table 7). DON-15-GlcA was only esti-mated using the DON-3-GlcA reference standard whereby the concentration of DON-15-GlcA was corrected for the higher response by a factor of 1.88 (Warth et al. 2012).
Results
Occurrence of mycotoxins in veal feed components About 13% of the milk replacer samples were contaminated with FB1 and FB2, with an average contamination level of 32 ± 7 and 13 ± 1 µg/kg, respectively. None of the other mycotoxins included in the analytical method were found in these milk replacer samples.
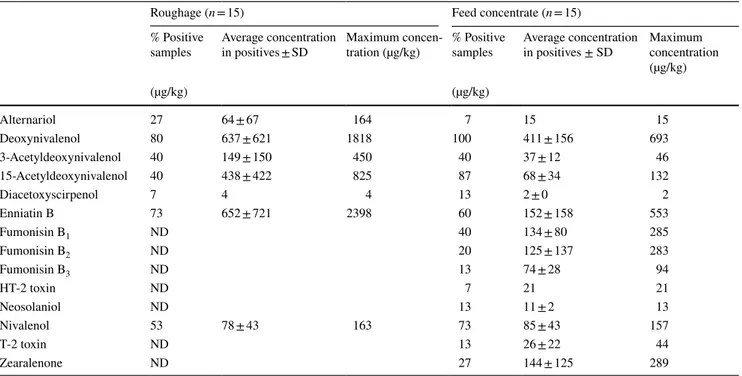
All roughage and feed concentrate samples were contami-nated with at least one mycotoxin, ranging from 1 to 11 dif-ferent mycotoxins (5 on average) in the concentrate mixture samples and 1–6 different mycotoxins (3 on average) in the roughage samples (Table 2). DON was most prevalent, con-taminating 80% of the roughage samples [average concentra-tion in positives on fresh matter basis (FM): 637 ± 621 µg/ kg, max. 1818 µg/kg], and all concentrate mixture samples (411 ± 156 µg/kg (FM), max. 693 µg/kg). Also the DON conjugates 3-ADON and 15-ADON were present in at least 40% of the roughage and feed concentrate samples. Maxi-mum contamination levels of 450 µg/kg and 825 µg/kg for 3-ADON and 15-ADON, respectively, were found in rough-age. However, maximum levels of 3-ADON and 15-ADON in feed concentrate were lower, 46 µg/kg and 132 µg/kg, respectively. Besides, also ENNB was highly prevalent, with high maximum contamination levels of 2398 µg/kg and 553 µg/kg in roughage and feed concentrate samples, respectively.
Toxicokinetic study of DON, 3‑ADON and 15‑ADON No adverse effects were observed during the animal trial fol-lowing PO and IV bolus administration of DON, 3-ADON or 15-ADON.
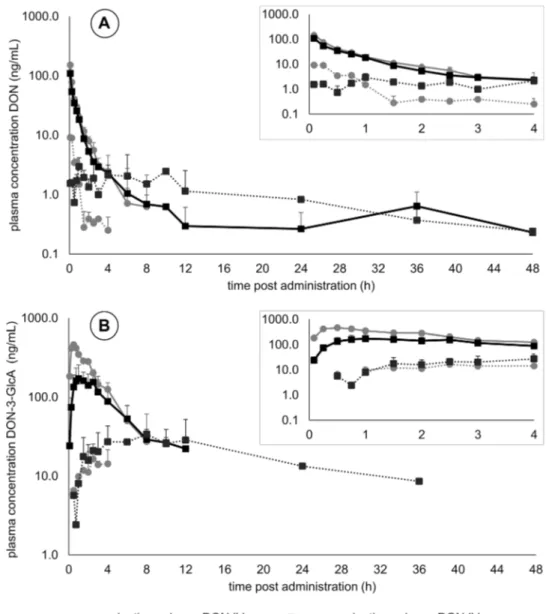
Plasma concentration
Figure 2 shows the plasma concentration–time profile of DON and DON-3-GlcA following IV and PO administra-tion of DON. The major toxicokinetic parameters are shown in Table 3. The absolute oral bioavailability (F) of DON following PO administration was remarkably lower in rumi-nating calves than in the non-rumirumi-nating calves, 4.1 ± 4.5% versus 50.7 ± 33.0%, respectively. Clearance of DON follow-ing IV administration was similar in ruminatfollow-ing and non-ruminating calves, 1.4 ± 0.1 and 1.7 ± 0.1 L/h/kg, respec-tively (Table 3). On the other hand, the Vd was 2.2 ± 0.1 L/kg
and 4.8 ± 1.0 L/kg in ruminating calves and non-ruminating calves, respectively (Table 3). This led to a difference in elimination half-life. Following PO DON administration the
Cmax of 2.97 ± 1.19 ng DON/mL was reached after 1 h (Tmax)
in the non-ruminating calves. In one ruminating calf a Cmax
of 9.18 ng DON/mL was already reached after 0.08 h (Tmax),
while in the other calf only a Cmax of 0.38 ng DON/mL was only reached after 3 h (Tmax) following PO DON
administra-tion. DON was rapidly metabolized to DON-3-GlcA follow-ing oral exposure or IV administration (Fig. 2b). Following IV administration DON was metabolized to DON-3-GlcA in ruminating and non-ruminating calves (Table 4).
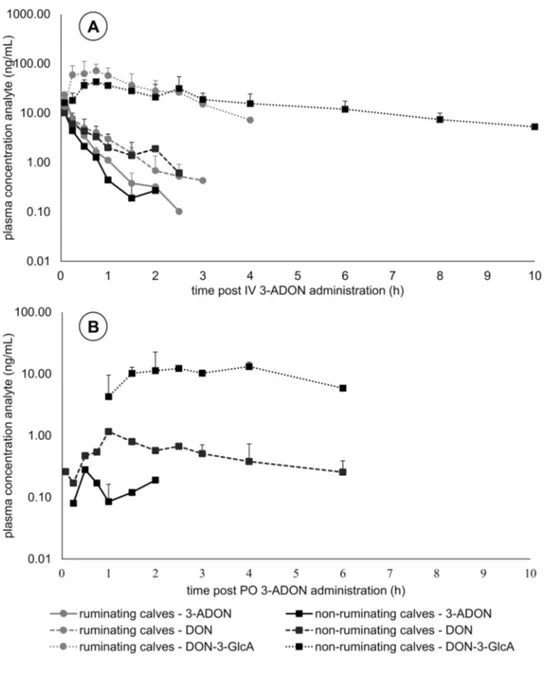
Figure 3 shows the plasma concentration–time profile of 3-ADON, DON and DON-3-GlcA following IV and PO administration of 3-ADON. Plasma levels of 3-ADON,
DON, or DON-3-GlcA following PO 3-ADON adminis-tration were either not detected or below LOQ in ruminat-ing calves, and only traces of 3-ADON were detected in plasma of non-ruminating calves. Immediately following oral exposure or IV administration, 3-ADON was hydro-lyzed to DON and subsequently metabolized to DON-3-GlcA (Fig. 3). Following IV administration of 3-ADON, DON-3-GlcA was longer detected in the plasma compared to DON and 3-ADON (Fig. 3). No further remarkable differ-ences between ruminating and non-ruminating animals were observed for the main toxicokinetic parameters of 3-ADON following IV exposure (Table 3) and the biotransformation to DON-3-GlcA (Table 4).
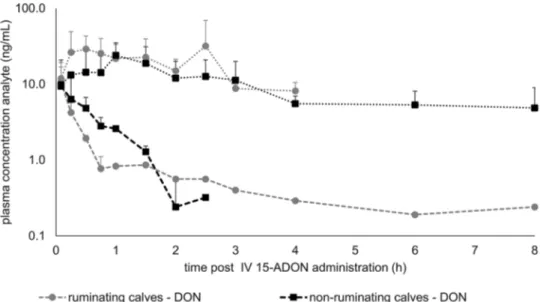
Figure 4 shows the plasma concentration–time profile of DON and DON-3-GlcA following IV administration of 15-ADON. In both groups, plasma levels of 15-ADON above the LOQ were only measured in samples of 5 and 15 min post-IV administration (range 6.31–24.11 ng/mL). Plasma levels of 15-ADON, DON and DON-3-GlcA fol-lowing PO 15-ADON administration were not detected or below LOQ in both types of calves. Similarly to 3-ADON, following IV administration, 15-ADON was rapidly hydro-lyzed to DON and subsequently metabolized to DON-3-GlcA (Fig. 4). Following IV administration of 15-ADON, DON-3-GlcA was longer detected in the plasma compared to DON (Fig. 4). The further biotransformation to DON-3-GlcA was similar in both groups, demonstrated by the
Table 2 Detected mycotoxins in roughage (1 pooled sample/farm) and feed concentrate samples (1 pooled sample/farm), collected on 15 Flem-ish veal farms
Concentrations expressed on fresh matter basis, ND: not detected; SD: standard deviation; fusarenon-X; aflatoxin B1, B2, G1 and G2; alternariol
methyl ether; sterigmatocystin; ochratoxin A and roquefortine C were not detected
Roughage (n = 15) Feed concentrate (n = 15)
% Positive
samples Average concentration in positives ± SD Maximum concen-tration (µg/kg) % Positive samples Average concentration in positives ± SD Maximum concentration (µg/kg) (µg/kg) (µg/kg) Alternariol 27 64 ± 67 164 7 15 15 Deoxynivalenol 80 637 ± 621 1818 100 411 ± 156 693 3-Acetyldeoxynivalenol 40 149 ± 150 450 40 37 ± 12 46 15-Acetyldeoxynivalenol 40 438 ± 422 825 87 68 ± 34 132 Diacetoxyscirpenol 7 4 4 13 2 ± 0 2 Enniatin B 73 652 ± 721 2398 60 152 ± 158 553 Fumonisin B1 ND 40 134 ± 80 285 Fumonisin B2 ND 20 125 ± 137 283 Fumonisin B3 ND 13 74 ± 28 94 HT-2 toxin ND 7 21 21 Neosolaniol ND 13 11 ± 2 13 Nivalenol 53 78 ± 43 163 73 85 ± 43 157 T-2 toxin ND 13 26 ± 22 44 Zearalenone ND 27 144 ± 125 289
AUC 0–t of DON-3-GlcA, 81.9 ± 60.8 and 57.8 ± 25.9 (h ng)/
mL in ruminating and non-ruminating calves, respectively (Table 4). DOM-1, nor DON-sulfates, could not be detected in plasma following IV or PO administration of DON, 3-ADON, or 15-ADON.
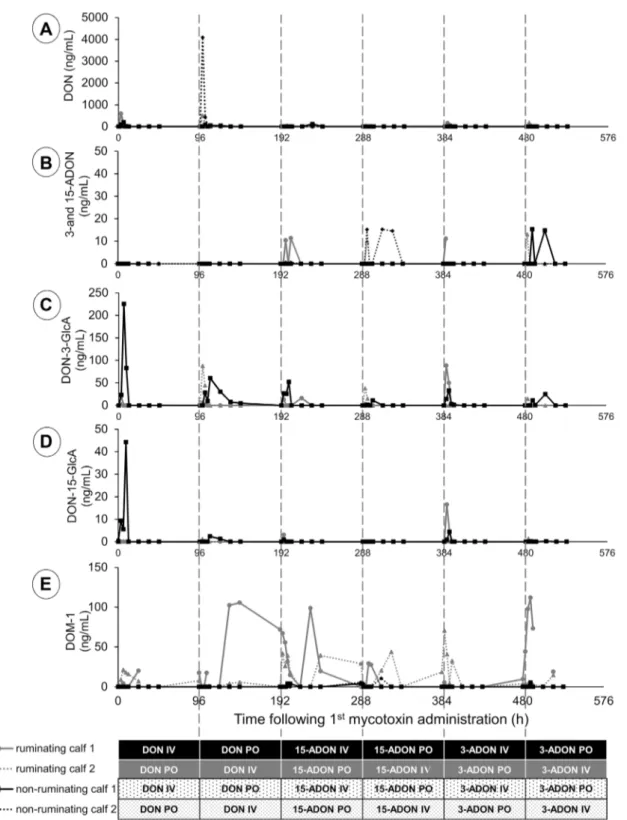
Urine concentration
Figure 5 shows the urine concentration–time profile of DON (A), sum of 3- and 15-ADON (B), 3-GlcA (C), DON-15-GlcA (D), and DOM-1 (E). In both groups, following IV administration of DON, DON was only detected in the urine until 9 h p.a. The maximum urinary concentration of DON following IV DON administration was 547 ± 64 ng/ mL and 2145 ± 2756 ng/mL, in ruminating and non-rumi-nating calves, respectively (Fig. 5a). Remarkably, no urinary DON was detected in ruminating calves following oral DON
administration. In contrast, low levels of DON were dem-onstrated in the urine of non-ruminating calves following DON PO. Following IV or PO administration of 3-ADON and 15-ADON low concentrations of ADONs were found in both groups, ranging from 0.5 to 15 ng/mL (Fig. 5b).
Non-ruminating 1-month-old calves were characterized by a higher urinary level of DON-3-GlcA compared to rumi-nating 5-month-old calves following IV administration of DON (195 ± 42 ng/mL versus 54 ± 48 ng/mL), 15-ADON (30 ± 31 ng/mL versus 27 ± 16 ng/mL), or 3-ADON (6 ± 8 ng/mL versus not detected) (Fig. 5c). The estimated urinary concentration of DON-15-GlcA was low in both groups (Fig. 5d).
In contrast to DON-3-GlcA, only traces of DOM-1 were detected in non-ruminating calves following IV or PO administration of DON, 15-ADON or 3-ADON, while higher levels were observed in ruminating calves (Fig. 5e).
Fig. 2 Plasma concentration– time profile of a deoxynivale-nol (DON) and b its phase II metabolite, deoxynivalenol-3-glucuronide (DON-3-GlcA) after intravenous (IV) and oral (PO) administration of 120 µg DON/kg bodyweight to two ruminating calves and two non-ruminating calves. The inserts emphasize the plasma concen-tration–time profiles of the first 4 h following administration. Values are presented as means of n = 2 + SD
For example, maximum urinary level of DOM-1 follow-ing DON PO administration was 160 ± 67 ng/mL in rumi-nating calves, while in non-rumirumi-nating calves only in one sample DOM-1 was detected (1 ng/mL). Urinary levels of
DOM-1 were still low following the first IV or PO bolus administration of DON in ruminating calves, however, an increased level was observed following the next PO admin-istration (ruminating calf 1: DON PO and ruminating calf 2: 15-ADON PO) (Fig. 5e). The period of urinary elimination of DOM-1 following consecutive single bolus administra-tion of DON, 15-ADON, and 3-ADON was longer than the foreseen wash-out period of 4 days.
Discussion
In calves, feeding a low roughage to feed concentrate ratio, is characterized by an association between ruminal devel-opment and the systemic exposure to the mycotoxin DON. Although a higher solid feed provision will increase the ani-mal’s exposure to mycotoxins, non-optimal ruminal develop-ment caused by a shortage of roughage predisposes for DON intoxication in calves.
Intensive feeding regimes, which are used in the special-ized modern veal and beef industry in order to maximize production efficiency, are associated with poor ruminal development. The limited amount of solid feed with a low roughage-to-feed concentrate ratio and the resulting insuf-ficient structure in the diet limits natural rumination, which might lead to frustration, initiating stereotype behavior, such as tongue playing, cross-sucking, sucking on the feed trough and coat licking (Leruste et al. 2014; Mattiello et al. 2002; Webb et al. 2015). Therefore, a minimum daily uptake of solid feed of 250 g starting from the age of 8 weeks is com-pulsory (97/2/EC 1997), in order to improve animal wel-fare and gastro-intestinal health (Pardon et al. 2014; Webb et al. 2015). However, this small amount of solid feed does not guarantee complete ruminal development (Webb et al.
2015). Calves in specialized modern veal and beef industry are still fed intensively with milk replacer and cereals for 4–6 months, with only limited intake of roughage. Taking into account that all solid feed samples (roughage and concen-trate feed) in this study were contaminated with at least one mycotoxin, and mycotoxin contamination of milk replacer was very low, the introduction of a minimal daily amount of solid feed increased the animal’s exposure to mycotoxins.
Concentrate feed and roughage are both important sources of mycotoxins in the calf diet. In this study, all concentrate feed and roughage samples were contaminated with at least one mycotoxin. However, on average five different mycotox-ins were detected. Co-occurrence of different mycotoxmycotox-ins in feed and feed raw materials can be explained by at least three reasons: most fungi are able to produce several mycotoxins concurrently, feed commodities can be contaminated by sev-eral fungi simultaneously or in quick succession, and animal diets are usually made up of multiple commodities (Smith et al. 2016). Roughage samples were mainly contaminated
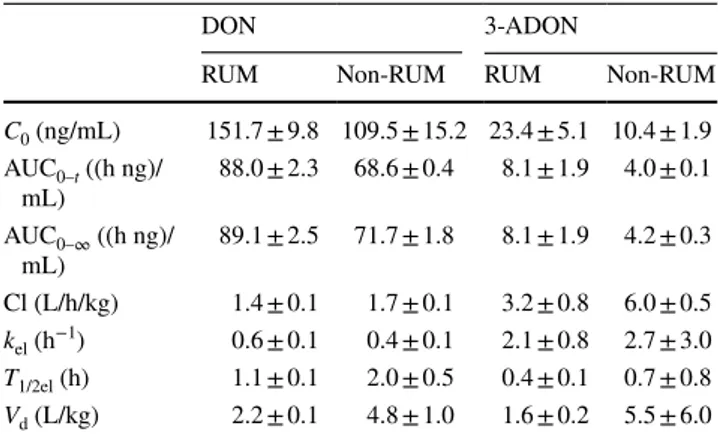
Table 3 Main toxicokinetic parameters of deoxynivalenol (DON) and 3-acetyl-deoxynivalenol (3-ADON) following intravenous (IV) administration of 120 µg DON/kg BW or 25 µg 3-ADON/kg BW, respectively, to ruminating (RUM, n = 2) and non-ruminating (non-RUM, n = 2) calves
Values are presented as means ± SD
C0, plasma concentration at time = 0 h; AUC 0–t, area under the plasma
concentration–time curve from time 0 h to last sampling point with a plasma concentration above LOQ (DON: RUM 8 h and non-RUM 48 h, 3-ADON: RUM 2.5 h and non-RUM 2 h post-administration, respectively); AUC 0–∞, area under the plasma concentration–time
curve from time 0 h to infinity; Cl, total body clearance; kel,
elimina-tion rate constant; T1/2el, half-life of elimination; Vd, volume of
distri-bution
DON 3-ADON
RUM Non-RUM RUM Non-RUM
C0 (ng/mL) 151.7 ± 9.8 109.5 ± 15.2 23.4 ± 5.1 10.4 ± 1.9 AUC 0–t ((h ng)/ mL) 88.0 ± 2.3 68.6 ± 0.4 8.1 ± 1.9 4.0 ± 0.1 AUC 0–∞ ((h ng)/ mL) 89.1 ± 2.5 71.7 ± 1.8 8.1 ± 1.9 4.2 ± 0.3 Cl (L/h/kg) 1.4 ± 0.1 1.7 ± 0.1 3.2 ± 0.8 6.0 ± 0.5 kel (h−1) 0.6 ± 0.1 0.4 ± 0.1 2.1 ± 0.8 2.7 ± 3.0 T1/2el (h) 1.1 ± 0.1 2.0 ± 0.5 0.4 ± 0.1 0.7 ± 0.8 Vd (L/kg) 2.2 ± 0.1 4.8 ± 1.0 1.6 ± 0.2 5.5 ± 6.0
Table 4 Area under the plasma concentration–time curve (AUC 0–t)
(h ng)/mL of deoxynivalenol (DON) and deoxynivalenol-3-glucuron-ide (DON-3-GlcA) following intravenous (IV) and oral (PO) adminis-tration of DON (120 µg/kg BW), 3-acetyl-deoxynivalenol (3-ADON) (25 µg/kg BW), or 15-acetyl-deoxynivalenol (15-ADON) (50 µg/kg BW) to ruminating (RUM, n = 2) and non-ruminating (non-RUM, n = 2) calves
Values are presented as means ± SD
ND, plasma levels of DON and DON-3-GlcA were not detected or below LOQ
Toxin (route of adminis-tration)
DON DON-3-GlcA
RUM Non-RUM RUM Non-RUM
DON (IV) 88.0 ± 2.3 68.6 ± 0.4 1343.2 ± 166.1 822.7 ± 373.9 DON (PO) 3.6 ± 4.0 34.9 ± 22.8 91.0 ± 33.1 588.1 ± 308.8 3-ADON (IV) 8.6 ± 1.8 6.4 ± 5.5 122.8 ± 77.4 158.4 ± 66.7 3-ADON (PO) ND 3.4 ± 1.1 ND 66.7 ± 5.5 15-ADON (IV) 3.2 ± 0.4 1.2 ± 0.4 81.9 ± 60.8 57.8 ± 25.9 15-ADON (PO) ND ND ND ND
with DON, ADONs and enniatins. The maximum observed concentrations of these mycotoxins were higher in roughage than in concentrate feed. Recently, Ji et al. (2015) observed in case of Fusarium head blight the highest DON contamina-tion levels in glumes, intermediate in straw, and the lowest in the grain. In contrast to other reports (Driehuis et al. 2008; Gallo et al. 2015), no zearalenone, fumonisins or aflatoxins were detected in the straw or maize silage samples in this study.
Roughage provision decreased the absolute oral bio-availability of DON by a factor 12. The observed absolute oral bioavailability of 4.1% in ruminating calves is similar as described in sheep (5.9–9.9%) (Prelusky et al. 1985). The higher oral bioavailability of 50.7% detected in non-ruminating calves is similar as in pigs (54–100%) (Broe-kaert et al. 2015b; Goyarts and Dänicke 2006), which is the
most sensitive animal species for the toxic effects of DON, and results in a higher systemic exposure to the toxin. Fur-thermore, the lower Vd of DON and 3-ADON following IV administration in ruminating calves compared to non-ruminating calves could be related to age-dependent differ-ences in plasma protein concentration and binding capacity (Gasthuys et al. 2016). Feeding 5-week-old piglets a DON-contaminated diet (1.5 mg/kg feed) for 4 weeks induced disorganization of hepatic cords, cytoplasmatic vacuoliza-tion of hepatocytes and megalocytosis (Gerez et al. 2015). Accordingly, in the presented clinical case report a shortage of roughage induced liver failure in calves fed a mycotoxin-contaminated diet.
Following IV administration a fraction of 3-ADON and 15-ADON was hydrolysed to DON. However, the presence of ADONs in the urine demonstrates an incomplete systemic
Fig. 3 Plasma concentra-tion–time profile of 3-acetyl-deoxynivalenol (3-ADON), deoxynivalenol (DON) and deoxynivalenol-3-glucuro-nide (DON-3-GlcA) after a intravenous (IV) and b oral (PO) administration of 25 µg 3-ADON/kg bodyweight to two ruminating calves and two non-ruminating calves. Plasma levels of 3-ADON, DON, or DON-3-GlcA following PO 3-ADON administration were not detected or below LOQ in ruminating calves. Values are presented as means of n = 2 + SD
hydrolysis to DON. Besides, the ADONs can be hydrolyzed pre-systemically to DON by the intestinal microbiota (Broe-kaert et al. 2015b; Eriksen et al. 2003). Consequently, the absorbed fraction of ADONs following oral exposure may be characterized by a combination of absorption as DON and as ADON. Following PO administration of 3-ADON, only low plasma levels of DON were detected in non-ruminating calves. Taking into account the low number of animals in this study, and the very low oral absorption of 3-ADON in ruminating calves, a difference in the pre-systemic hydroly-sis of 3-ADON and 15-ADON between ruminating and non-ruminating calves could not be investigated. Further research should be performed using more calves and administering a higher oral dose of 3- and 15-ADON. The administered dos-ages of DON, 3-ADON, and 15-ADON in this study were based on the maximum contamination levels of the selected mycotoxins in the survey and the average daily feed intake. Taking into account the in vitro demonstrated toxicity of 3- and 15-ADON on porcine epithelial cells (Broekaert et al.
2015b), and the hydrolysis of 3-ADON to the more toxic DON, toxicological importance of this acetylated form may not be underestimated.
The diagnosis of mycotoxicosis in clinical cases is mostly challenging. Liver failure is an uncommon clinical condition in calves, and can be associated with infectious diseases such as colibacillosis and salmonellosis, or intoxications such as heavy metal poisoning, seneciosis, and mycotoxins (Casteel et al. 1995; Craig et al. 1991; Ronzoni et al. 2013; Van Bost et al. 2001). In order to evaluate liver function in calves, it is very important to have established reference values for functional biomarkers. Traditionally, liver enzymes and liver function markers such as GLDH, GGT, AST, total biliary acids (TBA), and conjugated bilirubin, in combination with histology are used in diagnosing the cause of liver failure
(Smith and Magdesian 2009). In the presented clinical case report, a higher blood GGT level was observed in calves fed the Fusarium mycotoxin-contaminated diet. Definitive diag-nosis should be based on the identification and quantification of the specific mycotoxin(s) in feed ingredients and finished feed. It is well known that so-called ‘hot spots’ in silages are responsible for an uneven distribution and non-proportional spread of mycotoxins in feed, highlighting the importance of representative sample collection and evaluation of myco-toxin exposure in animals. Recently, parent mycomyco-toxins or their metabolites in biological samples such as plasma or urine have been proposed as biomarkers for exposure, and are indeed informative about the exposure of the animal on an individual level (Fruhmann et al. 2012; Warth et al. 2012; Winkler et al. 2014). A sensitive and specific UPLC–MS/ MS method was therefore developed to quantify DON and its metabolites in calf plasma and urine. DON and its acetylated forms were biotransformed by glucuronidation to DON-3-GlcA as major GlcA metabolite in plasma and urine. In contrast to Schwartz-Zimmermann et al. (2017), DON-15-GlcA was also demonstrated in the urine, although at low levels. Recently, Schwartz-Zimmermann et al. (2017) also described the presence of a minor metabolite iso-DON-3-GlcA in cow urine; however, this metabolite was not included in this study.
In addition to hepatic glucuronidation, DON can also be metabolized by intestinal microbiota, with DOM-1 as most important microbial metabolite of DON (Fuchs et al.
2002). Microorganisms from rumen fluid could have both deacetylation and de-epoxidation functions, transforming ADONs to DON and DOM-1 (King et al. 1984). How-ever, DOM-1 could not be detected in plasma in this study. Similarly, following a single IV (0.5 mg/kg) or PO (5 mg/ kg) administration of DON to sheep, only a minor portion
Fig. 4 Plasma concentration– time profile of deoxynivalenol (DON) and deoxynivalenol-3-glucuronide (DON-3-GlcA) after intravenous (IV) adminis-tration of 50 µg 15-ADON/kg bodyweight to two ruminating calves and two non-ruminating calves. Values are presented as means of n = 2 + SD. Plasma levels of 15-ADON above the LOQ were only measured in samples of 5 and 15 min post-IV administration
Fig. 5 Urine concentration–time profile of deoxynivalenol (DON), sum of acetylated derivatives (3- and 15-ADON), deoxynivalenol-3-glucuronide (DON-3-GlcA), deoxynivalenol-15-glucuronide (DON-15-GlcA), and deepoxy-deoxynivalenol (DOM-1) after con-secutive administration of a single bolus of DON (120 µg/kg BW), 15-ADON (50 µg/kg BW), and 3-ADON (25 µg/kg BW) intrave-nously and orally to two ruminating calves and two non-ruminating
calves in a cross-over design, with a 96-h wash-out period between each administration. For example, ruminating calf 1 was given first DON IV, 96 h later the animal was administered DON PO, and sub-sequently each time with 96 h interval, 15-ADON IV, 15-ADON PO, 3-ADON IV, and 3-ADON PO, respectively. Profiles are presented per individual animal
(2.0% and 0.3%, respectively) of the dose was detected as DOM-1 in the plasma (Prelusky et al. 1985). In dairy cows fed a DON-contaminated diet for several weeks it was dem-onstrated that mainly DOM-1 was found in the proximal duodenum. Despite this high de-epoxidation degree, only 4–77% of DON-intake was recovered DON or DOM-1 in the duodenum (Dänicke et al. 2005; Seeling et al. 2006). This incomplete recovery of ingested DON at the duodenum suggests either absorption of DON and/or DOM-1 across the rumen epithelia and/or a complete degradation by rumen microbes. In this study it is suggested that roughage provi-sion stimulate the intestinal microbial DON de-epoxidation capacity by the detection of only traces of DOM-1 in the urine of non-ruminating calves while much higher levels were observed in ruminating calves following IV or PO administration of DON or its ADONs. In addition to DOM-1, also GlcA metabolites of DOM-1 such as DOM-3-GlcA, iso-DOM-3-GlcA, and DOM-15-GlcA have been observed in cow urine samples (Schwartz-Zimmermann et al. 2017). Consequently, the low systemic DON bioavailability meas-ured in sheep (Prelusky et al. 1985) and in ruminating calves in this study might be associated with significant total rumen degradation.
Taking into account the impact of roughage provision on the intestinal microbial de-epoxidation capacity, this study clearly indicates that plasma and urinary DOM-1 lev-els are not suited as biomarker in calves. The longer detec-tion of DON-3-GlcA in plasma compared to DON, 3- and 15-ADON, might suggest the direct quantification of DON-3-GlcA in calf plasma and/or urine as potential biomarker for exposure to DON. In humans, total urinary DON (sum of free DON and DON-GlcA) was validated as a biomarker of exposure with an average urinary excretion rate of 72% (Turner et al. 2010). Similarly, Van Limbergen et al. (2017) demonstrated that plasma DON-GlcA concentration is a good biomarker for DON exposure in sows.
In conclusion, a normal functioning rumen is capable of detoxifying DON, making ruminants less sensitive for these toxins (Dänicke et al. 2005). This was also demonstrated in this toxicokinetic study, where remarkable differences in the absolute oral bioavailability of DON were observed between ruminating and non-ruminating calves. However, in veal and beef calves on a low-fiber diet, rumen development is rudimentary, potentially making them more sensitive to mycotoxins. A multi-mycotoxin contamination of veal feed samples was demonstrated, especially in roughage and feed concentrate. DON was most prevalent, contaminating 80% of the roughage samples and all of the feed concentrate sam-ples. Although, DON occurrence in calf feed will not affect food safety, mycotoxin contamination negatively affects ani-mal health, demonstrated by a clinical case of liver failure on a beef farm. A clear link between ruminal development asso-ciated with roughage provision and the intestinal absorption
of DON was demonstrated. Furthermore, calves are simulta-neously exposed to DON and its acetylated forms. This study demonstrates that the latter are in vivo hydrolysed to DON. The European Union maximum guidance levels suggest that complete feed that does not exceed 2 mg DON/kg can be considered as safe for calves younger than 4 months of age, while 5 mg/kg applies for adult ruminants (2006/576/EC
2006). However, considering the above-mentioned results, also the acetylated forms should be taken into account. Furthermore, guidance levels should take into account the importance of ruminal development and solid feed provi-sion, rather than only differentiate by age.
Acknowledgements The technical assistance of J. Muyle, F. Moons, C. Detavernier and E. Heyndrickx was gratefully appreciated. G. Antonis-sen was supported by a postdoctoral fellowships from Biomin Hold-ing GmbH (Getzersdorf, Austria) and Research Foundation-Flanders (12V6418N). The production of analytical standards of DON-3-GlcA and DON-sulfates was supported by B. Warth and funded by the Vienna Science and Technology Fund (WWTF LS12-021) and the Austrian Science fund (FWF, SFB Fusarium, F3702).
Compliance with ethical standards
Ethical approval All applicable international, national, and/or insti-tutional guidelines for the care and use of animals were followed. All procedures performed in studies involving animals were in accordance with the ethical standards of the Ethical Committee of the Faculty of Veterinary Medicine and the Faculty of Bioscience Engineering of Ghent University (EC2014/93).
References
Antonissen G, Martel A, Pasmans F, Ducatelle R, Verbrugghe E, Van-denbroucke V, Li SJ, Haesebrouck F, Van Immerseel F, Croubels S (2014) The impact of Fusarium mycotoxins on human and ani-mal host susceptibility to infectious diseases. Toxins 6:430–452 Antonissen G, Van Immerseel F, Pasmans F, Ducatelle R, Janssens
GPJ, De Baere S, Mountzouris KC, Su S, Wong EA, De Meu-lenaer B, Verlinden M, Devreese M, Haesebrouck F, Novak B, Dohnal B, Martel A, Croubels S (2015) The mycotoxins deoxyni-valenol and fumonisins alter the extrinsic component of intestinal barrier in broiler chickens. J Agric Food Chem 63:10846–10855 Bennett JW, Klich M (2003) Mycotoxins. Clin Microbiol Rev
16:497–516
Berends H, Van den Borne J, Mollenhorst H, Van Reenen C, Bokkers E, Gerrits W (2014) Utilization of roughages and concentrates relative to that of milk replacer increases strongly with age in veal calves. J Dairy Sci 97:6475–6484
Berthiller F, Crews C, Dall’Asta C, De Saeger S, Haesaert G, Karlovsky P, Oswald IP, Seefelder W, Speijers G, Stroka J (2013) Masked mycotoxins: a review. Mol Nutr Food Res 57:165–186
Bottalico A (1998) Fusarium diseases of cereals: species complex and related mycotoxin profiles, in Europe. J Plant Pathol 80:85–103 Bouhet S, Oswald IP (2005) The effects of mycotoxins, fungal food
contaminants, on the intestinal epithelial cell-derived innate immune response. Vet Immunol Immunop 108:199–209 Bracarense APFL, Lucioli J, Grenier B, Pacheco GD, Moll W-D,