Effect of crop season on the quality and composition of
extra virgin olive oils from Greek and Spanish varieties
grown in the Oriental region of Morocco
Farid Mansouri1,*, Abdessamad Ben moumen1, Kamal Belhaj1, Gaëtan Richard2, Marie-Laure Fauconnier2,
Marianne Sindic3, Hana Serghini Caid1, Ahmed Elamrani1
1Laboratory of Plants and Microorganisms Biology, Faculté des Sciences Oujda, Université Mohammed Premier, BP-717, 60000 Oujda,
Morocco, 2General and Organic Chemistry Unit, Gembloux Agro-Bio Tech, Université de Liège, Passage des Déportés 2, 5030 Gembloux,
Belgium, 3Analysis Quality and Risk Unit, Laboratory of Food Quality and Safety, Gembloux Agro-Bio Tech, Université de Liège, Passage des
Déportés 2, 5030 Gembloux, Belgium
*Corresponding author:
Farid Mansouri, Laboratory of Plants and Microorganisms Biology, Faculté des Sciences Oujda, Université Mohammed Premier, BP-717, 60000 Oujda, Morocco. Mobile: +212 664 469 076 Fax: +212 536 500 603 E-mail: f.mansouri@ump.ac.ma.
Received: 14 March 2018; Accepted: 21 June 2018
INTRODUCTION
Extra virgin olive oil (EVOO) is particularly appreciated for its unique nutritional composition and its good stability compared to other vegetable oils. The benefits of virgin olive oil on human health were associated primarily with its specific fatty acid composition, low saturated fatty acids content and high unsaturated fatty acids proportion, and its high natural antioxidants’ content (Owen et al., 2000). The high mediatization of its health benefits has increased its consumption. In fact, world consumption of olive oil has doubled in the last 25 years, from 1,666 in 1990 to 2,916 (1000 tones) in 2015 (IOC, 2016).
In Morocco, the olive tree has become a more modern and even more important crop. Currently, Morocco is the world’s fourth largest exporter and producer of olive oil after the
European Union, Tunisia and Turkey (IOC, 2016). The Moroccan olive sector has seen the introduction of new varieties in super-high-density planting system in order to industrialize the new orchards as much as possible with the establishment of modern milling units. Among the olive cultivars adapted to intensive cultivation, three have recently been introduced in Morocco; one of Greek origin: Koroneiki and two of Spanish origin: Arbequina and Arbosana. This planting system was developed with the aim of ensuring an early entry into production, to stabilize the yield (8 to 10 tones/Ha/year), mechanize all operations and minimize harvesting costs (Camposeo et al., 2008; Camposeo and Godini, 2010). This new olive plantation method is therefore intended to reduce production costs and increase production. The valorization and improvement of olive oil requires the study of its quality and its chemical composition. The
This study aims to evaluate the variations in the quality and composition of extra virgin olive oils of Spanish (Arbequina, Arbosana) and Greek (Koroneiki) varieties produced over two crop seasons in the Oriental region of Morocco, taking into consideration the influence of climatic conditions. To this end, serval parameters were evaluated, such as quality indices, fatty acids, triacylglycerols, minor compounds (phytosterols, phenolic compounds, tocopherols and pigments) and oxidative stability. The results obtained in this study indicate that the majority of the studied parameters, with the exception of phytosterols, are influenced by climatic conditions of the crop season (p < 0.05). Additionally, the majority of the studied parameters were also influenced by the cultivar factor (p < 0.05). However, the studied varieties produce an excellent oil quality with a chemical composition respecting the requirements recommended by the International Olive Council. The main variations observed on the analyzed olive oils between the two crop seasons are those of antioxidant parameters, such as phenols and oxidative stability. Triacylglycerols and fatty acids are also influenced by the crop season’s climatic conditions. Nonetheless, the behavior of the studied varieties towards climatic conditions is different.
Keywords: Crop season; Extra virgin olive oil; Fatty acid composition; Oxidative stability; Phenolic compounds
A B S T R A C T
http://www.ejfa.me/
quantitative and qualitative chemical composition of EVOO is affected by many factors such as agronomical and technical factors. They mainly include the genetic factor, pedoclimatic factors related to geographical area, maturation degree, irrigation, crop season and processing methods (Romero et al., 2003; Morelló et al., 2004; Tura et al., 2007; Mansouri et al., 2015). The influence of climatic variations on the olive oil composition is considerable. This factor is a critical variable that could influence and change the composition of olive oil from one crop season to another. Additionally, several works have shown that rainfall and temperature, especially during olive growth and maturation, are the most important environmental factors that can affect oil composition (Romero et al., 2003; Morelló et al., 2006; Agiomyrgianaki et al., 2012). Therefore, the evaluation of the effect of seasonal conditions of the Angad plain on the quality and composition of EVOOs of Arbequina, Arbosana and Koroneiki varieties, introduced in a new environment, may be of particular interest to the producer. The climate of this zone, which is located in the northern part of the Oriental region of Morocco, is characterized by cold winters and long hot and dry summer seasons. Despite the proximity of the Mediterranean Sea, the thermal differences, between winter and summer, distinguish this region from other regions that are characterized by temperate climates. In addition, the rainfall in this area varies from one year to another, but generally with limited and irregular rainfall, hence, the need for irrigation.
This work aims to evaluate the variations in the quality and composition of extra virgin olive oils from Greek (Koroneiki) and Spanish (Arbequina, Arbosana) varieties cultivated in north-eastern Morocco over two crop seasons by taking into consideration the cultivar factor and the influence of climatic conditions in order to gain knowledge about quantitative and qualitative profiles of
the oils of these cultivars obtained by the same extraction process.
MATERIALS AND METHODS
Olive oils samplingSamples of olive oils are taken from three cultivars grown in north-eastern Morocco: Koroneiki as a Greek variety; Arbosana and Arbequina as Spanish varieties. These three cultivars have been planted since 2007 (total olive growing area: 60 Ha) in a private area (Société Huiles d’Olive de la Méditerranée-Oujda) located in the plain of Angad (Longitude: 001°57’W, Latitude: 34°47’N and Altitude: 458 m) in north-eastern of Morocco in the same pedoclimatic conditions. The plantations of these varieties (99960 plants) are conducted under irrigated super-high-density planting system with a super-high-density of 1666 trees/Ha and the distances between trees are 1.5m/4m. The trees were irrigated using drip irrigation system at a depth of 25 cm. The period of irrigation was the same for all three cultivars, from January to September with a daily flow of 1.2 L h-1 during 9 hours. The fertilization treatments in the
irrigated system consisted of providing the plantations a contribution of 40-30-50 U Ha−1 of N-P-K.
Samples of olive oils were obtained in two successive crop seasons (2012/2013 and 2013/2014). The climatic data summarized in Table 1 (accumulated rainfall and min and max temperatures) of the Angad plain were measured daily for two years (2012 and 2013). These data were obtained by the station of the National Directorate of Meteorology (Direction de la Météorologie Régionale, Région Nord-Est) at Oujda-Angad Airport (Longitude: 001°56’W, Latitude: 34°47’N and Altitude: 463 m), Morocco. For each season, three samples were taken from each variety,
Table 1: Monthly precipitation and temperature during 2012 and 2013 in north-eastern Morocco (Latitude: 34° 47’N, Longitude: 001° 57’W, Altitude: 458 m)
Month Average temperature (°C) Accumulated
rainfall (mm)
Min Max Mean 2012 2013
2012 2013 2012 2013 2012 2013 January 0 0.2 21.9 24.6 11.0 12.4 9.5 56.8 February ‑2.1 ‑1.6 22 23.3 10.0 10.9 27.9 31.6 March 0.7 -0.4 30.5 26.2 15.6 12.9 21.1 38.1 April 3.8 3.7 31.4 30.8 17.6 17.3 16 14 May 5.3 4.9 37.2 34.3 21.3 19.6 2 28.4 June 12.8 9.4 41.9 39.2 27.4 24.3 2.2 0.1 July 16.7 14.9 40.7 38.2 28.7 26.6 0 2.2 August 18.1 15.9 45.5 43.7 31.8 29.8 3.9 11.2 September 12.5 14.3 40.9 38.3 26.7 26.3 19.7 15.7 October 8.2 7.1 34.1 37.2 21.2 22.2 44 0 November 5.6 0.4 30.5 28.6 18.1 14.5 111.2 29.5 December 0 0.9 27.2 20.5 13.6 10.7 5.1 62
each covering ten trees. The olives were harvested between November 26 and November 29 with a maturity index of 3.8-4.0 according to the method developed by the Agronomic Station of Jaén (Uceda and Hermoso, 1998). The mechanically harvested olives by a straddle harvester were immediately milled by a Pieralisi industrial system (Molinova serie ORO, Pieralisi Maip SPA, Jesi (Ancona), Italy) consisting of four main steps: crushing, kneading, liquid/solid separation and liquid/liquid separation. After deleafing, cleaning and washing, the olives were crushed by a hammer crusher (FP HP 15 INOX). The obtained paste was mixed for 30 min at 27±1°C using a malaxing module (MOD 800) and then centrifuged using a centrifugal extractor (SPI 222S). Thereafter, the oil was separated using a vertical centrifuge (Valente). The olive oil samples were then stored in dark glass bottles without headspace in the dark at 4 °C prior to analysis.
Acidity, peroxide value and UV indices determinations Acidity, peroxide value and ultraviolet indices of the oil samples were determined according to the analytical methods (EEC/2568/91) described in the European Commission regulations (EEC, 1991).
Fatty acid analysis
The fatty acids were analyzed after conversion into methyl esters obtained by transesterification of triacylglycerols according to the method described by Ben Moumen et al. (2015a). Methyl esters of the fatty acids are separated, identified and quantified by gas chromatography (HP 6890 series GC system) equipped with a capillary column (Supelco, Bellefonte, PA, USA) Omega wax (length: 30 m, internal diameter: 0.25 mm, film thickness: 0.25 μm) and coupled to a flame ionization detector (FID). The used carrier gas was helium (99.999%, Air Liquide, Liège, Belgium) at a flow rate of 1.7 ml min-1. The initial oven
temperature was 50 °C and it was then increased at a rate of 30 °C min-1 to 150 °C followed by an increase of 4 °C min-1
to 240 °C. The injection volume was 1 μl in splitless mode. Standard of fatty acid methyl esters (Supelco, Bellefonte, PA, USA), containing 37 methyl esters of fatty acids, was used to identify the individual peaks.
Triacylglycerol analysis
The determination of triacylglycerol composition was carried out according to the method of Ben Moumen et al. (2015a). A 10 μl aliquot of a 10% (w/v) olive oil solution in acetone were fractionated by a Shimadzu LC-6AD HPLC system (Nakagyo-Ku, Koyoto, Japan) connected to two LC-10AD Shimadzu liquid chromatography pumps and a refractive index detector 10A. The isocratic separation was carried out using an ODS-C18 reverse phase column (250 × 4.6 mm, 5 μm particle size; Thermo Scientific, Waltham, MA, USA). The mobile phase was composed
of acetone and acetonitrile (63.6/36.4; v/v) at a flow rate of 1 ml min-1. The molecular peaks of the separated
triacylglycerols were identified by comparison with the trioleate standard (OOO) obtained from Sigma-Aldrich (St. Louis, MO, USA) and after the analysis of eluates of the various peaks by GC-FID under the same conditions described above.
Phytosterol composition analysis
The phytosterol fraction was extracted according to the method described by Ben Moumen et al. (2015b) in the presence of butilin (Sigma-Aldrich, St. Louis, MO, USA), as an internal standard, at a concentration of 1 mg ml-1. The
obtained phytosterols were then silylated in the presence of a mixture (1/1; v/v) of anhydrous pyridine and a silylation reagent (Bis(trimethylsilyl)trifluoroacetamide containing 1% trimethylchlorosilane; Supelco, Bellefonte, PA, USA). Phytosterols were analyzed by GC-FID (HP 6890 series GC system) equipped with a capillary column HP 5 ms (30 m × 0.25 mm, 0.25 μm; Agilent Technologies, Palo Alto, CA, USA). The used carrier gas was helium with a flow rate of 1 ml min-1. The chromatographic conditions
were: injector temperature: 250 °C; detector temperature: 300 °C; Oven programming: initial oven temperature 50 °C with a temperature increase rate of 30 °C min-1 until
reaching 275 °C. The injection volume was 1 μl in splitless mode. Cholesterol, campesterol, erythrodiol, b-sitosterol and stigmasterol were identified by using a commercial standard (Sigma-Aldrich, St. Louis, MO, USA), and Δ5
-avenasterol, Δ7-avenasterol, clerosterol, 24-methylene
cholesterol, Δ7-stigmastenol and Δ5,24-stigmastadienol
were identified by comparing relative retention times (β-sitosterol-TMS = 1.00) with those of the European Communities (EEC, 1991).
Extraction of phenolic compounds
Phenolic compounds extraction was carried out according to the method described by Ben Moumen et al. (2015a) using a methanol/water mixture (80/20; v/v) as extraction solvent.
Colorimetric determination of total phenols
The total phenol content was determined by the Folin-Ciocalteu method at 750 nm using a UV spectrophotometer (RAYLEIGH UV1800, UV-Visible) according to the procedure described by Ben Moumen et al. (2015a) using caffeic acid (Sigma-Aldrich, St. Louis, MO, USA) as external standard (r2 > 0.98).
Analysis of phenolic compounds by HPLC
Phenolic compounds’ separation was carried out on a Zorbax XDB-C18 column (150 mm × 4.6 mm, 3.5 μm particle size; Agilent Technologies, Palo Alto, CA, USA) by HPLC (Agilent Technology series 1100 system, Palo Alto,
CA, USA) equipped with a diode array detector. The used solvent system was a gradient of A (water + 0.5% formic acid) and B (methanol + 0.5% formic acid) according to the method described by Bakhouche et al. (2013). The flow rate was 1 ml min-1. Detection was made at 254, 280, 320
and 340 nm and the identification of phenolic compounds was carried out at 280 nm. Hydroxytyrosol, tyrosol, vanillin, apigenin, luteolin and vanillic, p-coumaric and cinnamic acids were identified and quantified by external standardization (r2 > 0.99) with commercial standards (Sigma-Aldrich, St. Louis, MO, USA). The identification and quantification of decarboxymethyl ligstroside aglycone and decarboxymethyl oleuropein aglycone were performed by comparing their retention time with those published by Bakhouche et al. (2013) and the use of response factors determined by Mateos et al. (2001).
a-Tocopherol analysis
a-Tocopherol was determined according to the AOCS method Ce 8-89 (AOCS, 1989) on an HPLC (Agilent technology series 1200 system, Palo Alto, CA, USA) equipped with UV detector. The separation was carried out on a column of silica Uptisphere 120Ǻ NH2 (150 mm × 3 mm, 5 μm particle size; Interchim, Montlucon, France) which was eluted with a mobile phase composed of n-hexane/2-propanol (99/1; v/v) at a flow rate of 1 ml min-1. The
identification was performed using commercial tocopherol standards (a, b, g and d-tocopherol, Sigma-Aldrich, St. Louis, USA) at 292 nm. The a-tocopherol concentration was then calculated from the external calibration curve (r2 > 0.99). Determination of carotenoids and chlorophylls contents
Carotenoids and chlorophylls contents were calculated by absorbance at 470 and 670 nm, respectively, using a UV spectrophotometer (RAYLEIGH UV1800; UV-Visible)
according to the method described by Minguez-Mosquera et al. (1990).
Evaluation of olive oil Stability
The oxidative stability of olive oil was evaluated by the Rancimat test using Metrom Rancimat 743 (Metrom Co., Basel, Switzerland) and expressed in induction time (hours). The operating conditions are as follows: 3±0.01 g of olive oil sample were subjected to thermal degradation at 100±1.6 °C by bubbling a stream of air at a rate of 15 L h-1. The oxidation products (mainly volatile organic
acids) from the oil samples were collected in a measuring cell containing 60 ml of distilled water.
Statistical analysis
The results presented in this work are the averages of the analyses carried out in triplicate with the corresponding standard deviations for each season (for each parameter: 3 determinations × 3 samples = 9). One-way ANOVA statistical analysis and Duncan’s Post-hoc test were used to determine the significant differences between the varieties. The significant differences between the results of the two crop seasons were determined by the t-Student test. The significant difference threshold was set at 5%. The applications of these statistical analyses were carried out using IBM Statistical Package for the Social Sciences (version 20; IBM SPSS) for Windows.
RESULTS AND DISCUSSION
Quality parametersThe results listed in Table 2 show that olive oils of the studied varieties, in the two crop seasons (2012/2013 and 2013/2014), have quality indices (acidity, peroxide value and UV indices) which comply with the limits established by the
Table 2: Standard quality parameters of monovarietal extra virgin olive oils obtained in two crop seasons
Quality parameters Crop season Olive varieties Sig. level
Arbequina Arbosana Koroneiki
Free acidity (%C18:1) 2012/2013 0.46±0.03ab 0.53±0.03bb 0.58±0.09bb *
2013/2014 0.24±0.02ba 0.21±0.04aa 0.29±0.04ca ***
Sig. level *** *** ***
Peroxide value (meq O2 kg-1) 2012/2013 8.26±0.49ab 9.10±0.40bb 10.51±0.46cb ***
2013/2014 6.32±0.32aa 7.50±0.79ba 9.02±1.15ca *** Sig. level *** *** *** K270 2012/2013 0.08±0.01aa 0.11±0.01ba 0.14±0.01ca *** 2013/2014 0.10±0.00aa 0.12±0.00ba 0.15±0.01ca *** Sig. level NS NS NS K232 2012/2013 1.43±0.18aa 1.56±0.01ba 1.63±0.10bb * 2013/2014 1.66±0.06bb 1.73±0.03cb 1.50±0.03aa *** Sig. level *** *** **
Values are the means±standard deviations (n=9). For each parameter, significant differences in the same line (comparison among cultivars) are indicated by different superscript letters and significant differences in the same column (comparison between crop seasons) are indicated by different lowercase letters. Significance level: ***p<0.001; **p<0.01; *p<0.05; NS=not significant
International Olive Council (COI, 2013) for extra virgin olive oil category (acidity ≤ 0.8%, peroxide value ≤ 20 meq O2 kg-1, K
270 ≤ 0.22, K232 ≤ 2.5). K270 values remained almost
constant, with some non-significant differences between the two crop seasons. On the other hand, the acidity and peroxide value of all 2013/2014 samples are significantly lower than those observed in 2012/2013. These variations between the two crop seasons are statistically significant (p < 0.001). Therefore, one could say that these variations are due to the seasonal variations of the climatic conditions of this region. In fact, the climatic conditions of the two crop season showed a clear difference in rainfall and especially at the level of minimum and maximum temperatures registered in the October-November period. Similar results have also been reported on the oil of Arbequina variety grown in Spain (Romero et al., 2003; Morelló et al., 2006). Additionally, the significant effect of the varietal factor was observed for all of the quality parameters (p < 0.05). According to several studies (Rotondi and Magli, 2004; Khlil et al., 2017), the varietal factor seems to have no effect on these quality indices. These indices are mainly affected by the factors that cause damage to olive fruits.
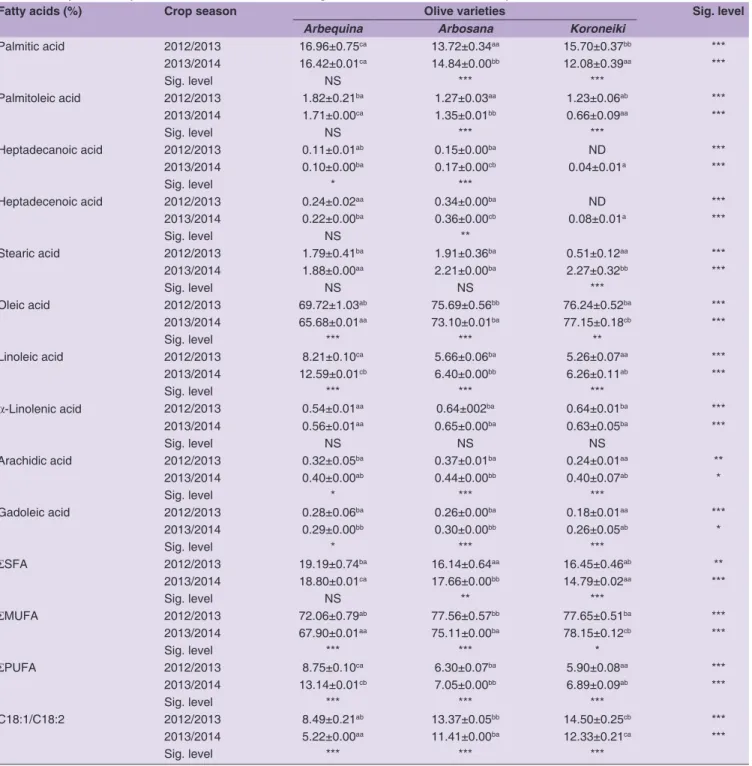
Composition of fatty acids and triacylglycerols The results of fatty acids analysis of the studied varieties, during two crop seasons, are summarized in Table 3. With the exception of heptadecenoic acid, which is considered by some authors as a variety character (Piscopo et al., 2016), the examination of these results shows that the fatty acid composition of the analyzed EVOOs is in accordance with the specifications required by the commercial standard established by the International Olive Council for high-quality oils for the two crop seasons. Also, there is a clear influence of the varietal factor (p < 0.05). For the two crop seasons, EVOOs of Arbosana and Koroneiki varieties have relatively different fatty acid profiles compared to Arbequina oil. In comparison with Arbequina oil during the 2012/2013 and 2013/2014 crop seasons, Arbosana and Koroneiki oils are characterized by higher percentages of oleic acid (Koroneiki: 76.24 and 77.15%, Arbosana: 75.69 and 73.10%, respectively), lower levels of palmitic acid (Koroneiki: 15.70 and 12.08%, Arbosana: 13.72 and 14.84%, respectively) and linoleic acid (Koroneiki: 5.26 and 6.26%, Arbosana: 5.66 and 6.40%, respectively). Arbequina oil showed a different fatty acid profile from the two previous cultivars with higher levels of palmitic acid (16.96 and 16.42%, respectively), higher percentages of polyunsaturated fatty acids (8.75% and 13.14%, respectively) and the lowest C18:1/C18:2 ratio (8.49 and 5.22, respectively), due to its low oleic acid content (69.72 and 65.68%, respectively) and its high content of linoleic acid (8.21 and 12.59%, respectively). The major fatty acids’ composition of EVOOs from Spanish varieties (Arbequina and Arbosana) introduced in
north-eastern Morocco is different from those observed in these same varieties cultivated in their original site (Hermoso et al., 2011) and in Tunisia (Allalout et al., 2009). Arbequina and Arbosana, when grown in north-eastern Morocco, produce oils with lower levels of linoleic acid compared to those of their site of origin (11.10 and 7.90%, respectively) and in Tunisia (12.93 and 12.09%, respectively). However, the oils produced in Morocco have oleic acid proportions close to those obtained in Spain (69.40 and 73.00%, respectively) and much higher than those obtained in Tunisia (58.82 and 64.79%, respectively). The Koroneiki variety olive oil has a comparable oleic acid composition between north-eastern Morocco and northern Tunisia (75.53%), where the cultivar is grown under irrigated high-density planting system (Allalout et al., 2009), and in its original growing area (76.22%), even when the variety is conducted in rainfed cultural system (Koutsaftakis et al., 2000).
As shown in Table 3, a significant effect of crop season was observed on the fatty acid composition of the analyzed EVOOs. The major fatty acids, such as palmitic, oleic and linoleic acids, are the most influenced. With the exception of palmitic acid in Arbequina oil (p > 0.05), the percentages of these fatty acids showed significant differences between the two crop seasons. The oleic acid content was higher in EVOOs from the 2012/2013 crop season than in 2013/2014 for Arbequina and Arbosana varieties (p < 0.001). Keeping in mind the influence of other factors on olive oil’s fatty acid composition, mainly the genetic factor and the olives’ harvesting time (Poiana and Mincione, 2004), the differences observed between the two crop seasons can also be related to the impact of environmental factors on fatty acid biosynthesis. In fact, previous studies have shown that temperature and water intake are the main factors that affect the rate and metabolism of fatty acids in olives (Harwood, 1984; Romero et al., 2003). While other authors have noted that certain fatty acids, like oleic and linoleic acids and the ratio between them (C18:1/C18:2), as well as the synthesis of certain triacylglycerols are affected by water supply and the climatic conditions of the summer period corresponding to the final stage of the formation of olive fruits (Angerosa et al., 1996; Stefanoudaki et al., 2001). In a recent study, García-Inza et al. (2014) found that increasing temperature reduces the level of oleic acid and increases the content of palmitic, palmitoleic, linoleic and linolenic acids in olive oil. As a result, a link was observed between the variation in the proportion of these fatty acids and the maximum temperature of the June-August period between the two crop seasons (Table 1). Fatty acids biosynthesis begins in plastids by mainly producing palmitic and stearic acids under the action of two enzymes, acetyl COA carboxylase and fatty acid synthase (Harwood, 1996). The former insures palmitic acid synthesis, while the latter
catalyzes palmitic acid elongation to produce stearic acid. This step is important because it determines the proportion of fatty acids with 16 and 18 carbon atoms in the oil (Salas et al., 2000). For Arbosana and Arbequina cultivars, the highest proportion of oleic acid was in olive oils from the 2012/2013 crop season and the lowest palmitic acid rate was in olive oils from the 2012/2013 crop season for Arbosana variety. The opposite variation was observed for the Koroneiki cultivar.
Another remarkable and significant change (p < 0.001) was observed in the level of linoleic acid between the two crop season for all the analyzed samples (Table 3). The highest levels of this fatty acid were observed in the olive oil samples of the 2013/2014 crop season. These variations could be linked to the difference of the seasonal temperatures of summer (June-August), which was warmer in the 2012/2013 crop season than the 2013/2014 crop season (Table 1). The climatic conditions seem to cause a
Table 3: Fatty acid composition of monovarietal extra virgin olive oils obtained in two crop seasons
Fatty acids (%) Crop season Olive varieties Sig. level
Arbequina Arbosana Koroneiki
Palmitic acid 2012/2013 16.96±0.75ca 13.72±0.34aa 15.70±0.37bb *** 2013/2014 16.42±0.01ca 14.84±0.00bb 12.08±0.39aa *** Sig. level NS *** *** Palmitoleic acid 2012/2013 1.82±0.21ba 1.27±0.03aa 1.23±0.06ab *** 2013/2014 1.71±0.00ca 1.35±0.01bb 0.66±0.09aa *** Sig. level NS *** *** Heptadecanoic acid 2012/2013 0.11±0.01ab 0.15±0.00ba ND *** 2013/2014 0.10±0.00ba 0.17±0.00cb 0.04±0.01a *** Sig. level * *** Heptadecenoic acid 2012/2013 0.24±0.02aa 0.34±0.00ba ND *** 2013/2014 0.22±0.00ba 0.36±0.00cb 0.08±0.01a *** Sig. level NS ** Stearic acid 2012/2013 1.79±0.41ba 1.91±0.36ba 0.51±0.12aa *** 2013/2014 1.88±0.00aa 2.21±0.00ba 2.27±0.32bb *** Sig. level NS NS *** Oleic acid 2012/2013 69.72±1.03ab 75.69±0.56bb 76.24±0.52ba *** 2013/2014 65.68±0.01aa 73.10±0.01ba 77.15±0.18cb *** Sig. level *** *** ** Linoleic acid 2012/2013 8.21±0.10ca 5.66±0.06ba 5.26±0.07aa *** 2013/2014 12.59±0.01cb 6.40±0.00bb 6.26±0.11ab *** Sig. level *** *** *** α-Linolenic acid 2012/2013 0.54±0.01aa 0.64±002ba 0.64±0.01ba *** 2013/2014 0.56±0.01aa 0.65±0.00ba 0.63±0.05ba *** Sig. level NS NS NS Arachidic acid 2012/2013 0.32±0.05ba 0.37±0.01ba 0.24±0.01aa ** 2013/2014 0.40±0.00ab 0.44±0.00bb 0.40±0.07ab * Sig. level * *** *** Gadoleic acid 2012/2013 0.28±0.06ba 0.26±0.00ba 0.18±0.01aa *** 2013/2014 0.29±0.00bb 0.30±0.00bb 0.26±0.05ab * Sig. level * *** *** ƩSFA 2012/2013 19.19±0.74ba 16.14±0.64aa 16.45±0.46ab ** 2013/2014 18.80±0.01ca 17.66±0.00bb 14.79±0.02aa *** Sig. level NS ** *** ƩMUFA 2012/2013 72.06±0.79ab 77.56±0.57bb 77.65±0.51ba *** 2013/2014 67.90±0.01aa 75.11±0.00ba 78.15±0.12cb *** Sig. level *** *** * ƩPUFA 2012/2013 8.75±0.10ca 6.30±0.07ba 5.90±0.08aa *** 2013/2014 13.14±0.01cb 7.05±0.00bb 6.89±0.09ab *** Sig. level *** *** *** C18:1/C18:2 2012/2013 8.49±0.21ab 13.37±0.05bb 14.50±0.25cb *** 2013/2014 5.22±0.00aa 11.41±0.00ba 12.33±0.21ca *** Sig. level *** *** ***
Values are the means±standard deviations (n=9). For each parameter, significant differences in the same line (comparison among cultivars) are indicated by different superscript letters and significant differences in the same column (comparison between crop seasons) are indicated by different lowercase letters. Significance level: ***p<0.001; **p<0.01; *p<0.05; NS=not significant. SFA: Saturated fatty acids; MUFA: Monounsaturated fatty acids; PUFA: Polyunsaturated fatty acids
change in the degree of unsaturation of fatty acids, mainly linoleic acid. In fact, after the desaturation of stearic acid by the action of Δ-9 stearyl desaturase, the oleic acid is converted into linoleic acid by the consecutive actions of Δ-12 and Δ-15 desaturases (Hernández et al., 2011). These two enzymes are regulated by different environmental factors, mainly temperature, which control the action of these enzymes to maintain the fluidity of biological membranes (Los and Murata, 1998; Hernández et al., 2011). Similarly, the statistical analysis revealed an effect of climatic variations on the molecular composition of triacylglycerols for all the analyzed EVOOs (Table 4). As specified for fatty acids, the variation in the proportions of the major triacylglycerols between the two crop seasons is not the same in the three studied cultivars, but it is important to note that the majority of molecular groups revealed statistically significant differences. Based on the results in Table 4, we found that all EVOOs from the 2013/2014 crop season are characterized by a significant decrease (p < 0.001) in the triolein percentage (OOO) compared to the oil samples from 2012/2013 crop season. On the other hand, a significant increase was observed in
the linoleyldiolein (LOO) level in EVOOs of Arbequina and Koroneiki varieties (p < 0.01), while Arbosana did not show a significant difference (p > 0.05). Similarly, palmityldiolein (POO) did not show a significant variation in the proportion between the two crop seasons for the Koroneiki variety (p > 0.05), while Arbequina and Arbosana oils are characterized by a significant increase (p < 0.01) in the POO proportion during the 2013/2014 crop season. This different behavior, towards climatic conditions, could be explained by the genetic factor.
The highest OOO levels during the 2012/2013 and 2013/2014 crop seasons were observed in Koroneiki oil (49.08 and 48.02%, respectively), followed by Arbosana oil (44.91 and 40.40, respectively) and Arbequina oil (37.53 and 31.51%, respectively). The latter’s oil is distinguished by the highest LOO contents (14.87 and 16.31%, respectively), while Arbosana oil is distinguished from other varieties by its high POO proportions during the two crop season (27.59 and 29.80%, respectively). These intervarietal variations in the proportion of these triacylglycerols are statistically significant (p < 0.05). Taking into account the influence of other factors on olive oil’s triacylglycerol
Table 4: Triacylglycerol composition of monovarietal extra virgin olive oils obtained in two crop seasons
Triacylglycerols (%) Crop season Olive varieties Sig. level
Arbequina Arbosana Koroneiki
LOL 2012/2013 2.24±0.36ba 1.09±0.09aa 1.11±0.04aa *** 2013/2014 3.11±0.07cb 1.04±0.30aa 1.34±0.08bb *** Sig. level *** NS *** LPL 2012/2013 1.76±0.22bb 1.40±0.13aa 1.39±0.05aa *** 2013/2014 1.52±0.17ba 1.37±0.25aba 1.34±0.19aa * Sig. level ** NS NS POLn 2012/2013 1.23±0.04ca 0.62±0.08ba 0.54±0.03aa *** 2013/2014 1.30±0.07bb 0.78±0.06ab 0.78±0.05ab *** Sig. level ** *** *** LOO 2012/2013 14.87±0.32ca 10.29±0.01ba 9.87±0.02aa *** 2013/2014 16.31±0.15bb 10.32±1.33aa 10.54±0.36ab *** Sig. level *** NS ** LPO 2012/2013 7.89±0.14ca 4.98±0.14ba 4.36±0.07ab *** 2013/2014 11.10±0.46cb 6.00±0.82bb 4.20±0.24aa *** Sig. level *** *** * OOO 2012/2013 37.53±0.08ab 44.91±0.34bb 49.08±0.17cb *** 2013/2014 31.51±0.53aa 40.40±1.02ba 48.02±0.13ca *** Sig. level *** *** *** POO 2012/2013 25.97±0.39aa 27.59±0.03ca 26.35±0.12ba *** 2013/2014 26.39±0.43ab 29.80±1.30bb 26.49±0.38aa *** Sig. level ** *** NS POP 2012/2013 1.29±0.18ca 0.72±0.10ba 0.27±0.03aa *** 2013/2014 1.50±0.10bb 1.42±0.23bb 1.04±0.31ab *** Sig. level ** *** *** SOO 2012/2013 4.30±0.09bb 4.11±0.02bb 3.52±0.32ab ** 2013/2014 3.81±0.41ba 3.74±0.22ba 2.68±0.29aa *** Sig. level *** *** ***
Values are the means±standard deviations (n=9). For each parameter, significant differences in the same line (comparison among cultivars) are indicated by different superscript letters and significant differences in the same column (comparison between crop seasons) are indicated by different lowercase letters. Significance level: ***p<0.001; **p<0.01; *p<0.05; NS=not significant. L: Linoleyl; Ln: Linolenyl; O: Oleyl; S: Stearyl; P: Palmityl
composition, mainly the genetic factor and the maturity stage of olives (Giuffrè, 2013), the results of triacylglycerols in the analyzed olive oils can be compared to those found in Tunisian olive oils (OOO (30– 46%) and POO (19.7– 26.3%)) (Manai-Djebali et al., 2012), Italian olive oils (OOO (21.70–39.37%), POO (18.84–22.01%)) (Giuffrè, 2013) and French olive oils (OOO (32.63–54.59%) and POO (17.22–21.72%)) (Ollivier et al., 2006).
Variations of antioxidant parameters
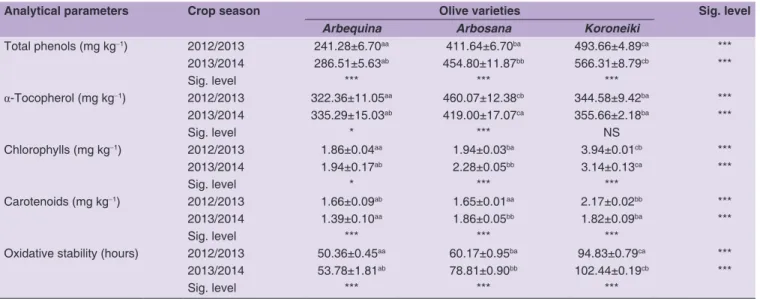
In EVOO, the main chlorophylls and carotenoids are pheophytin and lutein, respectively. These compounds are also involved in oxidation mechanisms (Minguez-Mosquera et al., 1991). The results of assaying these pigments in the oils of the studied varieties by spectrophotometer are summarized in Table 5. The maximum levels of pigments (calculated from the results in Table 5), in the 2012/2013 and 2013/2014 crop seasons, were observed in Koroneiki oil (6.11 and 4.96 mg kg-1, respectively), whereas the lowest
values for these compounds were observed in Arbequina oil (3.52 and 3.33 mg kg-1, respectively). Statistical analysis
shows that the chlorophyll and carotenoid contents are influenced by the varietal factor (p < 0.001). Although the levels of carotenoids in oil samples are still lower than those of chlorophylls, the statistical analysis shows that the carotenoid content is visibly influenced by the effect of crop season (p < 0.001). Additionally, Arbequina and Koroneiki oils of the 2013/2014 crop season showed a decrease in carotenoid content compared to 2012/2013 crop season. This variation may be due to environmental factors, especially the temperature. Romero et al. (2003) reported that low temperatures during the ripening stage would lead to alterations or even partial degradation of pigments. In
fact, the period of November 2013 was characterized by frequent frosts which explains the difference in the average minimum temperature of this period (0.4 °C) compared to the same phase of the 2012/2013 crop season (5.6 °C). However, the low pigment concentrations in the analyzed oil samples cannot allow to establish a clear link between climatic variations and pigment content. In fact, Arbosana showed a different behavior compared to Arbequina and Koroneiki varieties. Its carotenoid content recorded a significant increase (p < 0.001) in the 2013/2014 crop season (1.86 mg kg-1) compared to the 2012/2013 crop
season (1.65 mg kg-1). Similarly, the chlorophyll fraction
showed a significant difference in its concentration between the two seasons for all the analyzed oils. Regarding the Koroneiki oil’s chlorophyll, there was a decrease (p < 0.001) in its content during the 2013/2014 crop season (3.14 mg kg-1) in comparison with the 2012/2013
crop season (3.94 mg kg-1), while an increase was observed
in Arbosana’s chlorophyll content (from 1.94 to 2.28 mg kg-1;
p < 0.001) and Arbequina’s chlorophyll content (from 1.86 to 1.94 mg kg-1; p < 0.05).
The phenolic compounds of EVOO play an important role in the evaluation of its quality, contributing for a large part to the oil’s oxidation resistance (Gutierrez et al., 2001; Mansouri et al., 2017). The results of the total phenols determination for the oils analyzed by colorimetric assay are shown in Table 5. The total phenol content varies significantly according to the cultivar (p < 0.001). Koroneiki oil is characterized by a richness in phenolic compounds with a 493.66 mg kg-1 content in the 2012/2013 crop
season and 566.31 mg kg-1 in 2013/2014 crop season.
The lowest levels of total phenols in the two crop seasons
Table 5: Oxidative stability and total phenol, α-tocopherol, chlorophyll and carotenoid contents of monovarietal olive oil samples obtained in two crop seasons
Analytical parameters Crop season Olive varieties Sig. level
Arbequina Arbosana Koroneiki
Total phenols (mg kg‑1) 2012/2013 241.28±6.70aa 411.64±6.70ba 493.66±4.89ca *** 2013/2014 286.51±5.63ab 454.80±11.87bb 566.31±8.79cb *** Sig. level *** *** *** α-Tocopherol (mg kg‑1) 2012/2013 322.36±11.05aa 460.07±12.38cb 344.58±9.42ba *** 2013/2014 335.29±15.03ab 419.00±17.07ca 355.66±2.18ba *** Sig. level * *** NS Chlorophylls (mg kg‑1) 2012/2013 1.86±0.04aa 1.94±0.03ba 3.94±0.01cb *** 2013/2014 1.94±0.17ab 2.28±0.05bb 3.14±0.13ca *** Sig. level * *** *** Carotenoids (mg kg‑1) 2012/2013 1.66±0.09ab 1.65±0.01aa 2.17±0.02bb *** 2013/2014 1.39±0.10aa 1.86±0.05bb 1.82±0.09ba *** Sig. level *** *** ***
Oxidative stability (hours) 2012/2013 50.36±0.45aa 60.17±0.95ba 94.83±0.79ca ***
2013/2014 53.78±1.81ab 78.81±0.90bb 102.44±0.19cb ***
Sig. level *** *** ***
Values are the means±standard deviations (n=9). For each parameter, significant differences in the same line (comparison among cultivars) are indicated by different superscript letters and significant differences in the same column (comparison between crop seasons) are indicated by different lowercase letters. Significance level: ***p<0.001; **p<0.01; *p<0.05; NS=not significant
were observed in Arbequina oil samples (241.28 and 286.51 mg kg-1, respectively). Additionally, a significant crop
season effect was observed for all the analyzed samples (p < 0.001). EVOOs of the 2013/2014 crop season are richer in total phenols than those of 2012/2013 crop season. These differences between the two crop seasons could be attributed to environmental factors, mainly rainfall. In fact, a link was observed between the rainfall of the October-November period, where the trees were deprived of irrigation, and total phenol content. The 2013/2014 crop season, which corresponds to the highest levels, is characterized by lower rainfall in the October-November period (29.5 mm) compared with the same period of 2012/2013 season (155.2 mm). This is in accordance with the results of Romero et al. (2003) who also observed a relationship between the phenolic compounds content in Arbequina oil and rainfall accumulation per season. However, the impact of water intake on the phenolic content of olive oil remains controversial. Palese et al. (2010) found a significant decrease in total phenol content of olive oils from irrigated trees. On the other hand, Greven et al. (2009) found that the olive trees deprived from irrigation yielded oils with lower phenol levels compared to irrigated trees (a 33% decrease), while Dag et al. (2008) suggest that moderate water stress would be beneficial to olive oil quality.
Another class of molecules that contribute to the stability of EVOO are tocopherols. α-Tocopherol constitutes the dominant tocopherol fraction in olive oil (more than 95% of total tocopherols) (Aguilera et al., 2005; Mansouri et al., 2016). Their evaluation is important because of their contribution to the final quality of this product. From the results presented in Table 5, α-tocopherol content is strongly influenced by the varietal factor (p < 0.001). Arbosana oil has the highest concentration of followed by Koroneiki oil (344.58 and 355.66 mg kg-1, respectively) and Arbequina oil (322.36 and 335.29 mg kg-1, respectively). Additionally, Arbosana has a significant difference (p < 0.001) in the α-tocopherol content between the two crop seasons. Its content decreased during the 2013/2014 crop season. This can be attributed to the susceptibility of this variety to cold and night/day temperature differences compared to the other two cultivars that seem less sensitive to cold, especially Koroneiki which did not show a significant difference (p > 0.05). In fact, the minimum temperature of the ripening period in the cultivation site of these varieties experienced frequent frosts before the harvest of olives (November) during the 2013/2014 crop season compared to 2012/2013 crop season (Table 1). Similarly, Romero et al. (2003) revealed that the cold during the olive harvest period causes damage to the fruit by causing a decrease in olive oil’s tocopherol content.
Oxidative stability is considered among the main indices of oil quality assessment that could predict its storage aptitude and its qualitative shelf life. It is a tool for estimating the sensitivity (or stability) of an oil to oxidative degradation. The induction times determined during the two crop seasons for the analyzed oils showed that this parameter is influenced by the cultivar factor (p < 0.001). Koroneiki oil has the highest values (2012/2013: 94.83 h and 2013/2014: 102.44 h) followed by Arbosana oil (2012/2013: 60.17 h and 2013/2014: 78.81 h) and Arbequina oil (2012/2013: 50.36 h and in 2013/2014: 53.78 h). Our results of oxidative stability could be compared to those determined by Manai-Djebali et al. (2012), at 100 °C and an air flow of 10 L h-1, in virgin olive oils (46.5-113 h)
of other varieties but higher than the results reported by Allalout et al., (2009), using an air flow of 10 L h-1 in the
same experimental conditions, for virgin olive oils of the same varieties cultivated in Tunisia. Significant differences between the two crop seasons were observed for all the oil samples of the studied varieties (p < 0.001). These inequalities can be attributed largely to the difference in phenolic compound contents (Table 5). In fact, several studies on the contribution of the constituents of olive oil to oxidative stability have concluded that the resistance of olive oil to oxidation is related to its monounsaturated fatty acid and polyunsaturated fatty acid content, and to natural antioxidants such as phenolic compounds (Gutierrez et al., 2001; Aguilera et al., 2005). In our case, despite the decrease of the C18:1/C18:2 ratio (Table 3), the analyzed oils recorded a significant increase in induction time for the 2013/2014 olive oil samples compared to those of 2012/2013 crop season. This could be due to the increase of natural antioxidants such as phenolic compounds.
Phenolic compounds
The phenolic fraction (Table 6) of the EVOO samples of Arbequina, Arbosana and Koroneiki varieties produced during the two crop seasons is characterized by the dominance of secoiridoid derivatives, such as the decarboxymethylated forms of oleuropein aglycone (DOA) and ligstroside aglycone (DLA). These two compounds represent more than 85% (calculated from the results in Table 6) of the phenolic compounds identified in all the analyzed oils, with concentrations that vary respectively between 85-183 mg kg -1 and 108-196 mg kg -1. Koroneiki oil shows
the highest levels of DOA and DLA during the two crop seasons, followed by Arbosana and Arbequina oils. Phenolic alcohols, flavonoids, phenolic acids and lignans are also present in the analyzed oils but in small amounts. Their contents do not exceed 15% of the phenolic compounds. Although significant differences were observed in the total phenol content of the analyzed oils between the two
crop seasons (Table 5), quantitative analysis of phenolic compounds by HPLC also showed an influence of climatic variations on the contents of these compounds in oil samples of the studied varieties (Table 6). With the
exception of flavonoids and lignans, all the identified phenolic fractions showed an increase in their levels in olive oils from the 2013/2014 crop season. The main variations were recorded in the fraction of secoiridoids. DLA and
Table 6: Phenolic compounds composition of extra virgin olive oil samples obtained in two crop seasons
Phenolic compounds (mg kg‑1) Crop season Olive varieties Sig. level
Arbequina Arbosana Koroneiki
Hydroxytyrosol 2012/2013 1.94±0.03aa 9.75±0.19ba 14.17±0.16ca *** 2013/2014 2.64±0.07ab 11.08±0.07bb 16.94±0.19cb *** Sig. level *** *** *** Tyrosol 2012/2013 1.49±0.03aa 4.66±0.08ba 6.97±0.17ca *** 2013/2014 2.96±0.00ab 4.47±025bb 7.37±0.20cb *** Sig. level *** ** *** Phenolic alcohols 2012/2013 3.43±0.04aa 14.41±0.22ba 21.14±0.18ca *** 2013/2014 5.60±0.14ab 15.54±0.21bb 24.31±0.16cb *** Sig. level *** ** ***
Decarboxymethyl oleuropein aglycone 2012/2013 85.37±1.43aa 128.53±0.20ba 146.72±1.79ca ***
2013/2014 104.32±0.92ab 153.16±3.54bb 183.00±1.17cb ***
Sig. level *** *** ***
Decarboxymethyl ligstroside aglycone 2012/2013 108.33±1.82aa 157.16±0.50ba 165.56±1.84ca ***
2013/2014 121.60±4.45ab 171.25±6.57bb 195.54±5.52cb *** Sig. level *** *** *** Secoiridoid derivatives 2012/2013 193.70±3.06aa 285.69±0.69ba 312.28±3.04ca *** 2013/2014 225.92±3.74ab 324.41±3.88bb 378.54±2.84cb *** Sig. level *** *** *** Luteolin 2012/2013 6.89±0.11bb 6.71±0.03aba 6.54±0.39ab * 2013/2014 5.04±0.18aa 7.21±0.26cb 5.45±0.10ba *** Sig. level *** *** *** Apigenin 2012/2013 3.33±0.06ab 7.55±0.05ca 3.55±0.05ba *** 2013/2014 2.80±0.05aa 9.43±0.07cb 3.90±0.12bb *** Sig. level *** *** *** Flavonoids 2012/2013 10.22±0.13ab 14.26±0.06ca 10.09±0.45bb *** 2013/2014 7.83±0.10aa 16.64±0.18cb 9.35±0.14ba *** Sig. level *** *** *** Pinoresinol 2012/2013 5.24±0.09bb 7.08±0.04ca 4.79±0.07ab *** 2013/2014 3.87±0.06aa 7.43±0.15bb 3.87±0.06aa *** Sig. level *** *** *** Lignans 2012/2013 5.24±0.09bb 7.08±0.04ca 4.79±0.07ab *** 2013/2014 3.87±0.06aa 7.43±0.15bb 3.87±0.06aa *** Sig. level *** *** *** Vanillic acid 2012/2013 0.41±0.00ba 0.25±0.00aa 0.43±0.00ca *** 2013/2014 0.52±0.06bb 0.36±0.05ab 0.62±0.05cb *** Sig. level *** *** *** p-Coumaric acid 2012/2013 0.13±0.00ca 0.07±0.00aa 0.12±0.01ba *** 2013/2014 0.28±0.01cb 0.07±0.01ab 0.16±0.02bb *** Sig. level *** * *** Cinnamic acid 2012/2013 0.12±0.00aa 0.17±0.02ba 0.55±0.01ca *** 2013/2014 0.19±0.01ab 0.24±0.01bb 0.68±0.02cb *** Sig. level *** *** *** Vanillin 2012/2013 0.22±0.00ba 0.29±0.00ca 0.18±0.03aa *** 2013/2014 0.46±0.01cb 0.43±0.01bb 0.25±0.02ab *** Sig. level *** *** *** Simple phenols 2012/2013 0.87±0.01ba 0.78±0.01aa 1.28±0.02ca *** 2013/2014 1.45±0.03bb 1.11±0.04ab 1.71±0.06cb *** Sig. level *** *** ***
Values are the means±standard deviations (n=9). For each parameter, significant differences in the same line (comparison among cultivars) are indicated by different lowercase letters and significant differences in the same column (comparison between crop seasons) are indicated by different superscript letters. Significance level: ***p<0.001; **p<0.01; *p<0.05; NS=not significant
DOA levels showed a significant difference between the two crop season (p < 0.001). As stated in the total phenols part, this variation could be due to environmental factors, mainly precipitation. The strong increase in DLA and DOA concentration was recorded in Koroneiki oil, from 165.56 mg kg-1 in the 2012/2013 crop season to
195.54 mg kg-1 in 2013/2014 crop season and from 146.72
to 183.00 mg kg-1, respectively. Another variation was
observed in Arbosana oil on flavonoid and lignan fractions. Their contents increased significantly (p < 0.001) between the two crop seasons (from 14.26 and 7.08 mg kg-1 in
2012/2013 to 16.64 and 7.43 mg kg-1 in 2013/2014).
Arbequina and Koroneiki differ from Arbosana variety. Their contents showed a significant decrease (p < 0.001), passing, respectively from 10.22 and 10.09 mg kg-1 in the 2012/2013
crop season to 7.83 and 9.35 mg kg-1 in 2013/2014 crop
season for flavonoids and from 5.24 and 4.79 mg kg-1 in
the 2012/2013 crop season to 3.87 mg kg-1 in 2013/2014
crop season for lignans. Phytosterol composition
With the exception of Δ5,24-stigmastadienol, stigmasterol
and erythrodiol, sterol profiles of the analyzed EVOOs (Table 7) did not reveal any significant differences in phytosterol levels and proportions between the two crop season (p > 0.05). Giuffrè and Louadj (2013) reported that some compounds, such as stigmasterol, β-sitosterol, sitostanol, Δ7-avenasterol, were influenced by the effect
of crop season. While other authors have observed that the majority of sterol compounds in EVOO is influenced
Table 7: Composition of phytosterol fraction of monovarietal extra virgin olive oils obtained in two crop seasons
Phytosterols (% of total phytosterols) Crop season Olive varieties Sig. level
Arbequina Arbosana Koroneiki
Cholesterol 2012/2013 0.17±0.00ca 0.12±0.00aa 0.16±0.01ba *** 2013/2014 0.18±0.02ca 0.12±0.00aa 0.16±0.01ba *** Sig. level NS NS NS 24-Methylene cholesterol 2012/2013 0.39±0.03ba 0.19±0.01aa 0.42±0.02ca *** 2013/2014 0.38±0.02ba 0.18±0.01aa 0.43±0.00ca *** Sig. level NS NS NS Campesterol 2012/2013 2.86±0.04ba 3.39±0.02ca 2.57±0.11aa *** 2013/2014 2.89±0.10ba 3.42±0.13ca 2.52±0.11aa *** Sig. level NS NS NS Stigmasterol 2012/2013 0.73±0.01ba 0.78±0.01ca 0.40±0.01aa *** 2013/2014 0.75±0.02bb 0.77±0.02ca 0.41±0.01aa *** Sig. level * NS NS Clerosterol 2012/2013 1.17±0.00ca 1.05±0.02ba 0.96±0.13aa ** 2013/2014 1.17±0.11ca 1.03±0.03aa 0.97±0.20aa * Sig. level NS NS NS β-Sitosterol 2012/2013 79.26±0.74ca 77.48±0.12ba 75.79±0.39aa *** 2013/2014 78.81±0.78ca 77.36±0.49ba 75.65±0.85aa *** Sig. level NS NS NS ∆5‑Avenasterol 2012/2013 12.10±0.70aa 13.53±0.10ba 15.83±0.35ca *** 2013/2014 12.54±0.86aa 13.51±0.35ba 15.97±0.52ca *** Sig. level NS NS NS ∆5,24‑Stigmastadienol 2012/2013 0.67±0.02bb 1.04±0.05ca 0.56±0.01aa *** 2013/2014 0.65±0.02ba 1.11±0.02cb 0.57±0.01ab *** Sig. level * ** * ∆7‑Stigmastenol 2012/2013 0.41±0.02ba 0.27±0.00aa 0.40±0.02ba *** 2013/2014 0.39±0.01ba 0.27±0.01aa 0.42±0.02ca *** Sig. level NS NS NS ∆7‑Avenasterol 2012/2013 0.97±0.05ca 0.67±0.01aa 0.73±0.04ba *** 2013/2014 0.95±0.06ba 0.69±0.02aa 0.72±0.06aa *** Sig. level NS NS NS Erythrodiol 2012/2013 1.30±0.03aa 1.49±0.03ba 2.19±0.12ca *** 2013/2014 1.28±0.03aa 1.54±0.04bb 2.18±0.33ca *** Sig. level NS * NS Total phytosterols (mg kg‑1) 2012/2013 1978±16ba 1950±5ba 1604±57aa *** 2013/2014 1971±7ca 1941±29ba 1596±39aa *** Sig. level NS NS NS
Values are the means±standard deviations (n=9). For each parameter, significant differences in the same line (comparison among cultivars) are indicated by different lowercase letters and significant differences in the same column (comparison between crop seasons) are indicated by different superscript letters. Significance level: ***p<0.001; **p<0.01; *p<0.05; NS=not significant
by the crop season (Salvador et al., 2003). Moreover, several studies have documented that cultivar is the main determinant of olive oil’s sterol profile (Giuffrè and Louadj, 2013; Mansouri et al., 2015). This factor was very prominent in our study. In fact, variance analysis shows that the sterol profile of the analyzed oils is highly dependent on the olive variety (p < 0.05). The lowest total phytosterol concentration was observed in Koroneiki oil (1596 mg kg-1), while the highest level was observed.
in Arbequina oil (1978 mg kg-1). The total phytosterol
values and their composition are within the ranges indicated by the International Olive Council for high-quality oils (IOC, 2013). From the results presented in Table 7, we note for all the analyzed oils the dominance of β-sitosterol, whose proportions fluctuate between 75 and 80% during the two crop season. The highest value is recorded in Arbequina oil (79.26%) followed by Arbosana oil (77.48%) and Koroneiki oil (75.79%). As for Δ5-avenasterol, its content varies inversely with
β-sitosterol. Koroneiki oil is the richest in this substance (15.83%) followed by Arbosana and Arbequina oils (13.53 and 12.54%, respectively). Despite intervarietal variations, for the rest of the identified compounds, cholesterol, 24-methylene cholesterol, campesterol, stigmasterol, clerosterol, Δ5,24-stigmastadienol, Δ7-stigmastenol, Δ7
-avenasterol and erythrodiol, their percentages remain low compared to those of b-sitosterol and Δ5-avenasterol.
These compounds make up less than 10% of the sterol fraction in all the samples of the analyzed oils. The 10% is dominated by campesterol, which accounts for more than 30% of these compounds (calculated from the results in Table 7), followed by erythrodiol (more than 15%). Campesterol is found the most in Arbosana oil with an average of 3.42% of total phytosterols, while the highest value in erythrodiol is observed in Koroneiki oil (2.19%).
CONCLUSION
This work is the first evaluation of the crop season’s influence on the quality and chemical composition of the olive oils of Arbequina, Arbosana and Koroneiki cultivars grown under irrigated super-high-density planting system in the Oriental region of Morocco. The results obtained from this study indicate that the composition, with the exception of phytosterols, and the quality indices of extra virgin olive oils from these cultivars are strongly influenced by the variation of the climatic conditions. The main variations observed in the analyzed olive oils between the two crop seasons concerned antioxidant parameters, such as phenolic compounds, pigments and oxidation stability. Fatty acids and triacylglycerols are also influenced by climatic variations but the behavior of the studied varieties
in relation to climatic conditions is different. Despite these observed variations, the studied cultivars produce oils of excellent quality with a chemical composition that meets the requirements of the International Olive Council for high-quality oil.
ACKNOWLEDGEMENTS
This study was supported by the Moroccan–Belgian cooperation program “the Wallonia Brussels International project 2.9, 2012-2014”. We wish to thank Mr. Abdelouadoud Omari for his assistance and the company “Huiles d’olive de la Méditerranée” for its collaboration.
Authors’ Contributions
Conception and design of the study: Mansouri and Elamrani; Acquisition of data: Mansouri, Gaetan and Fauconnier; Analysis and interpretation of Data: Mansouri, Ben moumen and Belhaj; Drafting the manuscript: Mansouri and Belhaj; Critical revision: Serghini Caid and Sindic.
REFERENCES
Agiomyrgianaki, A., P. V. Petrakis and P. Dais. 2012. Influence of harvest year, cultivar and geographical origin on Greek extra virgin olive oils composition: A study by NMR spectroscopy and biometric analysis. Food Chem. 135: 2561-2568.
Aguilera, M. P., G. Beltrán, D. Ortega, A. Fernández, A. Jiménez and M. Uceda. 2005. Characterisation of virgin olive oil of Italian olive cultivars: Frantoio’ and Leccino’, grown in Andalusia. Food Chem. 89: 387-391.
Allalout, A., D. Krichène, K. Methenni, A. Taamalli, I. Oueslati, D. Daoud and M. Zarrouk. 2009. Characterization of virgin olive oil from super intensive Spanish and Greek varieties grown in northern Tunisia. Sci. Hortic. 120: 77-83.
Angerosa, F., L. Di Giacinto, C. Basti and A. Serraiocco. 1996. Influenza della variabile ambiente sulla composizione degli oli vergini di oliva. Riv. Ital. Sostanze Gr. 73: 461-467.
AOCS. 1989. Determination of tocopherols and tocotrienols in vegetable oils and fats by HPLC. In: Firestone, D. editor, Official Method Ce 8-89. AOCS Press, Champaign, IL.
Bakhouche, A., J. Lozano-Sánchez, R. Beltrán-Debón, J. Joven, A. Segura-Carretero and A. Fernández-Gutiérrez. 2013. Phenolic characterization and geographical classification of commercial Arbequina extra-virgin olive oils produced in southern Catalonia. Food Res. Inter. 50: 401-408.
Ben Moumen, A., F. Mansouri, G. Richard, M. Abid, M. L. Fauconnier, M. Sindic, A. Elamrani and H. Serghini Caid. 2015a. Biochemical characterisation of the seed oils of four safflower (Carthamus tinctorius) varieties grown in north-eastern of Morocco. Int. Food Sci. Tech. 50: 804-810.
Ben Moumen, A., F. Mansouri, G. Richard, M. L. Fauconnier, M. Sindic, A. Nabloussi, A. Elamrani and H. Serghini Caid. 2015b. Variations in the phytosterol and tocopherol compositions and the oxidative stability in seed oils from four safflower (Carthamus tinctorius L) varieties grown in northeastern Morocco. Inter. Food Sci. Tech. 50: 2264-2270.
Camposeo, S., G. Ferrara, M. Palasciano and A. Godini. 2008. Varietal behavior according to the superintensive olive culture training system. Acta. Hortic. 791: 271-274.
Camposeo, S. and A. Godini. 2010. Preliminary observations about the performance of 13 varieties according to the super high density oliveculture training system in Apulia (southern Italy). Adv. Hortic. Sci. 24: 16-20.
IOC. 2013. Norme commerciale applicable aux huiles d'olive et aux huiles de grignons d'olive. COI/T.15/NC nº 3/Rév. 7. International Olive Council, Madrid.
IOC. 2016. World Olive Oil Figures. Avialble from: http://www. internationaloliveoil.org/estaticos/view/131-world-olive-oil-figures?lang=en_US. [Last retrieved on 2017 Mar 16].
Dag, A., A. Ben-Gal, U. Yermiyahu, L. Basheer, Y. Nir and Z. Kerem. 2008. The effect of irrigation level and harvest mechanization on virgin olive oil quality in a traditional rain-fed ‘Souri’olive orchard converted to irrigation. J. Sci. Food Agric. 88: 1524-1528. EEC. 1991. Characteristics of olive and olive pomace oils and
their analytical methods EEC Regulation 2568/91. Off. J. Eur. Commun. L248: 1-82.
García-Inza, G., D. Castro, A. Hall and M. Rousseaux. 2014. Responses to temperature of fruit dry weight, oil concentration, and oil fatty acid composition in olive (Olea europaea L. var.‘Arauco’). Eur. J. Agron. 54: 107-115.
Giuffrè, A. M. and L. Louadj. 2013. Influence of crop season and cultivar on sterol composition of monovarietal olive oils in Reggio Calabria (Italy). Czech J. Food Sci. 31: 256-263.
Giuffrè, A. M. 2013. Influence of cultivar and harvest year on triglyceride composition of olive oils produced in Calabria (Southern Italy). Eur. J. Lipid Sci. Technol. 115: 928-934. Greven, M., S. Neal, S. Green, B. Dichio and B. Clothier. 2009. The
effects of drought on the water use, fruit development and oil yield from young olive trees. Agr. Water Manage. 96: 1525-1531. Gutierrez, F., T. Arnaud and A. Garrido. 2001. Contribution of
polyphenols to the oxidative stability of virgin olive oil. J. Sci. Food Agric. 81: 1463-1470.
Harwood, J. L. 1984. Effects of the environment on the acyl lipids of algae and higher plants. In: Siegenthaler, P. A. and W. Eichenberger, (Eds), Structure, Function and Metabolism of Plant Lipids, Elsevier Science Publishers B.V., Amsterdam, pp. 543-550.
Harwood, J. L. 1996. Recent advances in the biosynthesis of plant fatty acids. BBA-Lipid. Lipid Met. 1301: 7-56.
Hermoso, J., A. Ninot, A. Romero and J. Tous. 2011. Mediterranean clonal selections evaluated for modern hedgerow olive oil production in Spain. Calif. Agric. 65: 34-40.
Hernández, M. L., M. N. Padilla, M. D. Sicardo, M. Mancha and J. M. Martínez-Rivas. 2011. Effect of different environmental stresses on the expression of oleate desaturase genes and fatty acid composition in olive fruit. Phytochemistry. 72: 178-187. Khlil, E., F. Mansouri, A. Ben Moumen, H. Serghini Caid, M. Berrabah
and E. Tahri. 2017. Physicochemical characteristics of monovarietal olive oil produced at Beni Tajjit, South-West of the region of Eastern Morocco. J. Mater. Environ. Sci. 8: 4264-4272. Koutsaftakis, A., F. Kotsifakis and E. Stefanoudaki. 2000. La
caractérisation des huiles d’olive vierges extra crétoises obtenues à partir de la variété Koroneiki Influence du site d’origine sur plusieurs paramètres chimiques. Olivae. 81: 20-25. Los, D. A. and N. Murata. 1998. Structure and expression of fatty acid
desaturases. BBA-Lipid. Lipid Met. 1394: 3-15.
Manai-Djebali, H., D. Krichène, Y. Ouni, L. Gallardo, J. Sánchez, E. Osorio, D. Daoud, F. Guido and M. Zarrouk. 2012. Chemical profiles of five minor olive oil varieties grown in central Tunisia.
J. Food Compos. Anal. 27: 109-119.
Mansouri, F., A. Ben Moumen, G. Richard, M. L. Fauconnier, M. Sindic, H. Serghini-Caid and A. Elamrani. 2015. Phytosterols composition of virgin olive oils from cultivars introduced in eastern Morocco in comparison to Picholine Marocaine. J. Mater. Environ. Sci. 6: 2322-2329.
Mansouri, F., A. Ben Moumen, G. Richard, M. L. Fauconnier, M. Sindic, H. Serghini Caid and A. Elamrani. 2016. Characterization of monovarietal virgin olive oils from introduced cultivars in eastern Morocco. Riv. Ital. Sostanze Gr. 93: 21-30.
Mansouri, F., A. Ben Moumen, G. Richard, M. L. Fauconnier, M. Sindic, H. Serghini Caid and A. Elamrani. 2017. Flavor profiles of monovarietal virgin olive oils produced in the Oriental region of Morocco. OCL. 24: A501.
Mateos, R., J. L. Espartero, M. Trujillo, J. Rios, M. León-Camacho, F. Alcudia and A. Cert. 2001. Determination of phenols, flavones, and lignans in virgin olive oils by solid-phase extraction and high-performance liquid chromatography with diode array ultraviolet detection. J. Agric. Food. Chem. 49: 2185-2192.
Minguez-Mosquera, M. I., B. Gandul-Rojas, J. Garrido-Fernandez and L. Gallardo-Guerrero. 1990. Pigments present in virgin olive oil. J. Am. Oil Chem. Soc. 67: 192-196.
Minguez-Mosquera, M. I., L. Rejano-Navarro, B. Gandul-Rojas, A. H. SanchezGomez and J. Garrido-Fernandez. 1991. Color-pigment correlation in virgin olive oil. J. Am. Oil Chem. Soc. 68: 332-336.
Morelló, J. R., M. J. Motilva, M. J. Tovar and M. P. Romero. 2004. Changes in commercial virgin olive oil (cv Arbequina) during storage, with special emphasis on the phenolic fraction. Food Chem. 85: 357-364.
Morelló, J. R., M. P. Romero and M. J. Motilva. 2006. Influence of seasonal conditions on the composition and quality parameters of monovarietal virgin olive oils. J. Am. Oil Chem. Soc. 83: 683-690. Ollivier, D., J. Artaud, C. Pinatel, J. P. Durbec and M. Guérere.
2006. Differentiation of French virgin olive oil RDOs by sensory characteristics, fatty acid and triacylglycerol compositions and chemometrics. Food Chem. 97: 382-393.
Owen, R. W., W. Mier, A. Giacosa, W. E. Hull, B. Spiegelhalder and H. Bartsch. 2000. Identification of lignans as major components in the phenolic fraction of olive oil. Clin. Chem. 46: 976-988. Palese, A. M., V. Nuzzo, F. Favati, A. Pietrafesa, G. Celano and
C. Xiloyannis. 2010. Effects of water deficit on the vegetative response, yield and oil quality of olive trees (Olea europaea L., cv Coratina) grown under intensive cultivation. Sci. Hortic. 125: 222-229.
Piscopo, A., A. De Bruno, A. Zappia, C. Ventre and M. Poiana. 2016. Characterization of monovarietal olive oils obtained from mills of Calabria region (Southern Italy). Food Chem. 213: 313-318.
Poiana, M. and A. Mincione. 2004. Fatty acids evolution and composition of olive oils extracted from different olive cultivars grown in Calabrian area. Grasas y Aceites. 55: 282-290. Romero, M. P., M. J. Tovar, T. Ramo and M. J. Motilva. 2003. Effect of
crop season on the composition of virgin olive oil with protected designation of origin “les garrigues”. J. Am. Oil Chem. Soc. 80: 423-430.
Rotondi, A. and M. Magli. 2004. Ripening of olives var. Correggiolo: Modification of oxidative stability of oils during fruit ripening and oil storage. J. Food Agric. Environ. 2: 193-199.
Salas, J. J., J. Sánchez, U. S. Ramli, A. M. Manaf, M. Williams and J. L. Harwood. 2000. Biochemistry of lipid metabolism in olive and other oil fruits. Prog. Lipid Res. 39: 151-180.
Salvador, M. D., F. Aranda, S. Gómez-Alonso and G. Fregapane. 2003. Influence of extraction system, production year and area on Cornicabra virgin olive oil: A study of five crop seasons. Food Chem. 80: 359-366.
Stefanoudaki, E., K. Chartzoulakis, A. Koutsaftakis and F. Kotsifaki. 2001. Effect of drought stress on qualitative characteristics of olive oil of cv Koroneiki. Grasas y Aceites. 52: 202-206. Tura, D., C. Gigliotti, S. Pedò, O. Failla, D. Bassi and A. Serraiocco.
2007. Influence of cultivar and site of cultivation on levels of lipophilic and hydrophilic antioxidants in virgin olive oils (Olea europea L.) and correlations with oxidative stability. Sci. Hortic. 112: 108-119.
Uceda, M. and M. Hermoso, 1998. La calidad del aceite de oliva. In: Barranco, D., R. Ferna`ndez-Escobar and L. Rallo (Eds.), El cultivo del olivo, Junta de Andalucia Ediciones Mundi-Prensa, Spain, pp. 547-572.