Discrimination thresholds of the reverberation in large
volumes by na¨ıve listeners
A. Billon
aand J.-J. Embrechts
ba
Laboratoire d’´
Etude des Ph´enom`enes de Transfert et de l’Instantan´eit´e : Agro-industrie et
Bˆatiment, Bˆatiment Fourier Avenue Michel Cr´epeau F-17042 La Rochelle Cedex 1
b
University of Liege - Acoustics Labo, Campus du Sart-Tilman, B28, B-4000 Liege 1, Belgium
Reverberation is one of the main perceptual dimensions allowing to rate and to discriminate the acoustics of rooms. Several studies concerning its perceptive threshold have been carried out previously. The resulting threshold values are somewhat scattered, varying between 4% and more than 20%. These studies differ in terms of sound stimuli, length of the reverberation, experiment design and experience of the subjects. In this study, a comparison and an adjustment experiments were carried out using three sound stimuli: white noise, male spoken words and an or-chestral extract. The room impulse responses used in these comparisons are characterized by frequency-dependent decays. The reverberation time at 1000Hz of the mean impulse response was 1,89s which is representative of a medium size concert hall. The subjects were students with half of them playing a musical instrument regularly. They had no prior experience in terms of perceptual audio testing. A differentiation threshold around 10% is ob-tained, varying slightly with the experimental conditions and the sound stimuli. The thresholds obtained for speech signals were lower of about 2% than those obtained for white noise and the orchestral piece of music.
1
Introduction
Perceptive dimensions allowing a listener to rate and dis-criminate the acoustics of a room are few [1, 2, 3, 4]. Three main dimensions can be listed: reverberance (perceived re-verberation) [5], spatial impression (source width and lis-tener envelopment) [3, 4] and sound strength [1, 4]. Rever-berance can be related to two room-acoustics objective pa-rameters: reverberation time [3, 4] or early decay time [1].
Several studies aim to determine the perceptual thresh-old of reverberance [6, 7, 8, 9, 10]. The obtained values are somewhat spread, varying from to 3% up to 39%. How-ever, these studies differ in term of tested reverberation time, sound stimuli and experimental set-up and some contradic-tory results can thus be pointed out.
Concerning the length of the reverberation time, Seraphim [6] found that it has no influence. Karjelainen [7] confirmed this result in one experience but not in another one. Simi-larly, Karjelainen [7] highlighted an impact of the nature of the sound stimuli on the threshold whereas Frissen et al. [10] found no effect. Using music extracts, Meng et al. [9] even observed an effect of the used motifs. Outside of other pa-rameters, the experimental set-up has also an influence on the measured threshold [9, 10].
Otherwise, the applicability of these results to real-life room-acoustics could appear somewhat limited. In fact, the created impulse responses in all the presented studies consist in frequency independent exponential decay. On the other hand, the impulse responses recorded in real rooms are gen-erally frequency dependent and their decays can depart from an exponential one.
In this study, more realistic frequency varying impulse re-sponses based on ray-tracing simulation of a concert hall are used. These impulse responses are convoluted with three dif-ferent sound extract (white noise, human speech and a music extract). The experiment are conducted following two proto-cols. In the first experiment, the subject must judge the rever-beration of two stimuli are equal or not. During the second experiment, the subject must match a varying sound stimuli to a reference.
2
Sound stimuli
2.1
Sound extracts
During the experiments, three different sound extracts, each during 4s, are used: white noise, human speech and orchestral music. The white noise was generated using Mat-lab. The human speech was recorded in an anechoic cham-ber. The orchestral extract is an extract of the II movement
of the Bruckner’s symphony no. 8. It was created by multi-plying and mixing anechoic recordings of each instruments [11] as described in [12]. For the humaan speech, the sound energy is concentrated between 100 and 1000Hz whereas it is spread from 100Hz to 4000Hz for the orchestral extract.
2.2
Room impulse responses
The impulse responses are the results of modified results of a ray-tracing simulation [13]. The simulated concert hall is the Groser Musikvereinsaal in Vienna [1] whose acous-tic quality is well known. Firstly, the geometry of the hall was created and simulations were carried out using the Sal-rev ray-tracing software [14]. The measured and computed reverberation times are presented in Table 1, varying between 1.62s and 2.25s depending on the frequency. For each octave band, the slope of the sound decay is then varied after the direct sound between -15% and+15% as a post-processing. The same relative variation is applied to each octave band. The acoustic stimuli are created by convolving the anechoic
Table 1: (C) Computed and (M) measured [1] reverberation times as a function of the octave band of the Grosser
Musikvereinsaal.
Freq. (Hz) 125 250 500 1000 2000 4000
M (s) 2.28 2.17 2.04 1.90 1.80 1.62
C (s) 2.25 2.13 1.94 1.89 1.81 1.62
extracts with the room impulse responses using the auraliza-tion [15] software Auralias [16]. To permit a more realis-tic sound rendering through headphones, head related trans-fer functions are applied. Moreover, the obtained stimuli are equalized in terms of loudness. Thus, more than 120 sound stimuli lasting 6s are created.
3
Experimental apparatus
The experiments were carried out using a laptop com-puter and a Sennheiser HD-25-1 headphones in a small neu-tral room (without windows). After the training period, each participant was alone limiting the interference of the experi-menter. For each experiment and the training period, specific Matlab interfaces were created enabling to read the sound extracts and record the responses. These interfaces also dis-played the instructions of the experiments.
4
Training period
Firstly, reverberation was briefly introduced to the sub-ject. After this stage, a training period followed. On a Matlab interface, a pair of stimuli was presented to the subject. He must identify the more reverberant one. A first set included pair with difference of 20% then, after 10 correct answers, a second set with 15% difference was proposed. After, 10 correct answer the training period was ended. In the case of incorrect answer, the same pair was again proposed but with randomly shifting the order of the stimuli.
5
First experiment
5.1
Procedure
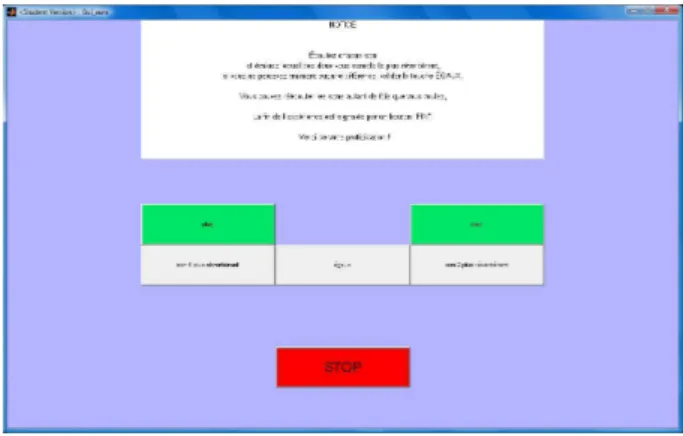
A sound pair was presented to the subject and he was asked to identify the more reverberant one or to judge them equal. At the beginning of the process, the reverberation ference is equal to ± 15%. At each correct answer, the dif-ference is decreased, up to 1%. When the answer was in-correct, the process restarted at the beginning ( ± 15%) For each sound extract (speech, white noise, music), the process started alternatively three times at+ 15% and three time at - 15%. The sound extracts were presented randomly to each subject. So, 6 values of the threshold were obtained for each sound extract at the end of the experiment. In average, the experiment lasted 25 minutes. Fig. 1 presents the used Mat-lab interface.
Figure 1: Interface of experiment 1.
5.2
Participants
. 15 subjects participated to this experiment. They re-ported normal hearing and their average age was about 21.6 years. One third of the subjects plays regularly a musical instrument however, no subject reported to regularly go to non-amplified music concerts.
5.3
Results
The results are presented in Fig. 2. The effect of vari-ation direction seems to have a weak effect on the thresh-old and slightly lower values can be observed for the speech compared to the other sound extract. The obtained median values are presented in Table 2. A ANOVA-2WAY is used to investigate the effects of the direction of variation and of
the nature of sound extract. For the direction of the varia-tion (up or down), a p − value = 0.741 is obtained which implies that the the threshold is not affected the direction of the variation. Similarly, a p − value = 0.569 indicates that there is no interaction direction/nature of the extract. On the other hand, the p − value for the variable nature of the sound extract is equal to 0.0414. As a post-hoc, a Student test with Bonferri’s correction is carried out and permit to observe that the orchestral extract and the speech have significantly di ffer-ent mean values. Otherwise, the same behavior is observed for the subject playing musical instruments compared to the other participants.
Figure 2: Values of the threshold obtained for Experiment 1 with (Or) the orchestral extract, (WN) the white noise and
(Sp) the speech. in indicates that the process was started with a difference equal to - 15% and de indicates that the process started with a difference equal to + 15%.The bold
line represents the median value, the box the lower and upper quartiles values, the whiskers the minimum and
maximum.
Table 2: Median values of the thresholds obtained with experiment 1 for (Or) the orchestral extract, (WN) the white
noise and (Sp) the speech. in indicates that the process was started with a difference equal to - 15% and de indicates that
the process started with a difference equal to + 15%.
Or in Or de WN in WN de Sp in Sp de
12.7% 12.2% 12.5% 12.3% 9.7% 11%
6
Second experiment
6.1
Procedure
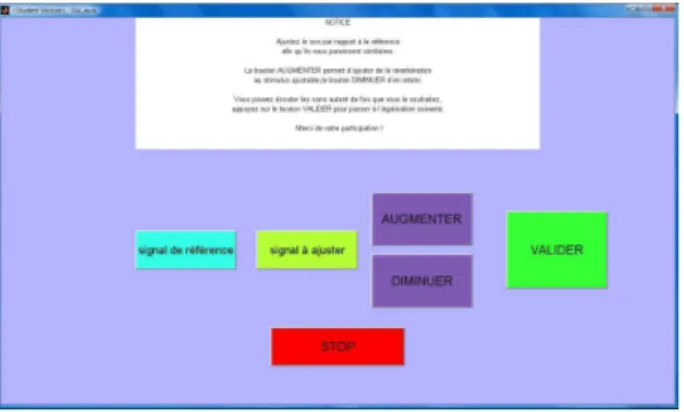
In this experiment, a reference stimulus was clearly indi-cated and the subject was asked to vary the amount of rever-beration of a second stimulus in order to perceptively match the stimulus. When the amount of reverberation is then recorded. The process was carried out 6 times for each sound extract: three times starting from - 15% and three times starting from + 15%. The starting point was randomly chosen. The subject must do the task for each sound extract and again, the order
of sound extracts was randomly chosen. Fig. 3 presents the used Matlab interface.
Figure 3: Interface of experiment 2.
6.2
Participants
14 subjects participated to this experiment. They reported normal hearing and their average age was about 22.5 years. No subject reported to play regularly a musical instrument or to go regularly to non-amplified music concert.
6.3
Results
In this experience, the speech extract exhibits again slightly lower values of the observed threshold (Fig. 4). Otherwise, he effect of variation direction seems to be weak apart for the speech extract. The obtained median values are presented in Table 3. A ANOVA-2WAY is again used to investigate the effects of the direction of variation and of the nature of sound extract. The direction of the variation does not affect the ob-tained threshold (p − value = 0.644). On the other hand, the value of the threshold is affected by the nature of sound extract (p − value= 0.017), however there is no interaction between the direction of the variation and the nature of the extract. A similar post-hoc analysis to Experiment 1 permits to observe that the speech extract leads to a mean value sig-nificantly different than the ones obtained with the orchestral extract and the white noise.
Table 3: Median values of the thresholds obtained with experiment 1 for (Or) the orchestral extract, (WN) the white
noise and (Sp) the speech. in indicates that the process was started with a difference equal to - 15% and de indicates that
the process started with a difference equal to + 15%.
Or in Or de WN in WN de Sp in Sp de
10.3% 10.7% 11.8% 11% 10.3% 7.8%
7
Conclusion
Reverberance, the perceived reverberation by a listener, is one of the mains perceptual dimensions allowing to rate and discriminate the acoustics of rooms. The previous stud-ies were limited to frequency invariant sound decays and of-ten to exponentially decreasing sound decays. In this study, more realistic frequency varying room impulse responses are
Figure 4: Values of the threshold obtained for Experiment 1 with (Or) the orchestral extract, (WN) the white noise and
(Sp) the speech. in indicates that the process was started with a difference equal to - 15% and de indicates that the process started with a difference equal to + 15%.The bold
line represents the median value, the box the lower and upper quartiles values, the whiskers the minimum and
maximum.
used. The obtained thresholds concerning the reverberance, about 10%, are in a good agreement with those obtained by Frissen et al. [10]. However, they observed that the com-puted value of the threshold are independent on the tested sound. In this study, the speech extract permits to obtain sig-nificantly lower values that the orchestral extract or the white noise. On the other hand, the direction of the variation (more or less reverberation) has no effect while Meng et al. [9] re-ported a weak effect on their obtained threshold. Moreover, it can be observed that the obtained values are dependent on the experimental protocol: Experiment 2 allows one to ob-tained slightly lower values of the threshold compared to ex-periment 1. It should remembered that the subjects can be considered as naive, without previous experiences concern-ing perceptual audio testconcern-ing. Moreover, no subject reported to regularly go to non-amplified concerts.
Acknowledgments
The authors thank Olivier Burton for carrying out the ex-periments.
References
[1] L. Beranek, Concert and opera halls : How they sound, AIP Press, Woodbury (1996).
[2] M. Barron, Auditorium acoustics and architectural de-sign, E& FN Spoon, London (1993).
[3] P. Zahorik, ”Perceptually relevant parameters for vir-tual listening simulation of small room acoustics”, J. Acoust. Soc. Am. 126(2), 776-791 (2009).
[4] S. Cerda, A. Gimenez, J. Romero, R. Cibrian, J.L Mi-ralles, ”Room acoustical parameters: A factor analysis approach”, Appl. Acoustics. 70(1), 97-109 (2009).
[5] M.R Schroeder, D. Gottlob, K.F. Siebrasse, ”Compara-tive study of european concert halls: Correlation of sub-jective preference with geometric and acoustic parame-ters”, J. Acoust. Soc. Am. 56(4), 1195-1201 (1974).
[6] H.P. Seraphim, ”Untersuchungen ¨uber die unter-schiedsschwelle exponentiellen Abklingens von Rauschbandimpulsen”, Acta Acustica united with Acustica 8(2), 280-284 (1958).
[7] M. Karjalainen, H. J¨arvel¨ainen, ”More about this rever-beration science: perceptually good late reverrever-beration”, 111thAES(2001).
[8] T.I. Niaounakis, W.J. Davies, ”Perception of reverbera-tion time in small listening rooms”, J. Audio Eng. Soc. 50(5), 343-350 (2002).
[9] Z. Meng, F. Zhao, M. He, ”The just noticeable dif-ference of noise length and reverberation perception”, ISCIT 06, (2006).
[10] I. Frissen, B.F. Katz, C. Guastavino, ”Effect of sound stimuli on the perception of reverberation in large vol-umes”, ICAD 2009, 358-376 (2010).
[11] T. Lokki, J. P¨atynen, ”Applying anechoic recordings in auralization”, Proc. EAA Symposium on Auralization,1-5 (2009).
[12] L. Wang, M. Vigeant, ”Evaluations of output from room acoustic computer modeling and auralization due to different sound source directionalities”, Appl. Acous-tics. 69(10), 1281-1293 (2008).
[13] H. Kuttruff, Room acoustics 4th ed., Taylor & Francis, London (2000).
[14] J.-J Embrechts, ”Broad spectrum diffusion model for room acoustics ray-tracing algorithms”, J. Acoust. Soc. Am. 107(4), 2068-2081 (2000).
[15] M. Vorl¨ander, Auralization, Springer, Berlin (2007).
[16] L. Bos, J.-J Embrechts, ”An interactive real-time based auralization system for room acoustics implement-ing directional impulse response and multiple audio reproduction modules for spatialization (the auralias project)”, Proc. of NAG/DAGA 2009, Rotterdam, 1459-1462 (2009).