The World Bank Group
Social Protection and Labor Global Practice
Europe & Central Asia Region
PORTRAITS OF LABOR MARKET EXCLUSION 2.0
Country Policy Paper (CPP) for Poland
Lead Authors: Frieda Vandeninden and Karolina Goraus-Tanska
Project team: Aylin Isik-Dikmelik (Team Leader), Mirey Ovadiya (Team Leader),
Sandor Karacsony, Karolina Goraus-Tanska, Natalia Millán, and Frieda Vandeninden
July 2017
Public Disclosure Authorized
Public Disclosure Authorized
Public Disclosure Authorized
Portraits of Labor Market Exclusion 2.0
© 2017 International Bank for Reconstruction and Development / The World Bank 1818 H Street, NW
Washington, DC 20433 Telephone: 202-473-1000
Internet: www.worldbank.org
The findings, interpretations, and conclusions expressed here do not necessarily reflect the views of the Executive Directors of The World Bank or the governments they represent. The World Bank does not guarantee the accuracy of the data included in this work. The boundaries, colors, denominations, and other information shown on any map in this work do not imply any judgment on the part of
The World Bank concerning the legal status of any territory or the endorsement or acceptance of such boundaries.
The European Commission support for the production of this publication does
not constitute endorsement
of the contents which reflects the views only of the
authors, and the Commission cannot be held responsible for any use which may be made of the information contained therein.
Rights and Permissions
The material in this work is subject to copyright. Because the World Bank encourages dissemination of its knowledge, this work may be reproduced, in whole or in part, for noncommercial purposes as long as full attribution to this work is given. Any queries on rights and licenses, including subsidiary rights, should be
addressed to the Office of the Publisher, The World Bank, 1818 H Street NW, Washington,
DC 20433, USA; fax: 202-522-2422; e-mail: pubrights@worldbank.org.
Photos: © World Bank
Portraits of Labor Market Exclusion 2.0
3
Acknowledgements
This report was produced by a World Bank team co-led by Aylin Isik-Dikmelik (Senior Economist) and Mirey Ovadiya (Senior Social Protection Specialist) including Frieda Vandeninden (Economist), Karolina Marta Goraus (Economist), Natalia Millan (Economist), and Sandor Karacsony (Economist). This report is one of the twelve country specific papers produced under a joint European Commission (EC) World Bank and Organisation for Economic Cooperation and Development (OECD) project and applies a joint methodology on country specific cases as developed in OECD-World Bank (2016). This report would not have been possible without the financial and technical support of the EC’s Directorate General of Employment, Social Affairs and Inclusion. Katalin Szatmari (Policy Officer, Directorate C1-Social Investment Strategy), led the efforts from the Directorate General of Employment, Social Affairs and Social Inclusion. Herwig Immervoll (Senior Social Policy Economist, ELS/SPD) led the OECD team to undertake the activities under the project in six countries. The European Commission team included Suzanna Conze (Policy Officer, formerly Directorate C1-Social Investment Strategy), Manuela Geleng (Head of Unit, Directorate C1-Social Investment Strategy), Ioana-Maria Gligor (Deputy Head of Unit, B5-Employment), Georgi Karaghiozov (Policy Officer, Directorate C1-Social Investment Strategy), Dora Krumova (Programme Manager, B5-Employment), Katharina Muhr (Policy Officer-Directorate C5-Employment), Raya Raychinova (Program Assistant, B5-Employment), Alexandra Tamasan (Policy Officer, formerly Directorate C1-Social Investment Strategy), Georgios Taskoudis (Policy Officer, C4-Employment), Miriam Toplanska (Policy Analyst, Directorate C1-Social Investment Strategy), and Iva Zelic (Policy Officer, Directorate C5-Employment). The OECD team included James Browne, Nicola Düll, Rodrigo Fernandez, Daniele Pacifico, and Céline Thévenot. The team is grateful to the EC and OECD teams for the close collaboration exhibited under this project.
Andrew D. Mason (Practice Manager, Europe and Central Asia Social Protection and Jobs Practice), Arup Banerji (Regional Director, European Union) and Cem Mete (Practice Manager, Europe and Central Asia Social Protection and Jobs Practice) provided overall guidance to the study. Peer review comments were received at various stages from Christian Bodewig (Program Leader), Aline Couduel (Lead Economist), Victoria Levin (Senior Economist), Matteo Morgandi (Senior Economist), Cristobal Ridao-Cano (Lead Economist), Victoria Strokova (Economist), Ramya Sundaram (Senior Economist); and Trang Van Nguyen (Senior Economist).
The team benefitted from extensive interaction and consultations with representatives of Ministry of Family, Labor and Social Policy and Public Employment Services. In particular, the team would like to thank, Malgorzata Sarzalska, Tomasz Jegier, Monika Siergiejuk, Aleksandra Jawornicka-Nowosad, and Maciej Banaś, who provided guidance, data and specific inputs towards the finalization of the report.
Finally, the team is grateful to Eurostat for the provision of the EU-SILC micro data used in the analysis in this report.
Portraits of Labor Market Exclusion 2.0
4
Contents
Acknowledgements ... 3
1. Introduction ... 6
2. Country context: The Polish labor market ... 7
3. Understanding employment barriers – A framework ... 16
3.1 Population of analysis: Individuals with potential labor market difficulties ... 17
3.2 Employment Barrier Indicators ... 21
4. Results of the analysis: Portraits of labor market exclusion in Poland ... 26
5. Priority groups in the Polish labor market... 33
6. Policies and measures targeting the employment barriers of priority groups ... 39
6.1 Framework and approach ... 39
6.2 Overview of activation and employment support programs and policies ... 40
6.2.1 Institutional and policy context... 40
6.2.2 Overview of ALMP programs ... 45
6.3 Activation and employment support policies vis-à-vis priority groups’ needs ... 51
7 Conclusions and Policy Directions ... 59
References ... 62
Annex 1. Advantages and disadvantages of the EU-SILC Data ... 66
Annex 2: Definitions of Employment Barrier Framework Indicators ... 68
Annex 3: Latent Class Analysis results of EU SILC 2013 respondents who are out-of-work or marginally employed ... 71
Annex 4. Latent Class Analysis model selection for Poland ... 76
Annex 5. Categorization and Definitions of Labor Market Programs based on Eurostat ... 79
Annex 6. Detailed list of labor market services and measures: Typologies, spending, and coverage for Poland ... 80
Tables
Table 1. Characterization of the target population and working-age population, according to barrier indicators (percent) ... 24Table 2. A cross-country comparison of barriers faced by the target groups ... 25
Table 3. Employment barriers faced by excluded groups in the Polish labor market ... 27
Table 4: The priority groups’ employment barriers and characteristics ... 34
Figures
Figure 1: Employment (ages 15 to 64) in Poland and EU-28 ... 8Portraits of Labor Market Exclusion 2.0
5
Figure 2: Unemployment (ages 15 to 64) in Poland and EU-28 ... 9
Figure 3: Unemployment among the population (ages 15 to 64), by education level ... 10
Figure 4: Activity rates by sex and age in Poland (POL) and EU-28 ... 11
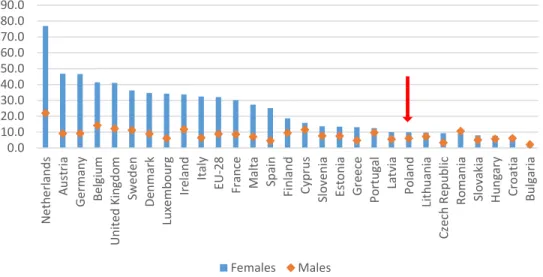
Figure 5: Part-time employment as a percentage of total employment by sex, EU member states, and 2015 ... 12
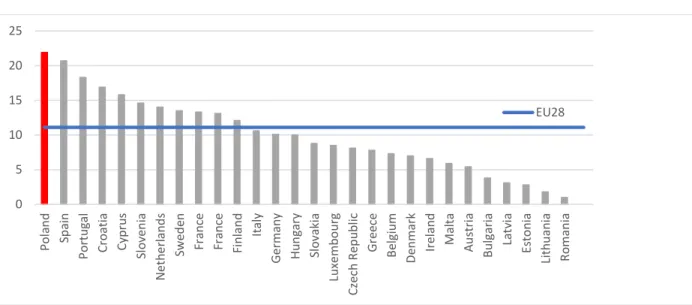
Figure 6: Temporary employees as a percentage of total employees, EU member states ... 13
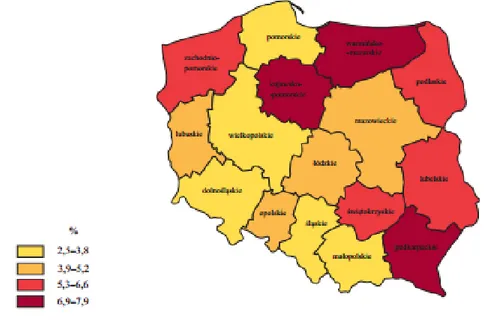
Figure 7: Long-term unemployment rates by voivodships as of September 2016 ... 14
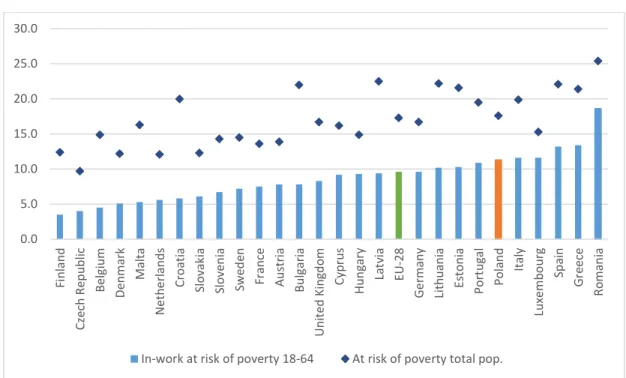
Figure 8: At-risk-of-poverty and in-work at-risk-of-poverty rates in EU member states, 2015 ... 15
Figure 9. Population by sex and age in 2015 and projection for 2050, Poland ... 16
Figure 10: The composition of the working-age population in Poland (left) and out of work (right)19 Figure 11. Labor market attachment status of working-age* population, Poland and other EU countries under study (percent) ... 20
Figure 12. Composition of the persistently out of-work population by labor market status, Poland and other EU countries under study (as a percentage of working age) ... 21
Figure 13: Employment Barrier Framework ... 22
Figure 14. Latent groups within the Polish target population... 26
Figure 15. Number of barriers faced by individuals in latent groups ... 28
Figure 16: Linkages between Employment Barriers and AESPs ... 40
Figure 17. Composition of labor market spending as percentage of GDP) ... 46
Figure 18. Detailed composition of labor market programs, in percentage of total labor market expenditure, 2014 ... 47
Figure 19. Number of beneficiaries (entrants) of selected ALMPs ... 49
Figure 20. Profile of ALMPs beneficiaries by age and gender, as a share of total beneficiaries (2015) ... 50
Figure 21. Profile of ALMPs beneficiaries by duration of unemployment and urbanization, as a share of total beneficiaries (2015) ... 51
Boxes
Box 1: Definition of target population ... 18Box 2. Definitions of employment barrier indicators used for Poland ... 23
Portraits of Labor Market Exclusion 2.0
6
1. Introduction
Successful labor market inclusion requires a better understanding of who the labor market vulnerable are. People who are out of work are not all the same: they can be middle-aged individuals and early retirees, as well as young adults neither working nor receiving education. At the same time, there may be other types of vulnerability in the labor market: some people take part in temporary or unstable employment, work a reduced number of hours, or earn very low incomes despite being engaged in full time work. Considering the priorities of the inclusive growth pillar of the Europe 2020 Strategy1, and potential negative impacts of labor market vulnerability on long-term growth, it is worth examining who the labor market vulnerable in Europe are and why they are out of work or are precariously employed. While some statistics on broad groups (youth) exist, deeper analysis, in particular on the diverse barriers faced by the labor market vulnerable in conjunction with other characteristics, is needed and would constitute an important step forward towards better labor market inclusion.
In this context, Portraits of Labor Market Exclusion-2—a joint study between the European Commission (EC), the World Bank, and the Organization for Economic Cooperation and Development (OECD)2—aims to inform employment support, activation, and social inclusion
policy making, through an improved understanding of labor-market barriers. Covering 12 countries3, the study builds on the previous joint EC and World Bank study to map the diversity of profiles of individuals who are out of work in six countries (Sundaram et al., 2014) and other analyses that characterize individuals with labor market difficulties (European Commission, 2012; Ferré et al., 2013; Immervoll, 2013). The study expands the previous analysis by looking at a broader group of labor market vulnerable beyond the out of work to include: those in unstable employment, those with restricted hours, and those with near-zero incomes (i.e. marginally employed individuals). It also refines the analytical methodology by applying an employment barriers framework to facilitate policy making and country-specific application, and to provide a reference point for future methodological extensions.
Utilizing an advanced statistical method (latent class analysis), the study separates out of work and marginally employed individuals into distinct groups with respect to types of employment barriers faced. This approach facilitates discussions on the strengths and limitations of existing policy interventions for concrete groups of beneficiaries, and helps inform policy decisions on whether and how to channel additional efforts towards specific groups.
Addressing the same barrier may require a different set of policies according to the characteristics of the identified groups. For example, while not having recent work experience may be an employment barrier faced by many individuals, it may require a different approach for
1 Where all European governments have committed to increasing the employment rate (European Commission, 2010).
2 The activities of the “Understanding Employment Barriers” are financed through separate agreements
between the EC and the World Bank and the EC and the OECD respectively. The respective agreements with the EC are titled “Portraits of Labor Market Exclusion 2.0” (EC-World Bank) and “Cooperation with the OECD on Assessing Activating and Enabling Benefits and Services in the EU” (EC-OECD).
3 The existing analysis in Bulgaria, Estonia, Greece Hungary, Lithuania, and Romania is updated, broadened,
and refined with the new methodology; Croatia, Ireland, Italy, Poland, Portugal, and Spain are analyzed for the first time.
Portraits of Labor Market Exclusion 2.0
7 inactive mothers compared to young unemployed men. It is therefore important to relate each barrier to specificities of each group. Thus, the study further delves into the results of the latent class analysis (LCA) for the priority groups that are identified in close collaboration with the corresponding country counterparts. Consequently, the study presents a richer and deeper understanding of the barriers, beyond what could be glimpsed through traditional statistics. It also provides an assessment of the adequacy of the policies and programs that are available to respond to the needs of the priority groups.
The analysis focuses primarily on the supply-side constraints and corresponding policies. While the study recognizes the essential role demand plays in improving labor market outcomes, analysis of these constraints — which requires a comprehensive approach across multiple facets of the economy — is beyond the scope of this study.
The study provides a snapshot of the needs of the labor market vulnerable and relevant policies to inform strategic policy choices and directions. Operationalization of these policy directions (such as improvements in existing programs) requires a sequence of activities including further in-depth analysis using program-level administrative and expenditure data as well as the more commonly used profiling methods. Thus, the conclusions should be interpreted in this light. This Country Policy Paper is one of twelve that is under study4, and analyzes the out of work
and marginally employed population in Poland along with existing activation and employment support policies and programs. The paper comprises consists of seven sections. Section 2 provides background on the Polish labor market. Section 3 describes the framework and the statistical clustering methodology. Section 4 presents the results, including a description of the identified clusters according to labor market barriers and demographic and socio-economic characteristics. Section 5 expands on this information with a more detailed analysis of the groups that, together with the Government of Poland, have been selected as priority groups for policy and program interventions. Section 6 analyzes the current policies and programs that address the needs of the prioritized groups. Finally, section 7 presents conclusions.
2. Country context: The Polish labor market
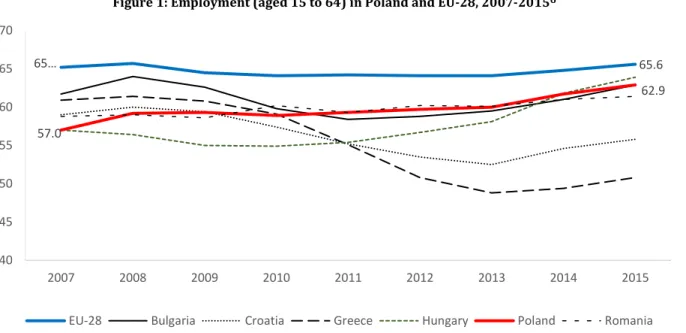
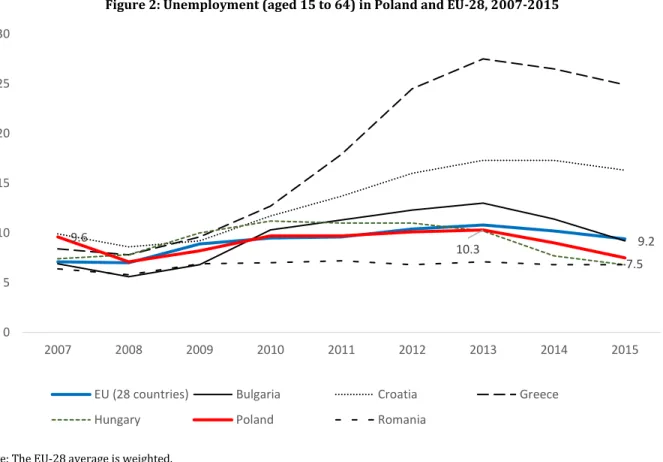
The Polish labor market was not hit particularly hard by the financial crisis; a strong macroeconomic performance and sustained job creation has in fact allowed the labor market to recover in recent years. Employment maintained stability following the crisis, and, in 2015, it reached 61.4 percent, placing it on a path to approaching the EU-28 average of 65.6 percent (Figure 1). The activity rate has also increased continuously since 2006 (63.4 percent), reaching 68.1 percent in 2015 (although this rate is still far below the EU-28 average of 72.5 percent). Although the unemployment rate slowly increased during 2008–2013, peaking at 10.3 percent in 2013, the rate has since then rapidly fallen to 7.5 percent in 2015, reaching pre-crisis levels, making it well below the EU-28 average of 9.4 percent (Figure 2). Recent statistics from the Central Statistical Office of
4 Six Country Policy Papers are led by the World Bank and include: Bulgaria, Croatia, Greece, Hungary, Poland, and
Portraits of Labor Market Exclusion 2.0
8 Poland (GUS) show that the decreasing trend in unemployment has been maintained over 2016 (GUS, 2016a).5
Figure 1: Employment (aged 15 to 64) in Poland and EU-28, 2007-20156
Note: The EU-28 average is weighted.
Source: Eurostat
5 The number of registered unemployed individuals with respect to the active population was 11.5 percent at
the end of September 2015, and 8.3 percent at the end of September 2016. Data presented by GUS are not annual but quarterly. The data look at unemployed individuals ages 18 and older until the age of retirement. The data are therefore not comparable with Eurostat data.
6 The introduction section presents Eurostat figures in which the working age population refers to individuals
between 15 and 64 years old. In the rest of the analysis, the working age population will be restricted to individuals ages 18 to 64. 65… 65.6 57.0 62.9 40 45 50 55 60 65 70 2007 2008 2009 2010 2011 2012 2013 2014 2015
Portraits of Labor Market Exclusion 2.0
9 Figure 2: Unemployment (aged 15 to 64) in Poland and EU-28, 2007-2015
Note: The EU-28 average is weighted.
Source: Eurostat LFS.
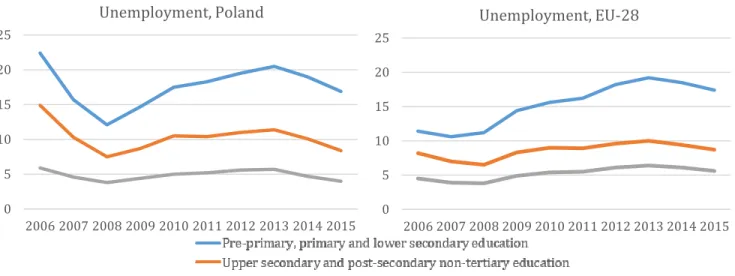
Unemployment is much higher among those with lower education levels. The crisis impacted individuals quite differently according to their level of education. Similar to the overall EU-28 trend, unemployment rates for those with a low level of education in Poland rose significantly from 2008 to 2013; by contrast, the unemployment rate among individuals with a first or second stage of tertiary education suffered a relatively modest increase during the same period (Figure 3). Since 2013, unemployment rates have been decreasing across all education levels. However, differences by education level remain stark: individuals with a lower secondary education or below that level were unemployed at a rate of 16.9 percent in 2015 versus just 4 percent for those with tertiary education. The share of individuals with no more than a lower secondary education degree or basic vocational training continue to have a high total unemployment rate. This group represents 53.6 percent of the total unemployed in 2016 (GUS, 2016a).
9.2 9.6 10.3 7.5 0 5 10 15 20 25 30 2007 2008 2009 2010 2011 2012 2013 2014 2015
EU (28 countries) Bulgaria Croatia Greece
Portraits of Labor Market Exclusion 2.0
10 Figure 3: Unemployment by education level in Poland and EU-28 (aged15 to 64), 2006-2015
Note: The EU-28 average is weighted.
Source: Eurostat LFS.
While economic activity rates have been steadily improving over the past years, they still fall short of the EU-28 average — especially for women. Even though the share of active Poles within the working-age population (ages 15‒64) has been steadily increasing over the years (from 63.1 percent in 2007 to 68.2 percent in 2015), it is still far behind the EU-28 average (72.5 percent in 2015). This low activity is mainly due to the lag in the female employment rate. In 2015, only 56.6 percent of females were employed compared to 69.2 percent of males. Although the rate of male employment in Poland is caching up to the average EU-28 rate (70.8 percent), the employment gap between males and females remains significant, compared to the EU-28 average employment rate for women at 60.4 percent.
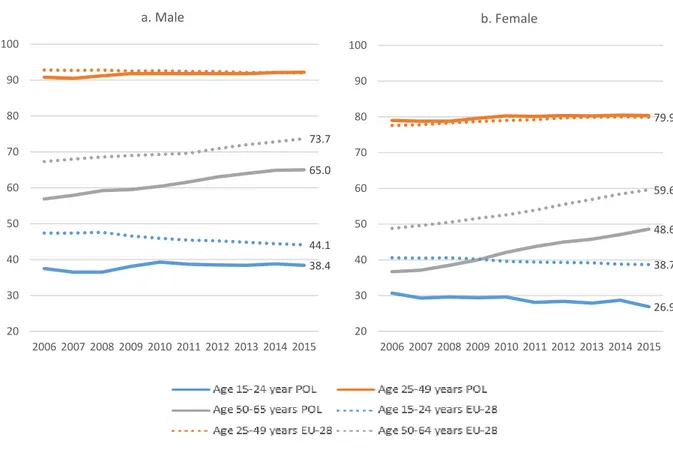
Economic activity rates for Poles in the prime age (25–49 years) of both genders are similar to the EU average; however, significant gaps remain for older age cohorts, especially older women. By contrast, activity rates for Poles 25 to 49 years of age have followed a trend similar to that of the EU-28 average over the last decade, and in 2015, they even reached a higher level (86.4 percent versus 86 percent for EU-28). However, there are important gaps for certain age groups and for women. Older Poles (ages 50 to 64) had been increasing their activity over the last decade, but remain relatively far from the EU-28 average for both genders. The average effective age of retirement in Poland (59.8 years old in 2011) is relatively low compared to other European countries, and is still below the statutory retirement age of 65 for men and 60 for women. The difference with the European average is even more pronounced for older women, with a gap of 11 percentage points (59.6 percent in EU-28 versus 48.6 percent in Poland) (Figure 4). The statutory retirement age for women has been historically low; although it gradually increased since 2013, recent policy
0 5 10 15 20 25 2006 2007 2008 2009 2010 2011 2012 2013 2014 2015 Unemployment, Poland 0 5 10 15 20 25 2006 2007 2008 2009 2010 2011 2012 2013 2014 2015 Unemployment, EU-28
Portraits of Labor Market Exclusion 2.0
11 developments have reverted previous reforms and lowered women’s statutory retirement age to 60 years old and lowered it to 65 years old for men.
Joblessness among youth remains an important concern in Poland; activity rates are below the EU average and activity rates among young women have also recently declined. The crisis has particularly affected youth. The unemployment rate for individuals between 15 and 24 year olds has increased by 10 percentage points during the 2008 and 2013 timeframe. Since 2013, however, the youth unemployment rate has decreased to 20.8 percent. Nonetheless, activity rates for both males and females are still not catching up to the EU average (Figure 4). Among young women the activity rate is even trending downward over the last two years, reaching only 26.9 percent in 2015 (versus 38.4 for males) and further widening the gender gap. The risk of becoming jobless after giving birth to a child is relatively high in Poland, due to shortages in the provision of early childcare as a public service (the share of children under 3 years in formal childcare was only 5.4 percent in 2015, which is the one of the lowest among the EU, with the EU28 average of 30.3 percent) (Eurostat 2017).
Figure 4: Activity rates by sex and age in Poland (POL) and EU-28, 2006-2015
Note: The EU-28 average is weighted.
Source: Eurostat LFS.
Low activity rates among women, youth, and older individuals may also reflect a labor market that is not conducive to voluntary part-time work. Voluntary part-time work allows individuals to combine work with other activities, such as education, training, or caring for children or other
38.4 65.0 44.1 73.7 20 30 40 50 60 70 80 90 100 2006 2007 2008 2009 2010 2011 2012 2013 2014 2015 a. Male 26.9 48.6 38.7 79.9 59.6 20 30 40 50 60 70 80 90 100 2006 2007 2008 2009 2010 2011 2012 2013 2014 2015 b. Female
Portraits of Labor Market Exclusion 2.0
12 family members. It also allows older people or individuals with disabilities to more easily accommodate their physical limitations, or younger retirees to continue to be engaged in work while pursuing more leisure activities. Poland has a low level of part-time work activity as a percentage of total employment compared to other EU countries. This implies that many individuals who may be interested in working, but cannot take on a full-time job, are likely to be excluded from the labor market. Low average wages in Poland partly explain why few polish can afford a to work part-time. Similar to other EU countries, part-time work is primarily selected by women as a way to combine work with family and childcare responsibilities. In 2015, 9.9 percent of the total female employment was made up of part-time workers, whereas part-time male workers were only 6 percent of total male employment (Figure 5).
Figure 5: Part-time employment as a percentage of total employment by sex, EU member states, 2015
Note: The EU-28 average is weighted.
Source: Eurostat LFS.
The decline in unemployment has been mainly driven by proliferation in temporary contracts, which in turn, exacerbates labor market duality in Poland. The use of temporary contracts (including both civil law contracts and fixed-term labor contacts) became widespread in the early 2000s while Poland experienced high unemployment rates (in 2006, Poland’s unemployment rate was about 6 percentage points higher than the EU-28 average of 8.2 percent).7 Between 2001 and 2014, the number of workers hired through temporary contracts increased by 2.3 million, while the number of permanent workers decreased by 0.2 million; overall, temporary
7 Temporary employment encompasses both civil contracts (CCs) and fixed-term labor code contracts (FTLCs).
FTLCs provide similar benefits as indefinite duration labor code contracts (IDLCs), except that they have different termination rules. In contrast, CCs that are flexible forms of employment are not regulated by the labor code, carry a narrow set of benefits, no protection against dismissal, and limited or no accrual of pension rights. The two main forms of CCs are commission contracts (pol. umowa zlecenia), and contracts of result (pol.
umowa o dzieło). Although commission contracts, after recent reforms, have a statutory hourly minimum wage
and obligatory social security contributions (up to the level of minimum wage), contracts of result remain fully flexible, and do not carry any benefits (including health insurance).
0.0 10.0 20.0 30.0 40.0 50.0 60.0 70.0 80.0 90.0 N e th e rl an d s A u str ia G e rman y Bel gi u m Un ite d Kin gd o m Sw ed en De n mark Lu xe mb o u rg Ire lan d Italy EU-28 Fran ce Mal ta Sp ain Fi n lan d Cyp ru s Sl o ve n ia Es to n ia G re ec e Po rt u gal La tv ia Po la n d Li th u an ia Cz ec h R ep u b lic R o man ia Sl o vakia H u n gary Cro ati a Bul gari a Females Males
Portraits of Labor Market Exclusion 2.0
13 employment represents the net employment growth of the past decade (Gatti et al., 2014). In 2015, the share of temporary employees compared to the total number of employees reached 22 percent, the highest level among EU-28 countries (Figure 6). This increase has created a high duality on the Polish labor market as temporary contracts (in particular, civil law contracts) provide limited benefits to workers, but little or no social protection and low job security. The relatively low level of unemployment does not reflect the potential precarity risks associated with those contracts, which include the absence of a transition to a permanent job, the disincentive of employers to invest and train workers, and the consecutive human capital erosion, and the low wages.
Figure 6: Temporary employees as a percentage of total employees, EU member states, 2015
Note: The EU-28 average is weighted.
Source: Eurostat LFS.
The Polish labor market is fragmented at the regional level, with clear differences across municipalities and urban versus rural areas. The unemployment rate in rural areas is 11 percentage points higher than in urban areas (25.6 percent versus 14.7 percent in 2015). Historically, certain municipalities (voivodships) have been more affected by unemployment, particularly long-term unemployment. The overall share of long-long-term unemployment is lower than the EU-28 average (3 percent versus 4.5 percent). However, from a regional perspective, some voivodships exhibit unemployment rates at least twice as high as the national average (Figure 7). The duality between rural and urban areas is further exacerbated by low rate of internal mobility of labor (World Bank 2015b). 0 5 10 15 20 25 Po la n d Sp ain Po rt u gal Cro ati a Cyp ru s Sl o ve n ia N e th e rl an d s Sw ed en Fr an ce Fr an ce Fi n lan d Italy G e rman y H u n gary Sl o vakia Lu xe mb o u rg Cz ec h R ep u b lic G re ec e B el gi u m De n mark Ire lan d Mal ta A u str ia Bu lg ar ia La tv ia Es to n ia Li th u an ia R o man ia EU28
Portraits of Labor Market Exclusion 2.0
14 Figure 7: Long-term unemployment rates by voivodships as of September 20168
Source: GUS, 2016a
In addition to concerns about joblessness, Poles face a high risk of poverty even when they are working. In 2015, in-work poverty — measured according to who meets the at-risk-of-poverty line criteria — was just above the EU-28 average (10.7 percent in Poland versus 9.6 percent in EU-28) (Figure 8). In Poland, in-work poverty is mainly explained by the lack of a secondary earner in a large household, agricultural activities (half of the working poor are employed in agriculture), and low wages. The minimum wage is relatively low, and the share of employees’ compensation in terms of a percentage of GDP is one of the lowest (after Romania and Greece) in the EU-28 (World Bank, 2015; Lewandowski and Kaminska, 2015).
8 The long-term unemployment rate computed by GUS is defined as the share of individuals ages 18 or more
“who stayed in the registers of the county (pol. powiat) labor office for the overall period exceeding 12 months in the last two years, excluding the periods of trainee-ship occupational preparation of adult at the workplace” (GUS 2016, p.21).
Portraits of Labor Market Exclusion 2.0
15 Figure 8: At-risk-of-poverty and in-work at-risk-of-poverty rates in EU member states, 2015
Note: The EU-28 average is weighted; it does not include Ireland, for which data were not available at the time the data were extracted.
Source: Eurostat, EU-SILC 2015.
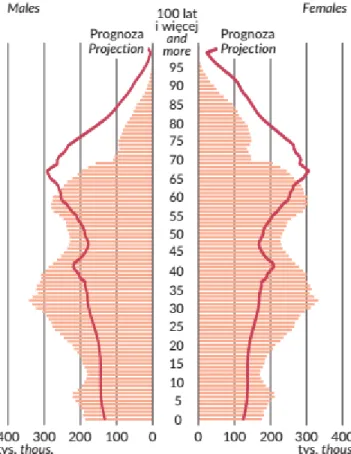
The Polish labor market and the low activity rate among the working-age population are placed at greater risk by demographic challenges. The population is aging rapidly (Figure 9). The old-age dependency ratio has been increasing from 20.9 in 2010 to 31 percent in 2015, and is expected to reach 52 percent in 2050 (European Commission 2012b and GUS 2016).9 Fertility rates are remarkably low and have remained below the simple replacement rate of 2.1 percent, reaching 1.32 in 2015 (Eurostat 2017). In addition, emigration has been increasing over the years; in 2006, about 46,936 Poles left the country; by contrast, 58,837 left in 2016 (Eurostat 2017). The recent outflow of Poles has tended to be compensated for by an exponential increase in immigration; however, the influx of people will not nearly compensate for the downward demographic drivers that will affect the working-age population. These demographic trends will result in fewer workers for the Polish economy, and strain public finances and pensions.
9 Old-age dependency ratio is the ratio between the number of individuals 65 years of age and older (i.e. the
age when people are generally economically inactive) and the number of individuals between 15 and 64 years old. The value is expressed per 100 persons of working age (15–64) (Eurostat definition).
0.0 5.0 10.0 15.0 20.0 25.0 30.0 Fi n lan d Cz ec h R ep u b lic Bel gi u m De n mark Mal ta N e th e rl an d s Cro ati a Sl o vakia Sl o ve n ia Sw ed en Fr an ce A u str ia Bul gari a Un ite d Kin gd o m Cyp ru s H u n gary La tv ia EU-28 G e rman y Li th u an ia Es to n ia Po rt u gal Po la n d Italy Lu xe mb o u rg Sp ain G re ec e R o man ia
Portraits of Labor Market Exclusion 2.0
16 Figure 9. Population in Poland by sex and age in 2015 and projection for 2050
Source: GUS 2016
3. Understanding employment barriers – A framework
Given that there are now fewer workers and more old-age dependents, labor productivity improvements to increase employability and skill sets are key to growing the economy. Growth policies must place at the forefront the need to better utilize Poland’s human capital. Although statistics based on labor force surveys are categorized in broad groups such as “youth,” “older workers,” and “retirees,” these groups within themselves are not internally homogenous; members within each group presumably face a variety of different barriers to employment. Details on the characteristics of these groups, and the obstacles they face are difficult to pinpoint. An effective strategy is to identify groups that share similar employment constraints and socioeconomic characteristics in an effort to design tailored policy interventions.
Fundamental to crafting a holistic approach to policymaking for populations who are inactive or marginally employed is gaining a deep understanding of their characteristics and their barriers for entering the labor market.
Portraits of Labor Market Exclusion 2.0
17 This analysis of Poland yielded categories of out of work and marginally employed individuals into distinct sub-groups based on their socioeconomic characteristics as well as the barriers they face in entering the labor market. Developing narrower and more distinct categories of individuals who share similar characteristics and face similar constraints provided a stronger evidence base to guide the design of activation and employment support policies. This process also helps policymakers view more critically the existing policies and assess their relevance and appropriateness in light of the needs of the target population and priorities.
The rationale behind this exercise is to offer governments — in particular, ministries and agencies in charge of labor and employment policy — a powerful statistical tool that will help shed light on the characteristics of out of work or marginally employed individuals and provide the rationale for how needs should be prioritized. Simply put, this tool will support the design of policies and programs that are suited to the distinct needs of vulnerable individuals with low labor market attachment.
3.1 Population of analysis: Individuals with potential labor market difficulties
The target population — the focus of the current analysis — is a subset of the Polish working age population; this group is 18 to 64 years old, and it excludes full-time students and those serving in the military (compulsory service). The population comprises individuals who self-report being out of work during the entire survey reference period (see Box 1). The people considered to be “out of work” includes those who are persistently out of work (with no labor employment attachment), as well as those who are marginally employed due to unstable jobs, restricted working hours, or very low earnings.10 As such, the analysis offers a much broader perspective than common profiling exercises, which use administrative data collected on registered jobseekers.
This analysis expands upon the scope of traditional profiling exercises. It includes individuals who face difficulties in entering the labor market as well as those who are not working at an optimal level (in terms of stability, number of hours, or job quality), and those who are not covered by any activation measures or registered as unemployed. Set out below are “labor market status” definitions for those individuals included in the analysis, also, as mentioned above, referred to as the target or reference population.
10 The survey data used were EU-SILC 2013 data, where the reference period is equal to the previous calendar
year, i.e., 2012. EU-SILC data is used rather than the LFS due to the opportunity to observe the labor market status of each individual over the course of an entire calendar year as well as the richness of this data on socioeconomic characteristics. The delay in data availability indicates that certain changes in the structure of the labor market may have occurred since then. For a detailed discussion on the advantages and disadvantages of EU-SILC data, see Annex 1. The data used on the policy section is the most recent data available.
Portraits of Labor Market Exclusion 2.0
18 Box 1: Definition of target population
The target population comprises people that are either persistently out of work (no labor attachment) or who are marginally employed. Specifically:
The persistently out of work are individuals reporting being unemployed or inactive—retired, disabled, engaged in domestic tasks, or other—during each of the 12 months of the reference period of the EU-SILC survey (the calendar year prior to the survey year), in addition to at the time of the survey interview.
Marginally employedcan be categorized into three non-mutually exclusive groups*:
• Unstable jobs: individuals reporting work activity for a maximum five months during the reference period. To reconcile information reported for the income reference period and at the moment of the interview, the following individuals are also considered in this group: workers who report no employment or self-employment during the income reference period but who report being employed or self-employed at the moment of the interview, and workers with between 45 percent and 50 percent of work activity during the income reference period who do not report any work activity in either the last month of the income reference period or at the moment of the interview. • Restricted working hours: identified as individuals who spent most or all of the reference period working 20 hours or less a week for the following reasons: illness or disability, family or care duties,
absence of other job opportunities.**We exclude individuals working 20 or fewer hours due to education or training, or for whom the limited working hours is still considered a full-time job. • Negative, zero, or near-zero labor incomes: identified as individuals reporting some work activity
during the income reference period but negative, zero, or near-zero earnings. Specifically, to allow comparison across countries, we adopt the same low-earnings threshold for all countries at EUR 120/month in purchasing power parities with EU-28 as the reference.***
* The three groups are non-mutually exclusive, since, for instance, an individual in an unstable job could be working restricted hours and could also be earning a very low income. However, individuals are assigned to a single category, starting with unstable jobs and ending with negative, zero or near-zero labor incomes as a residual category.
** The threshold is approximately in-line with the 45 percent threshold that identifies the group with unstable jobs, as individuals who work for 20 hours a week have exploited only 50 percent of their full work capacity. EU-SILC collects information on the number of working hours only for the current job at the moment of the interview. The main activity status reported in each month of the income reference period distinguishes between full-time and part-time activities but does not impose a minimum number of working hours in the choice between the two options. We therefore include in the target population only the individuals who are working 20 hours or less a week at the moment of the interview and who spent at least 6 months of the income reference period working in part-time activities.
Portraits of Labor Market Exclusion 2.0
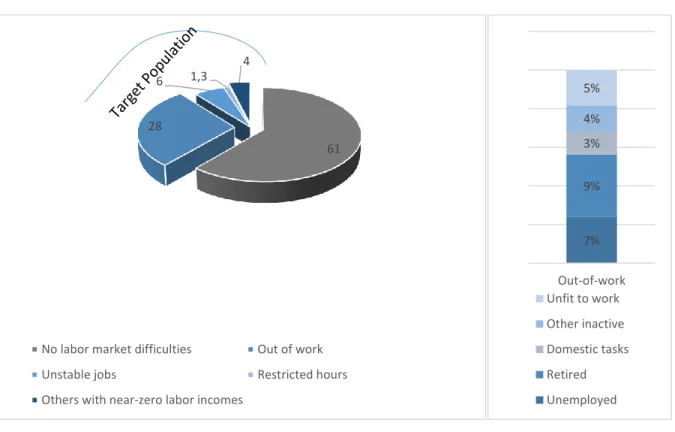
19 The target population represents 39 percent of the working-age Polish and does not include full-time students or those in compulsory military service.11 The remaining 61 percent consists
of individuals with no potential labor market difficulties accessing the labor market and those with “good jobs” (left panel Figure 10). The target population is very heterogeneous and consists of (i) those who are persistently out of work (28 percent) for a variety of reasons including retirement (9 percent), unemployment (7 percent), disability (5 percent), caregiving or domestic duties (3 percent), or other inactivity (4 percent). The target population also includes (ii) those who have unstable jobs (6 percent); (iii) those who have restricted working hours; (1 percent); and (iv) those who have near-zero labor income (4 percent) (Figure 10).
Figure 10: The composition of the working-age population12 in Poland (left) and out of work (right)
Source: World Bank staff calculations based on EU-SILC 2013
Regarding the labor market attachment status of its working-age population, Poland does not stand out from the other EU countries under study (Figure 11). On average, the target population makes up 40 percent of the working-age population of the 12 countries selected to be part of this
11 Note that there were a significant number of observations with no information on activities. These
observations were dropped, because they could not be classified one way or another as having potential labor market difficulties due to lack of activity and other information. These observations did not appear to be systematically missing with respect to other key variables (e.g. region, gender, and so on). Thus, the data were not reweighted.
12The working age population also includes individuals with no major labor market difficulties (61 percent in
Poland), who may be thought of those having relatively good jobs as well as those who are out of work or are marginally employed.
61 28
6 1,3 4
No labor market difficulties Out of work Unstable jobs Restricted hours Others with near-zero labor incomes
7% 9% 3% 4% 5% Out-of-work Unfit to work Other inactive Domestic tasks Retired Unemployed
Portraits of Labor Market Exclusion 2.0
20 study: in Poland, the target population represents 39 percent. The out-of-work also make up around 28 percent of the working-age population, in line with the cross-country average (31 percent). The share of individuals in unstable jobs and having restricted working hours is broadly in line with the average for the other countries too. The share of those with near-zero earnings is slightly above the average.
Figure 11. Labor market attachment status of working-age* population, Poland and other EU countries under study (percent)
* Ages 18-64 and not studying full time or serving compulsory military service.
**Weighted average
Source: World Bank staff calculations based on EU-SILC 2013; EU-SILC 2014 for Greece; OECD Draft Country Policy Paper (forthcoming)
for Portugal
Disaggregating the population that is persistently out of work by labor market status reveals a relatively high share of retirees.13 Figure 12 shows that 9 percent of the working-age population
was retired in Poland, in contrast with 7 percent for the 12 countries. Seven percent of the Polish population of working age is classified as unemployed, which is below the 12-country average of 10 percent. The percentage of working-age individuals reporting to be engaged in domestic tasks in Poland (3 percent) is considerably lower than average (9 percent). Consequently, the total out-of-work population is slightly lower than the 12-country average (28 versus 31 percent). In contrast, the share of individuals with disabilities and “other inactive” is higher than the average.
13The out-of -work refer to individuals who report being unemployed or inactive over the entire reference
period as well as at the time of the survey interview. Labor market status refers to the main activity reported during the reference period.
0% 10% 20% 30% 40% 50% 60% 70% 80% 90% 100% Gr ee ce Ire lan d Cro ati a Sp ain R o man ia Italy Po la n d Po rt u gal H u n gary Bul gari a Li th u an ia Es to n ia A ve rag e* *
No labor market difficulties Persistently out of work Unstable jobs Restricted working hours Near-zero earnings
Portraits of Labor Market Exclusion 2.0
21 Figure 12. Composition of the persistently out of-work population by labor market status, Poland and other EU
countries under study (as a percentage of working age)
*Weighted average.
Source: World Bank staff calculations based on EU-SILC 2013; EU-SILC 2014 for Greece; OECD Draft Country Policy Paper (forthcoming)
for Portugal.
3.2 Employment Barrier Indicators
In order to achieve the purpose of segmenting the target population into distinct groups according to labor market barriers and socioeconomic characteristics a set of indicators has been formulated to capture the employment barriers that prevent individuals from being partially or fully active within the labor market. These indicators represent the following three types of employment barriers, as defined below and illustrated in Figure 13:
• Insufficient work-related capabilities include factors that may limit an individual’s ability to perform certain tasks. These include, for example, low education (as a proxy for skills); low level of work experience; caregiving responsibilities; or limitations in daily activities due to health status.
• Weak economic incentives to look for or accept a “good” job. In this case, an individual may decide not to participate in the labor market if he or she could potentially lose social benefits should he or she accept work or a higher-earning job (substitution effect), or if he or 0 5 10 15 20 25 30 35 40 45 Es to n ia Li th u an ia Bul gari a Po la n d R o m an ia H u n gary Po rt u gal Sp ain Italy Ire lan d Cro ati a G re ec e A ve rag e*
Portraits of Labor Market Exclusion 2.0
22 she already has a high standard of living due to other income sources and can therefore consume more leisure (income effect).
• Scarce employment opportunities, which occur where there is a shortage of vacancies in the relevant labor market segment (geographical area or sector); friction in the labor market due to information asymmetries, skills mismatches, discrimination, lack of social capital, or other frictions are present in labor markets.
Figure 13: Employment Barrier Framework
Source: OECD and World Bank (2016).
The three types of barriers described above cannot be directly observed using survey data. Thus, a set of eight indicators have been carefully constructed using EU-SILC 2013 data in order to proxy for broad measures for each of the three different types of employment barriers. Together, the eight indicators serve as a starting point for identifying and characterizing the target population according to the barriers they face. However, bear in mind that while these indicators are able to capture broad aspects of the three main types of employment barriers identified in this framework, they do not offer a comprehensive view of labor market barriers. The indicators represent the barriers that we are able to capture using EU-SILC data. Moreover, employment barriers are complex and are often the result of the interaction of different individual and household characteristics including gender, age, socioeconomic status, ethnicity, social and cultural norms, as well as frictions in the labor market that we are unable to capture with household data. The indicators used for Poland are outlined in Box 2 below. Additional information on the definitions and construction of each indicator is available in Annex 2, as well as in the joint methodological paper (OECD and World Bank, 2016).
Portraits of Labor Market Exclusion 2.0
23 Box 2. Definitions of employment barrier indicators used for Poland
The indicators represent the three broad types of employment barriers and are constructed from EU-SILC 2013 data as follows:
Five indicators are used to proxy for capabilities barriers:
1. Low education: if an individual has an education level lower than upper secondary education in the International Standard Classification of Education (ISCED)-11 classification);
2. Care responsibilities: if an individual lives with someone who requires care (i.e., children 12 and under receiving under 30 hours of care a week or elderly with health limitations) and is either the only potential care giver in the household or is reported as inactive or working part time because of care responsibilities;
3. Health limitations: if an individual reports some or severe self-perceived limitations in daily activities due to health conditions;
4. Low relative work experience: individuals who have worked less than 60 percent of the time since they left full time education;
5. No recent work experience:
▪ The indicator may represent two situations:
(i) those who have worked in the past but have no recent work experience (have not worked for at least 1 month in the last semester of the reference year or at the month of the interview);
(ii) those who have never worked;
Two indicators are used to proxy for incentives barriers:
6. High non-labor income: if household income (excluding those from the individual’s work-related activities) is more than 1.6 times higher than the median value in the reference population;
7. High replacement benefits: if earnings-replacement benefits (excluding categorical social benefits) are more than 60 percent of an individual’s estimated potential earnings in work;
One indicator is used to proxy for scarce employment opportunities:
8. Scarce employment opportunities*: if an individual is estimated to have a high probability of being unemployed or involuntarily working part time due to their age, gender, education, and region of residence.
*The scarce employment opportunities indicator does not take into account the fact that individuals who are not unemployed but are inactive may nonetheless face scarce opportunities if they were to search for a job.
Portraits of Labor Market Exclusion 2.0
24 The target and working-age populations are significantly different in terms of the employment barriers faced. Table 1 shows that the target population is more likely to face each employment barrier compared to the overall working-age population, with the exception of non-labor income, in which case the two groups face this barrier in equal proportions.14 The most common barrier found in the target population is having no recent work experience (although they may have worked in the past) (66 percent). Almost half of the target population has low relative work experience (43 percent). Thirty-two percent of the target population face scarce job opportunities, meaning that due to their gender, age, education, and the region where they reside, they face a relatively high probability of being or remaining unemployed. Another salient barrier for the target population is related to health limitations (30 percent versus 18 percent for the working-age population). Close to 20 percent have potential disincentives to work due to high income not derived from their own labor; the working-age population has a similar proportion. Nineteen percent of the target population also have low skills versus only 11 percent for the working-age population. For the target population, the share that faces caregiving responsibilities is relatively low (15 percent), and only 10 percent reports to have never worked. Finally, 9 percent in the target population receive a high level of benefits that may be withdrawn or reduced when working full-time in a high quality job versus just 4 percent of the working-age population. Specific sub-groups of the target population face distinctive barriers: e.g. 21 percent of those persistently out of work have a low level education, but only 13 percent of the marginally employed face the same barrier. Health limitations are also more common for the persistently out of work (36 percent) than for the marginally employed (15 percent). Table 1. Characterization of the target population and working-age population, according to barrier indicators
(percent) Target population INDICATOR Working-age population All Persistently out of work Marginally employed Capabilities barriers 1 - Low education 11 19 21 13 2 - Caregiving responsibilities* 6 15 16 12 3 - Health limitations 18 30 36 15
4- Low relative work experience (WE) 23 43 47 30
5 - No recent WE - Has worked in the past* 26 66 86 12
No recent WE - Has never worked* 4 10 14 0
Incentives barriers
6 - High non-labor income 19 19 20 18
7 - High earnings replacement (benefits) 4 9 11 3
Opportunity barrier
8 - Scarce job opportunities 25 32 30 37
*By definition, this barrier does not affect individuals who are not members of the target population.
14The caregiving responsibilities barrier, by definition, does not affect any individuals who are not members of
the target population. The same is true of the barriers associated with recent work experience, as the population with “good jobs,” by definition, has recent work experience because they have all worked for at least 1 month during the last semester of the reference year or at the month of the interview. All other barriers can equally affect individuals who have “good jobs” and are therefore not considered part of the target population.
Portraits of Labor Market Exclusion 2.0
25 Source: World Bank staff calculations based on EU-SILC 2013
The target population in Poland stands out with regard to the education and the never worked barriers. Table 2 shows a cross-country comparison of the employment barrier indicators among the target groups in six EU countries in South, Central, and Eastern Europe. Compared to these six countries, the target group in Poland has the lowest share of individuals with low education (individuals who have not completed upper secondary education) (19 percent). The target population in Poland includes one of the lowest shares of individuals (after Hungary) who have never worked at 10 percent. Compared to other countries, the target group in Poland faces one of the highest share of individuals with caregiving responsibilities (15 percent) and those with health limitations (30 percent).
Table 2. A cross-country comparison of barriers faced by the target groups
Country Bulgaria Croatia Greece Hungary Poland Romania Average
Share of target group facing each barrier by country (percent)
Capabilities barriers 1 - Low education 38 30 81*** 31 19 45 33*** 2 - Caregiving responsibilities 13 12 16 15 15 13 14 3 - Health limitations 19 33 19 37 30 33 29
4- Low relative work experience (WE) N/A* 59 57 N/A* 43 48 52
5 -
No recent WE - Has worked in the past 58** 65 59 73 66 45 62
No recent WE - Has never worked 19** 20 26 9 10 28 19
Incentives barriers
6
- High non-labor income 18 20 23 19 19 19 20
7
- High earnings-replacement benefits 6 3 12 14 9 10 9
Opportunity barrier
8
- Scarce employment opportunities 47 35 45 41 32 26 38
* In Bulgaria and Hungary, a significant share of observations on work experience was missing from the EU-SILC 2013 dataset: as a result, the low relative work experience indicator could not be constructed for these countries.
** In Bulgaria, a significant share of observations was missing from the data on activities conducted in the reference year: as a result, the indicator was constructed differently from the way it was done in the other countries.
*** In the case of Greece, the cut-off for low education has been set at the post-secondary rather than lower secondary level. The reason for the change in the cut-off is that unemployment (employment) rates by education level shows that unemployment (employment) only falls (rises) significantly among individuals who have completed tertiary education,
Source: World Bank staff calculations based on EU-SILC 2013; EU-SILC 2014 for Greece.
The statistical clustering method utilized in this paper to analyze the target population is latent class analysis (LCA). This method exploits the observed proxies of the different categories of employment barriers as captured by the employment barrier framework (Figure 13). LCA is a statistical segmentation technique that enables a characterization of a categorical latent variable (unobserved; in this case, labor market vulnerability) starting from an analysis of relationships among several observed variables (“indicators” as defined earlier). It allows for the statistical
Portraits of Labor Market Exclusion 2.0
26 segmentation of the target population into distinct but homogenous sub-groups with similar barriers to employment in each group, while across groups the profile of employment barriers would differ. In contrast to traditional regression analysis, which identifies the effect of one barrier while assuming all the other barriers stay constant, the LCA exploits the interrelationships of the employment barriers, and the joint determination of the observed outcome (Further details on LCA, and selection of indicators is provided at the OECD-World Bank Joint Methodology Paper, 2016.)
4. Results of the analysis: Portraits of labor market exclusion in Poland
Applying the above methodology, latent class analysis yields the classification of the target population into seven different groups in Poland. Each group varies in terms of size (as shown in Figure 14), characteristics of its population, and in the mix of barriers they face.
Figure 14. Latent groups within the Polish target population
Source: World Bank staff calculations based on EU-SILC 2013
Error! Reference source not found. shows the incidence of barriers within each of the seven groups emerging from the analysis, which have been named15 according to their most salient
characteristics (i.e. those that have a high probability of occurrence for each group). Annex 3 provides a detailed list of socioeconomic characteristics by group and for the target population,
15The titles are somewhat subjective; nevertheless, they mirror the barriers/characteristics that are most
common within each group.
Group 1 32% Group 2 23% Group 3 16% Group 4 15% Group 5 7% Group 6 5% Group 7
2% Group 1: Middle-aged and older, inactivewomen with no recent work experience Group 2: Middle-aged inactive women with caregiving responsibilities and low relative work experience
Group 3: Middle-aged and young men in precarious jobs, with low relative work experience
Group 4: Younger, relatively educated, unemployed women in areas of scarce job opportunities
Group 5: Low-educated, rural, self-employed women with children
Group 6: Low-educated older, mostly male, with high social benefits
Group 7: Older, well-educated in urban areas, with health limitations
Portraits of Labor Market Exclusion 2.0
27 including the active covariates that were also used in the model (sex, age group, the presence of children younger than 12 in the household, and the degree of urbanization in the place of residence). The paragraphs below describe in more detail each group’s more salient characteristics.
Table 3. Employment barriers faced by excluded groups in the Polish labor market
Group 1 Group 2 Group 3 Group 4 Group 5 Group 6 Group 7 Target pop. Group size (% of target
population) 33 23 16 15 7 5 2 100
Number of individuals 648.637 385.349 378.325 325.572 118.141 79.636 5.569 1.941.231
Share of individuals facing each barrier
Capabilities barriers 1 - Low education 23 24 31 12 41 45 4 19 2 - Caregiving responsibilities 16 87 22 28 12 0 0 15 3 - Health limitations 40 16 10 2 25 28 90 30
4- Low relative work
experience (WE) 52 88 54 54 4 28 64 43
5 -
No recent WE - Has
worked in the past 62 60 38 71 30 83 55 66
No recent WE - Has never
worked 8 32 12 15 0 8 0 10
Incentives barriers
6 - High non-labor income 2 8 24 4 2 6 51 19
7 - High earnings
replacement (benefits) 0 4 0 4 6 73 67 9
Opportunity barrier
8 - Scarce employment
opportunities 24 54 50 100 40 13 14 32
Average number of barriers per
individual 2.4 3.6 2.4 2.8 1.7 2.6 3.3 2.4
Notes: All figures represent percentages. Color shadings identify categories with high (dark blue) and lower (light blue) incidences. Source: World Bank staff calculations based on EU-SILC 2013
Figure 15 shows the distribution of the number of barriers faced by individuals in each group (left axis), as well as the average number of barriers faced (right axis). On average, all individuals in the target population face a total of 2.4 barriers; the highest possible number of barriers that an individual can face is 7. Looking across all seven groups, groups 2 and 7 stand out as having the highest average number of barriers (above 3 for both groups). Group 7 stands out as having a very high proportion of individuals facing 4 or more barriers (60 percent). Group 5, on the other hand, has a particularly low average number of barriers (1.6).
Portraits of Labor Market Exclusion 2.0
28 Figure 15. Number of barriers faced by individuals in latent groups
Note: Groups are ordered according to the average number of barriers per individual. Percentages in the horizontal axis represent group
sizes.
Source: World Bank staff calculations based on EU-SILC 2013
Group 1: Middle-aged and older, inactive women with no recent work experience (33 percent of the target population)
➢ 55 percent middle-aged (30-55 years), 30 percent older (ages 56-64) ➢ 20 percent report that they are unfit to work, 18 percent are in
domestic tasks, and another 16 percent in unemployment ➢ 87 percent female
➢ 40 percent face health limitations
➢ 71 percent have no recent work experience (62 percent have worked in the past)
➢ 61 percent live in rural areas ➢ 47 percent are at risk of poverty
➢ 62 percent live with children and only 27 percent have children younger than 3
➢ Only 2 percent has a non-labor income barrier
➢ None face the high earnings-replacement benefits barrier
➢ Average number of barriers: 2.4
Group 1, the largest group, makes up one third of the target population. This group is mainly composed of middle-aged women (55 percent); however, 30 percent are also in the 56 to 64 age range (the average age is 45 years). The activity status of this group is quite heterogeneous, although the majority are inactive (20 percent report being unfit to work, another 18 percent are in domestic tasks, 14 percent are retired, and 12 percent in other inactivity). An additional 16 percent are unemployed and 13 percent are self-employed. Most members of this group are married (62 percent), and 40 percent have working partners. They are mainly concentrated in the poorest
0 1 2 3 4 0% 20% 40% 60% 80% 100%
group 2 group 7 group 4 group 6 group 1 group 3 group 5 Target
22% 2% 15% 5% 32% 17% 26% 100%
No major barriers 1 barrier
2 barriers 3 barriers
4 barriers Average no. of barriers (right axis)
Portraits of Labor Market Exclusion 2.0
29 income quintile (51 percent) with 47 percent at risk of poverty; none of the members of this group receive earnings replacement barriers that could be dis-incentivizing work. Sixty-eight percent have an upper-secondary education, and 23 percent have a low level of education. This group has one of the lowest percentages of those living with children (after Group 7), with only 27 percent living with children under 2. The most commonly faced barriers within this group are: no recent work experience (62 percent), low relative work experience (52 percent), and health limitations (40 percent).
Group 2: Middle-aged inactive women with caregiving responsibilities and low relative work experience (23 percent of the target population).
➢ 91 percent middle-aged (ages 30-55)
➢ 53 percent in domestic tasks, 25 percent unemployed ➢ 97 percent female
➢ 92 percent with children ➢ 72 percent are married ➢ 63 percent in rural areas ➢ 49 percent are at risk of poverty
➢ 87 percent have caregiving responsibilities ➢ 88 percent have low relative work experience ➢ 32 percent have never worked
➢ Average number of barriers: 3.6
Group 2 comprises middle-aged (91 percent) women (97 percent). They are mostly inactive (73 percent, with 53 engaged in domestic tasks and 18 percent “other inactive.” Twenty five percent report being unemployed. The great majority have children under 12 (92 percent), and most have at least one child who does not attend any formal childcare facilities (71 percent). In part, for this reason, unlike Group 1, 87 percent have caregiving responsibilities. They are married (72 percent) and most have a working spouse (54 percent). Similar to Group 1, half are at risk of poverty (49 percent). It is noteworthy that 32 percent have never worked, which is the highest percentage among all the groups. Few face health limitations (16 percent), disincentives from non-labor income (8 percent), or from earnings-replacement benefits (4 percent). The main barriers for members of this group are caregiving responsibilities (87 percent), low relative work experience (88 percent), and no recent work experience (82 percent, among which 32 percent have never worked).
Portraits of Labor Market Exclusion 2.0
30 Group 3: Middle-aged and young men in precarious jobs, with low relative work experience (16 percent of the target population)
➢ 54 percent middle-aged (ages 30-55) and 38 percent young (ages 18-29)
➢ 75 percent male
➢ 33 percent unemployed during the reference period, but 29 percent are still unemployed at the time of interview
➢ 41 percent are working at the time of interview ➢ 59 percent in rural areas
➢ 30 percent are in unstable jobs and 25 percent have near-zero labor income
➢ 54 percent have low relative work experience ➢ 24 percent face the high non-labor income barrier ➢ 31 percent have low education
➢ 44 percent live with their parents
➢ 52 percent are at risk of poverty
➢ Average number of barriers: 2.4
Group 3 comprises mainly men (75 percent), with an average age of 36. Twenty five percent report having near-zero income (most are self-employed), while 30 percent are in unstable jobs, and 33 percent report being unemployed. Similar to groups 1 and 2, 55 percent are in the bottom income quintile, indicating a relatively high at-risk-of-poverty rate in the group (52 percent). Members of this group reside both in rural and urban areas (59 and 41 percent, respectively). Fifty-seven percent have an upper secondary education, which is relatively low compared to the other groups. Most are married (59 percent), but a relatively large proportion is single (36 percent). They mostly live in households with children (65 percent), and 44 percent live with their parents (which is unusual compared to other groups). This group also has one of the largest shares of individuals with a disincentive from non-labor income (24 percent). The most commonly faced barriers are low relative work experience (54 percent), scarce job opportunities (50 percent), and no recent work experience (38 percent have worked before and 12 percent have never worked).
Portraits of Labor Market Exclusion 2.0
31 Group 4: Younger, relatively educated, unemployed women in areas of scarce job opportunities (15 percent)
➢ 55 percent young (18-29) and 45 percent middle-aged (30 -55) ➢ 51 percent unemployed, 20 percent disabled
➢ 77 percent female
➢ 81 percent with children in household
➢ 88 percent with upper secondary diploma or higher education ➢ 69 percent in rural areas
➢ 51 percent are at risk of poverty
➢ Average number of barriers: 2.8
Group 4 consists mainly of women (77 percent) of relatively young age (55 percent between 18 and 29 years old), with an average age of 32 (the lowest among the 7 groups). Half are unemployed (51 percent), most are in long-term unemployment (47 percent). The rest are either disabled (20 percent), or in other inactivity (17 percent). Most are married (60 percent), while 36 percent still live with their parents. The majority (88 percent) live in households with children, yet only 28 percent face a caregiving barrier (about 50 percent live with a potential caregiver (inactive spouse or parent), and only 28 percent have children who are not placed in formal care . They have a decent level of education;88 percent have completed at least an upper secondary education. As in the first three groups, the at-risk-of-poverty rate is relatively high (51 percent). The most commonly faced barriers are scarce job opportunities (100 percent), no recent work experience (71 percent have worked before and 15 percent have never worked) and low relative work experience (54 percent), which potentially reinforce each other.
Group 5: Low-educated, rural, self-employed women with children (7 percent)
➢ 69 percent are in prime ages (30 to 55) ➢ 100 percent are female
➢ 41 percent have only primary education
➢ 100 percent reside in intermediate and thinly populated areas ➢ 64 percent are self-employed, 15 percent are retired
➢ 44 percent are at risk of poverty
➢ 4 percent have low relative work experience
➢ Average number of barriers: 1.7