iii
Dimensionnement et gestion optimaux d’éléments de stockage pour le déploiement de
sources renouvelables, réalisation d'un micro-réseau LVDC
La forte consommation des énergies fossiles au niveau mondial entraine une raréfaction de ces ressources et met en danger l’équilibre environnemental global du fait de la pollution qu’elle engendre. D’autres sources d’énergie dites renouvelables se développent afin de proposer un mix énergétique très diversifié et progressivement décarboné. Par exemple, dans un contexte urbain, le solaire photovoltaïque présente de nombreux atouts comme la possibilité de produire de l’électricité de façon décentralisée, l’intégration aisée dans les bâtiments et infrastructures publiques, la réduction des pertes liées au transport de l’électricité, pas de pollution sonore, pas ou peu d’impact sur l’écosystème environnant, etc. Cependant, cette source est très intermittente et difficilement prédictible (diverses échelles de temps liées au passage de nuages, cycle diurne ou cycle saisonnier) et doit être implantée dans des endroits sans ombrage d’infrastructure pour assurer la meilleure production et durée de vie. De plus, sa production n’est généralement pas temporellement en phase avec des profils de consommation de type résidentiel ou tertiaire.
Afin de répondre à la problématique d’intégration des énergies renouvelables dans nos réseaux électriques conventionnels, l’usage de moyens de stockage, par exemple de type électrochimique, semble aujourd’hui la meilleure solution, en considérant le coût, la sécurité d’approvisionnement, la maturité technologique et la facilité de mise en œuvre. Ainsi, de nouveaux micro-réseaux constitués de sources décentralisées et d’éléments de stockage apparaissent en concurrence du réseau centralisé conventionnel ou en complément de ce dernier afin d’atteindre de nouveaux objectifs (stabilité accrue du réseau, mode isolé de secours en cas de panne avec possibilité d’aider le redémarrage du réseau principal, remplacement de générateurs diesel auxiliaires, etc.). Parmi les grandes transformations actuelles, les consommateurs de plus en plus acteurs et peuvent injecter tout ou partie du surplus d’énergie produit vers le réseau ou choisir de consommer de l’énergie du réseau selon leurs souhaits. Un nouveau modèle économique se dessine avec la possibilité de voir apparaître de nouvelles tarifications de l’électricité notamment liées aux prestations assurant une plus grande robustesse du réseau.
Durant cette thèse, plusieurs années de données de production et de consommation d’un bâtiment photovoltaïque ont été analysées pour définir les contraintes imposées à l’unité de stockage assurant l’équilibre du micro-réseau électrique. Un modèle de performance et de vieillissement a été élaboré pour trois technologies de stockage: batteries plomb-acide, batteries lithium-ion et supercondensateurs. Celui-ci permet le dimensionnement, l’association d’éléments de stockage et la gestion optimale des flux énergétiques au sein du micro-réseau. Divers critères permettant d’évaluer le fonctionnement des micro-réseaux ont également été étudiés comme le coût annuel de l’unité de stockage, le taux d’autoconsommation de l’énergie photovoltaïque, la quantité d’énergie qui n’a pas été fournie au consommateur, etc. Une approche multi-objective, basée sur le concept d’optimum de Pareto, a été mise en œuvre afin d’optimiser les aspects économique, environnemental et d’autonomie de fonctionnement des futurs réseaux électriques distribués. Un démonstrateur basse tension continue de quelques kilowatts a été développé pour valider les différents points étudiés dans cette thèse.
Mots clefs :
Micro-réseau; Éléments de stockage; Gestion d’énergie électrique;
Dimensionnement optimal; Commande bus DC; Modélisation de batteries et
supercondensateurs.
iv
Optimal sizing and energy management of storage systems for renewable sources
deployment, design of a LVDC microgrid
Because of our global high consumption of fossil fuels, these resources are becoming scarce and the environmental equilibrium of the Earth is endangered. Other energy sources are developed in order to build a new diversified and decarbonised energy mix. For example, in an urban context, the solar photovoltaic system has many assets such as the decentralized production of electricity, easy integration in buildings, transportation losses reduction, no sound during production, low environmental impact, etc. However, the production of this energy source is highly varying, difficult to predict (several timescales, from the cloud shadows to seasonal meteorological variations) and not correlated across time with our consumption needs.
In order to enable a massive penetration of renewable energy sources in our conventional grid, the use of energy storage systems (e.g. electrochemical storage) seems a promising solution, taking into account the costs, supply security, technological maturity and ease of set up. Hence, new microgrids constituted by decentralized energy sources and energy storage systems have been developed in order to replace or complement the main centralized grid by ensuring some support functions (i.e. enhancement of the grid stability, black-start operation, replacement of diesel generators, etc.). The consumers become actors able to inject a part of all their surplus energy to the main grid, if the operation is accepted by the transmission system operator. A new business model is to define, especially in the case of putting a valuation on the functions that can help the main grid.
During this thesis, several years of data from production and consumption of a photovoltaic building have been analysed in order to define the operating profile of an energy storage system that ensures the equilibrium of the microgrid. A behavioural model taking into account the ageing has been made for three storage technologies: lead-acid batteries, lithium-ion batteries, and supercapacitors. It enables the optimal sizing, the hybrid association of storage systems, and the optimal energy management of the microgrid. Several criteria assessing the operation of microgrids have been studied (e.g. annual cost of the storage system, self-consumption rate, loss of load probability, etc.). A multi-objective methodology, based on Pareto optimality, has been developed in order to optimize economic, environmental, and autonomy aspects. A low voltage DC prototype of some kilowatts has been developed for validating the different concepts presented in this thesis.
Keywords :
Microgrid; Energy storage systems; Energy management; Optimal sizing; DC
bus control; Batteries and supercapacitors modelling.
v
Quelle aventure! Trois années de belles rencontres et tellement de discussions à réinventer le monde. Par amour pour les sciences mais aussi par amour pour la femme qui partage ma vie depuis presque huit ans, nous nous sommes tous deux investis, plus que de raison sans doute, dans une thèse de doctorat. Je tiens d’ailleurs à remercier très sincèrement mes familles de sang et de cœur qui m’ont apporté tout le soutien nécessaire à la réussite de mes projets professionnels et personnels. Merci à mes grands-parents, papa, maman, Émilie, Valentin et à toute ma grande famille (c’est toujours un plaisir de discuter des sciences avec toi, tonton Franck!).
Je conseille vivement à tous les curieux d’explorer cette voie qu’est la thèse. J’ai pris beaucoup de plaisir à travailler à Toulouse, notamment au sein de l’Université Toulouse III Paul Sabatier avec sa très accueillante bibliothèque universitaire et ses salles de travaux pratiques bien outillées. Je remercie l’école doctorale de Génie Électrique Électronique Télécommunications (GEET) qui m’a accordé une bourse de thèse agrémentée de nombreuses formations transverses et qui m’a donné la possibilité de travailler à l’étranger pour découvrir comment fonctionne la recherche ailleurs. Enfin, je remercie le Laboratoire d’Analyse et d’Architecture des Systèmes (LAAS-CNRS) et l’équipe d’Intégration de Systèmes de Gestion de l’Énergie (ISGE) qui m’ont accueilli dans de très bonnes conditions tant sur le plan matériel qu’humain.
Évidemment, je dois beaucoup à mes directeurs de thèse, Corinne et Bruno, qui m’ont proposé ce très intéressant sujet et qui m’ont accompagné avec bienveillance dans toutes mes démarches. Je remercie chaleureusement Lionel pour m’avoir épaulé tout au long de ma thèse et appris énormément en électronique (signal et puissance). Tous les quatre, nous avons fait un grand nombre de réunions, plus ou moins efficaces, pour en arriver là, et j’espère qu’à l’avenir nous aurons de nouveau l’occasion de travailler ensemble.
Un grand merci aux membres du jury de thèse qui se sont intéressés à ces travaux.
Merci aux collègues du laboratoire LAPLACE à Toulouse, Angel, Georges et Pascal, de m’avoir fait découvrir l’univers des éclairages à LEDs. Merci aux professeurs, Alexandre, Pascal, Damien et Bruno, avec qui je co-encadrais notamment des projets et bureaux d’études. Merci aux chefs d’équipes successifs de l’équipe ISGE, Fred et David. Un très grand merci aux secrétaires, notamment Ascension, qui m’ont aidé dans les démarches administratives pour aller présenter mes travaux dans des conférences un peu partout dans le monde. Merci au service du personnel, au service de gestion et au service d’impression du LAAS qui ont été vraiment au top tout au long de ma thèse.
Je remercie également mes collègues de galère, qui ne comptaient pas les heures à travailler, toujours prêts à donner un coup de main, Margot, Zaki, Wiem, Alonso, Adem et Hiba, merci à vous! Merci aux anciens qui m’ont partagé leur expérience, Michael, Youssef et Luiz. Je souhaite bonne chance aux prochains qui se prépareront bientôt à soutenir Kolja, Ilias, Luis et Firdaous. Une pensée pour tous les stagiaires qui ont travaillé dans l’aquarium d’à côté avec peu de lumière du jour et une climatisation plus ou moins fonctionnelle, bravo à vous.
I am also very grateful to the people I met in Aalborg. It was a great pleasure to work in the Microgrid team for four months. Thank you Josep, Juan, Medhi, Amjad, Adriana, Nelson, Enrique, Jingpeng, Ionela, Hrvoje, Tomislav, Abderezak, Ramy and everyone I met there. You are doing a wonderful job that can be a game changer to achieve a more sustainable future.
Enfin, j’espère avoir la chance de continuer ma carrière avec de nouveaux projets me permettant de satisfaire ma curiosité avec autant de joies.
vi
BESS Battery Energy Storage System BOS Balance Of the System
CAES Compressed Air Energy Storage
CC Constant Current
CCS Carbon Capture and Storage
DC Direct Current
DOE Department Of Energy
DOD Depth Of Discharge
EIS Electrochemical Impedance Spectroscopy EPBT Energy Pay-Back Time
ESS Energy Storage System
EU European Union
GHG Greenhouse Gas
HESS Hybrid Energy Storage System IEA International Energy Agency LCA Life Cycle Analysis
LCOE Levelized Cost Of Electricity LED Light Emitting Diode
MG Microgrid
O&M Operation and Maintenance OCV Open-Circuit Voltage
OECD Organisation for Economic Co-operation and Development OPA Open Platform for the ADREAM building (name of a project) PCB Printed Circuit Board
PHES Pumped Hydropower Energy Storage
PV Photovoltaic
SC Supercapacitor
SEI Solid Electrolyte Interface
SMES Superconducting Magnetic Energy Storage
SOC State Of Charge
SOH State Of Health
vii
« Rien n’est solitaire, tout est solidaire. L’homme est solidaire avec la planète,
la planète est solidaire avec le soleil, le soleil est solidaire avec l’étoile, l’étoile
est solidaire avec la nébuleuse, la nébuleuse, groupe stellaire, est solidaire avec
l’infini. Ôtez un terme de cette formule, le polynôme se désorganise, l’équation
chancelle, la création n’a plus de sens dans le cosmos et la démocratie n’a plus
de sens sur la terre. Donc, solidarité de tout avec tout, et de chacun avec chaque
chose. La solidarité des hommes est le corollaire invincible de la solidarité des
univers. Le lien démocratique est de même nature que le rayon solaire. »
Proses philosophiques, L’âme
Victor Hugo
viii
Résumé ... iii
Abstract ... iv
Remerciements – Acknowledgments ... v
List of Figures ... ix
List of Tables ... xiii
Chapter 0. Résumé de la thèse ... 1
Chapter 1. Introduction ... 5
Chapter 2. Renewable sources and Microgrids ... 8
Chapter 3. Energy Storage Systems ... 38
Chapter 4. Optimal sizing of energy storage systems ... 67
Chapter 5. Optimal control of microgrids ... 96
Chapter 6. Conclusion ... 112
Selected publications ... 114
Bibliography ... 115
ix
Chapter 2
Figure 2.1 The energy system from primary energy to energy services ... 10
Figure 2.2 World total final consumption from 1971 to 2014 ... 11
Figure 2.3 World final consumption in 2014 ... 11
Figure 2.4 Primary energy supply by region [3] ... 12
Figure 2.5 Cooking and electricity access – Global inequalities [5] ... 12
Figure 2.6 World primary energy supply by fuel type [3] ... 13
Figure 2.7 Main parameters involved in the climate system modelling [8] ... 14
Figure 2.8 Global anthropogenic CO2 emissions and possible temperature changes [7] ... 15
Figure 2.9 Breakdown of CO2 emissions by sectors in OECD countries [14] ... 16
Figure 2.10 Historical evolution of global electricity generation by fuel type [3] ... 16
Figure 2.11 Venn diagram of sustainable development ... 18
Figure 2.12 Levelized cost of energy for different technologies [18] ... 19
Figure 2.13 Estimated GHG emissions for different electricity generation technologies [24] ... 20
Figure 2.14 Energy pay-back time of different renewable sources. ... 21
Figure 2.15 Global capacity additions by type of renewable source [10] ... 22
Figure 2.16 Share of renewables for EU countries in gross final energy consumption in 2015 and targets for 2020 ... 23
Figure 2.17 Proportion of electricity generated from renewable sources in EU countries in 2005 and 2015 ... 23
Figure 2.18 Typical hybrid microgrid configuration [44] ... 25
Figure 2.19 Typical PV system feeding a load (AC or DC) ... 27
Figure 2.20 Typical I-V and power curves of a PV module ... 28
Figure 2.21 PV cell efficiency results involving different families of semiconductors ... 28
Figure 2.22 Evolution and projections of PV module price [51] ... 29
Figure 2.23 Worldwide EPBT of on-grid PV modules including all BOS components for the year 2010 [60] ... 29
Figure 2.24 Projects of vehicles powered by PV solar systems – A) Quiet Achiever, B) Solar Impulse, C) Energy Observer ... 30
Figure 2.25 ADREAM building of the LAAS-CNRS ... 31
Figure 2.26 Different views inside the ADREAM building ... 31
Figure 2.27 Example of power balance of the ADREAM building during 5 days of December 2016 .... 32
Figure 2.28 Typical use cases of ESS, A) Peak shaving and load levelling, B) Integration of renewable sources ... 33
Figure 2.29 Storage facilities through the world [73] ... 34
Figure 2.30 Worldwide battery market from 1990 to 2015 [75] ... 35
Figure 2.31 Cost reduction of lithium batteries [76] ... 35
Figure 2.32 Safety issues with lithium batteries, a) Sony notebook batteries, b) Yuasa battery in Boeing 787 Dreamliner, c) Tesla S model, d) Samsung galaxy note 7 ... 36
x
Figure 3.1 List of main available energy storage systems ... 40
Figure 3.2 Weight and volume characteristics of different ESSs [82] ... 44
Figure 3.3 Operation of a cell during a) charge and b) discharge. ... 45
Figure 3.4 First cells/piles/batteries of the history [86] ... 46
Figure 3.5 Different Battery chemistries through history [87] ... 46
Figure 3.6 Reactions occurring in lead-acid batteries for different electrode potentials [88]... 48
Figure 3.7 Lithium-ion battery packaging a) Cylindrical, b) coin, c) prismatic, and d) thin and flat [90] ... 49
Figure 3.8 Lithium ion battery a) whole cell principle [93] and b) SEI at the anode [91] ... 50
Figure 3.9 Characteristics of the main lithium battery technologies [95] ... 50
Figure 3.10 Example of Maxwell SC packages ... 51
Figure 3.11 Design of an EDLC and movements of ions in the electrolyte [98] ... 52
Figure 3.12 Electric double layer models, a) Helmholtz, b) Gouy–Chapman and c) Stern [96] ... 52
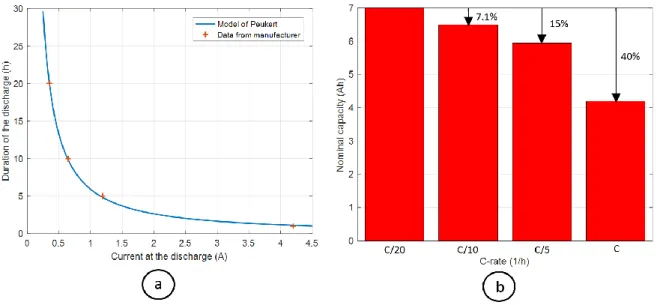
Figure 3.13 Lead-acid battery capacity for different C-rates - A) Peukert’s model, B) Absolute and relative decrease of capacity ... 54
Figure 3.14 Normalized discharged capacity of three types of batteries evaluated for different C-rates at a working temperature of 25°C [101] ... 55
Figure 3.15 Energy and coulombic efficiencies of a Yuasa lead-acid battery ... 56
Figure 3.16 Energy efficiency at 25°C under various C-rates [101] ... 56
Figure 3.17 a) Voltage relaxation of a lithium-ion battery after a discharge, ... 58
Figure 3.18 Calendar lifetime of lithium-ion batteries at 50°C, a) effect on nominal capacity, ... 59
Figure 3.19 Cycle lifetime vs. cycle depth of lithium-ion batteries (modified from [112]) ... 60
Figure 3.20 Lifetime model of a 2.1 kWh flooded flat plate battery [109] ... 61
Figure 3.21 Rainflow counting example on an arbitrary SOC time series ... 62
Figure 3.22 Experimental setup for cycling batteries ... 63
Figure 3.23 Thevenin model of a lithium-ion battery with two parallel RC [118] ... 64
Figure 3.24 a) Simplified model describing an ESS, b) OCV vs. SOC of a lead-acid battery ... 65
Figure 3.25 Comparison between experimental data and model of an ESS a) discharge of a lead-acid battery, ... 65
Chapter 4
Figure 4.1 Bi-objective minimization problem – Pareto front and dominated solutions ... 70Figure 4.2 Annualized cost of an ESS ... 72
Figure 4.3 Some hybrid topologies of ESSs adapted to DC MGs ... 75
Figure 4.4 Topology of the PV microgrid with two ESSs ... 77
Figure 4.5 Algorithm of ESS management ... 78
Figure 4.6 Efficiency of a bidirectional DC/DC boost converter for different input power ... 79
Figure 4.7 Multi-objective sizing methodology of a hybrid ESS ... 81
Figure 4. 8 One day of simulation – A) Power profiles, B) SOC profiles ... 82
Figure 4. 9 Optimal hybrid ESS configurations ... 82
Figure 4.10 ADREAM PV building, A) Minimum and maximum power balance based on a 3-year data set, B) Probabilistic analysis of surplus and deficit energy per day ... 83
Figure 4.11 PV surplus power and energy per day of the ADREAM building over the 3 last years ... 84
Figure 4.12 Capacity fading of a battery due to ageing ... 85 Figure 4.13 Minimum nominal capacity of the ESS satisfying power, energy and lifetime constraints 86
xi
Figure 4.16 Multi-objective methodology developed for LED sizing ... 90
Figure 4.17 Number of LEDs vs. power supplied to the luminaire ... 91
Figure 4.18 Annual cost vs. energy consumption of the LED luminaire ... 92
Figure 4.19 Manufacturing and use stages LCA for different LED configurations ... 93
Figure 4.20 Optimization of three objectives ... 94
Figure 4.21 Comparison all lighting technologies ... 95
Chapter 5
Figure 5.1 Three-level hierarchical control with synchronization control loop [193] ... 99Figure 5.2 Hierarchical control of a MG based on scheduling and DC bus signaling. ... 99
Figure 5.3 Microgrid architecture with the main variables ... 100
Figure 5.4 Examples of Danish operating profiles ... 101
Figure 5.5 Cost of electricity during the last 3 years in West Denmark intraday market ... 101
Figure 5.6 MG scheduling for a 1.5 MWh BESS A) Median profile, B) Mean profile ... 103
Figure 5.7 ADREAM building – Rooftop PV panels ... 104
Figure 5.8 Architectures of the developed OPA microgrid and the ADREAM building of the LAAS-CNRS ... 105
Figure 5.9 Power electronics developed in the LAAS ... 105
Figure 5.10 Voltage levels and operating modes of the ESSs in the MG ... 106
Figure 5.11 Cascade regulation implemented in every power converter of the MG ... 107
Figure 5.12 OPA experimental setup... 107
Figure 5.13 Monitoring interface of the OPA project ... 108
Figure 5. 14 State diagram describing the energy management of ESSs in the MG ... 108
Figure 5. 15 OPA MG experimental profiles. A) complete day operation, B) to E) different operating modes ... 110
Appendix of chapter 3
Figure Appendix 3. 1 Typical recommended CC–CV charging method applied to a lithium battery .. 126Figure Appendix 3. 2 Example of SOC evolution ... 131
Figure Appendix 3. 3 List of local extrema obtained from the analysis of SOC evolution ... 131
Figure Appendix 3. 4 Comparison of half-cycles (buffer) ... 131
Figure Appendix 3. 5 Updated list of local extrema ... 132
Figure Appendix 3. 6 Updated buffer ... 132
Figure Appendix 3. 7 Updated list of local extrema (2) ... 132
Figure Appendix 3. 8 Updated buffer (2)... 132
Figure Appendix 3. 9 Cycles with their respective cycle depth obtained by rainflow counting algorithm ... 133
Figure Appendix 3. 10 Electrochemical cell modelling by EIS ... 134 Figure Appendix 3. 11 Relationship between internal resistance and C-rate for a lead-acid battery 135
xii
Figure Appendix 4. 1 Luminous efficacy vs. Power for three different LEDs ... 136
Figure Appendix 4. 2 Simplified scheme of an LED system, B- PCB footprint of an LED, C- Thermal model of an LED luminaire ... 137
Figure Appendix 4. 3 Voltage across each LED for different forward currents ... 138
Figure Appendix 4. 4 Evolution of LED solder point temperatures ... 138
Figure Appendix 4. 5 Simplified lifetime model of an LED [176] ... 139
Appendix of chapter 5
Figure Appendix 5. 1 Equivalent circuit model of a hybrid energy storage system connected to a DC load ... 144xiii
Chapter 2
Table 2.1 United Nations world population projections [6]... 13
Chapter 3
Table 3.1 Comparison between the main technologies of ESSs ... 43 Table 3.2 Comparison of lead-acid battery technologies ... 48
Chapter 4
Table 4.1 Comparison of different hybrid topologies of ESSs ... 76 Table 4.2 Main performances of white LEDs (data from manufacturers) ... 89 Table 4.3 Main characteristics of different commercialized lamps ... 94
Chapter 5
1
Chapter 0.
Résumé de la thèse
« Il est un agent puissant, obéissant, qui se plie à tous les usages: il m’éclaire, il
m’échauffe, il est l’âme de mes appareils mécaniques. Cet agent, c’est l’électricité »
dans Vingt Mille Lieues sous les mers, Jules Verne (8 février 1828 – 24 mars 1905) célèbre écrivain français de romans d’aventures.
0.1 Introduction
Depuis la fin du XVIIIe siècle, les ressources d’énergies fossiles telles que le charbon, le gaz et le pétrole
sont massivement exploitées pour subvenir à nos besoins énergétiques. Pourtant, pour des raisons environnementales (épuisement des stocks, méthodes d’extraction parfois polluantes, émissions de gaz à effet de serre, etc.) et d’équité sociale (accès universel à l’énergie), il apparait que l’actuel système énergétique fortement centralisé pourrait être amélioré. En effet, de nouveaux modes de production décentralisés intégrant des sources renouvelables (solaire, éolien, hydraulique, biomasse, etc.) sont prometteurs et semblent proposer une alternative crédible permettant une électrification mondiale s’inscrivant dans une démarche de développement durable.
Dans cette thèse, nous nous sommes intéressés aux concepts de « smartgrid » et « microgrid » (MG) qui bénéficient d’un essor important dû aux progrès accomplis en électronique de puissance (notamment dans le domaine des alimentations à découpage à haut rendement) et en technologies de communication (internet, connectivité sans fil, etc.). Un MG est un réseau électrique de puissance moyenne (inférieure au mégawatt) constitué d’au moins une source d’énergie renouvelable, d’éléments de stockage, de systèmes permettant la bonne gestion des flux énergétiques, ainsi que d’une possible connexion au réseau conventionnel centralisé. L’association de plusieurs MGs communicants entre eux constitue un smartgrid.
Le recours à une distribution à courant continu (CC) au sein des MGs progresse du fait du nombre croissant de sources CC renouvelables (par exemple le solaire photovoltaïque) et des charges CC (comme les semi-conducteurs largement utilisés en informatique, les batteries, les nouveaux dispositifs lumineux à diodes électroluminescentes, etc.). Ainsi, de nombreux MGs hybrides alliant les distributions à courants alternatif (AC) et continu (CC) se développent. Ce type de MG sera le principal cas d’étude de ce manuscrit.
L’objectif de cette thèse est de modéliser un MG afin d’optimiser le dimensionnement et la gestion d’éléments de stockage. Pour ce faire, des données réelles provenant du système photovoltaïque (100 kilowatt-crête) et de la consommation du bâtiment ADREAM du LAAS-CNRS ont été utilisées. Plusieurs technologies de stockage (batteries plomb-acide, batteries lithium-ion et supercondensateurs) sont comparées et modélisées pour cette application. Ainsi, une méthodologie générique de dimensionnement optimal est proposée. Plusieurs niveaux de gestion sont présentés et un prototype de quelques kilowatts a été conçu pour valider une stratégie de commande.
2
0.2 Les sources d’énergie renouvelables et micro-réseaux
Ce chapitre traite le positionnement des sources d’énergie renouvelables au sein de notre système énergétique planétaire. De ce fait, la politique environnementale internationale est abordée et différentes sources d’électricité sont comparées d’après des aspects environnementaux, économiques et sociaux, trois piliers définissant le développement durable. Nous avons sélectionné plusieurs indicateurs pour quantifier la notion de développement durable comme par exemple le coût actualisé de l’électricité, le niveau d’émissions de gaz à effet de serre sur l’ensemble du cycle de vie, le temps de retour sur investissement énergétique et l’acceptation sociale.
Les propriétés des MGs AC et DC sont exposées afin de mettre en lumière l’émergence de topologies à architecture DC, qui permettent notamment une intégration aisée des énergies renouvelables. Ainsi, dans un contexte urbain, le solaire photovoltaïque (PV) fut la principale source renouvelable étudiée, notamment du fait des études antérieures de l’équipe sur les architectures reconfigurables. Par ailleurs, cette thèse est alimentée de nombreuses données acquises au cours des quatre dernières années en provenance du bâtiment PV ADREAM du LAAS-CNRS.
Enfin, le stockage est un élément majeur dans la constitution d’un MG car il permet d’absorber les fluctuations de production des sources renouvelables. Ce dernier peut être utilisé à la fois pour maintenir la stabilité d’un MG sur des temps très courts mais aussi pour assurer une certaine autonomie de fonctionnement en cas de panne sur le réseau électrique principal. Notre choix s’est porté sur le stockage électrochimique qui présente de bonnes caractéristiques en termes de maturité, sécurité et robustesse.
0.3 Les éléments de stockage
Différentes technologies de stockage (mécanique, chimique, électrique, électrochimique et thermique) sont présentées en début de chapitre. A partir de la littérature, une comparaison est menée en s’appuyant sur leurs principales caractéristiques (temps de réponse, coûts d’achat et d’opération, énergie et puissance spécifiques, durée de vie en cyclage et en calendaire, etc.).
En choisissant le stockage d’énergie adapté pour les bâtiments intelligents, nous nous sommes focalisés sur les batteries au plomb-acide, les batteries lithium-ion et les supercondensateurs (SCs). Le principe de fonctionnement de ces trois éléments est présenté afin de mieux expliquer leurs similitudes et différences en termes de rendement et durée de vie notamment.
Ensuite, les grandeurs utiles telles que la capacité nominale ou encore l’état de charge sont définies conjointement pour les technologies étudiées. Une attention particulière fut portée à l’estimation du vieillissement des éléments de stockage. Deux approches sont d’ailleurs mises en avant pour estimer l’état de santé, l’une basée sur le principe de suivi du nombre d’ampère heures échangés et l’autre basée sur un cumul d’évènements (rainflow counting).
Pour finir, différents outils de modélisation sont analysés afin de définir un modèle adapté pour le dimensionnement et à la planification d’éléments de stockage. La modélisation type circuit a été retenue pour son bon compromis entre complexité mathématique et bonne approximation du comportement du stockage dans les conditions de fonctionnement d’un MG PV. Quelques résultats expérimentaux effectués sur des batteries au plomb et SCs sont présentés.
3
0.4 Dimensionnement optimal d’éléments de stockage
Dans ce chapitre, le dimensionnement optimal d’un système de stockage est traité. Les principales méthodes d’optimisation mono et multiobjectif sont présentées, notamment la méthodologie de Pareto. Différents critères liés à la notion de développement durable sont développés pour évaluer l’optimalité du dimensionnement du stockage au sein d’un MG. Ainsi, une méthode générique d’optimisation multiobjectif basée sur l’optimalité de Pareto a été développée.
Un premier cas d’étude présente le dimensionnement à trois objectifs d’un stockage hybride constitué de batteries au plomb-acide et de SCs. Le profil de fonctionnement est basé sur les données historiques du bâtiment ADREAM. Le comportement électrique, le vieillissement et le coût du stockage sont modélisés afin de définir les combinaisons optimales qui satisfont au mieux les objectifs choisis. L’optimisation du dimensionnement prend en compte différentes contraintes, notamment les limitations (relatives à la capacité du stockage) des courants de charge et de décharge qui sont imposées afin de ne pas diminuer la durée de vie du stockage par une mauvaise utilisation.
Le dimensionnement d’une batterie lithium-ion, s’appuyant sur les données du réseau électrique Danois, est notre second cas d’étude. Ce travail fut réalisé lors de mon séjour de quatre mois à l’Université d’Aalborg dans l’équipe « Microgrid » dirigée par Josep M. Guerrero. Le profil de fonctionnement est traité différemment du cas précédent (étude probabiliste), ce qui permet notamment d’analyser plus simplement le vieillissement du stockage en se basant sur la notion de profondeur de décharge journalière.
Finalement, pour montrer l’adaptation de cette méthode d’optimisation à divers problèmes, celle-ci est appliquée au dimensionnement d’un éclairage à LED. Le but étant de trouver les valeurs de courant d’alimentation, de dissipation thermique et nombre de LEDs qui optimisent les caractéristiques d’efficacité lumineuse, de consommation électrique et de consommation tout au long du cycle de vie d’un luminaire. Cette étude a été menée en collaboration avec l’équipe « Lumière et Matière » dirigée par Georges Zissis du laboratoire LAPLACE à Toulouse.
0.5 Commande optimale d’un micro-réseau
Ce dernier chapitre est consacré au pilotage optimal des MGs. Parmi la multitude de techniques de commande adaptées aux MGs AC et DC, celle par niveaux hiérarchiques nous apparaît particulièrement intéressante pour optimiser, sur différentes échelles de temps, le fonctionnement des différents organes du MG (notamment le stockage) tout en assurant la stabilité de ce dernier.
Dans un premier temps, une méthode de planification optimale est présentée pour un pack de batterie lithium-ion intégré dans un MG fonctionnant avec les données du réseau électrique Danois. L’objectif est de diminuer les coûts de fonctionnement liés à la consommation électrique du réseau ainsi que ceux liés à l’usage du stockage. Comme pour le dimensionnement, des contraintes de fonctionnement sont imposées sur le stockage mais aussi sur l’utilisation du réseau (limitation de la puissance échangée). Pour conclure ce manuscrit, la plateforme expérimentale de MG à échelle réduite mise en œuvre au LAAS-CNRS sous le nom d’Open Platform for the ADREAM building (OPA) est dévoilée. Cette plateforme multidisciplinaire nous a notamment permis de valider les couches bas niveaux de la commande hiérarchique, à savoir le DC bus signaling et la régulation cascade. Nous montrons comment cette commande peut être implémentée de manière décentralisée afin de s’affranchir des problèmes liés à des erreurs de communication.
4
0.6 Conclusion
« On ne fait jamais attention à ce qui a été fait ; on ne voit que ce qui reste à faire »
Marie Skłodowska-Curie (7 novembre 1867 – 4 juillet 1934) chimiste et physicienne polonaise naturalisée française qui obtint deux prix Nobel dans des domaines scientifiques distincts
(physique en 1903 pour des travaux sur les radiations, et chimie en 1911 pour des travaux sur le polonium et le radium).
Notre système énergétique mondial a été présenté dans ce manuscrit de thèse. La production d’énergie renouvelable décentralisée et développée au sein des MGs semble une solution prometteuse pour un avenir s’inscrivant dans une démarche de développement durable.
Le défi majeur est de fournir une sécurité d’approvisionnement de l’électricité avec des sources intermittentes qui dépendent des conditions climatiques. C’est pourquoi nous avons étudié les principaux systèmes de stockage afin de mieux appréhender les avantages et inconvénients de chaque technologie. Dans le cadre du développement d’un MG urbain, nous avons sélectionné les batteries au plomb-acide, les batteries lithium-ion et SCs pour des raisons de coûts d’achat et d’opération, de rendement, de durée de vie, etc.
Ainsi, nous avons abordé trois thèmes que sont la modélisation, le dimensionnement et la planification des éléments de stockage. Nous avons ensuite défini des critères permettant d’évaluer l’optimalité de la solution de stockage envisagée. Une méthodologie générique d’optimisation multiobjectif a par ailleurs été développée.
Enfin, nous nous sommes concentrés sur la commande du MG en nous appuyant sur une technique de pilotage à trois niveaux hiérarchiques. Un démonstrateur de quelques kilowatts a été conçu pour valider les deux niveaux de commande les plus bas. L’intérêt de ce travail est de proposer une solution de pilotage ayant un mode de fonctionnement optimal avec supervision et planification, mais aussi un mode « dégradé » qui est décentralisé et autonome en cas de panne de communication.
Les perspectives sont multiples. Il faut envisager l’amélioration et la validation de la modélisation des éléments de stockage, notamment le modèle vieillissement « rainflow counting ». L’analyse du cycle de vie des éléments de stockage est également primordiale pour valider les choix technologiques. Enfin, il paraît intéressant de mener une analyse concernant l’influence de la stratégie de gestion du stockage sur le dimensionnement et vice versa.
5
Chapter 1.
Introduction
“Plans are useless but planning is indispensable”
Dwight D. Eisenhower (14 October 1890 – 28 March 1969), 34th President of the United States (1953-1961).
During the past years, the phasing out of fossil fuel resources (i.e. coal, gas, oil), which have been the main energy carriers since the first industrial revolution at the end of the 18th century, is accelerated
towards the creation of a new energy system relying on renewable energy sources (e.g. solar photovoltaic energy, wind energy, marine energy, biomass, etc.) and distributed energy generation. This energy transition is supposed to ensure a more sustainable electrification, universally accessible and environment-friendly.
The shift to renewable sources can be explained by many reasons such as economic (decreased dependency to fossil fuels), environmental (e.g. reduction of greenhouse gases) and social (energy accessibility in remote areas). Despite the fact that the concept of ‘smartgrid’ was born some decades ago, the recent technological breakthrough advances in power electronics combined with information and communication technologies (ICT) opened up numerous possibilities in the optimization of energy management, production, and distribution. Similarly to the internet, a smartgrid can be seen as an interconnected network of many nodes named ‘microgrids’, which are small distributed architectures having their own hardware configuration (usually constituted of a renewable energy source, an energy storage system, some controllable loads, and at least a control unit with measurement points placed within different parts of the grid). The users of a microgrid are often called prosumers (i.e. producers and consumers of energy), they can choose to be connected or not to the main grid in order to increase the penetration of renewable energy sources and decrease the cost of electricity. In order to mitigate the variable nature of renewable energy sources, which endangers the stability of the electrical grid, energy storage seems to be a good solution that can also help achieve the goals of a microgrid that are to increase efficiency, reliability and resiliency of electricity generation and distribution.
Thus, it appears that the sizing and energy management of energy storage systems is difficult because of incertainties related to renewable energy sources production (that is difficult to forecast) and varying load requirements (which is affected by the meteorological conditions, user’s behaviour, etc.). A large number of studies in academic and industrial fields are developing new energy storage systems that can be adapted to any type of applications. The challenge is to propose a good model that encompasses instantaneous performances and lifetime estimation under real-life conditions.
Beyond the concept of microgrid, the old debate about AC and DC current distributions has re-emerged because of the recent technological evolutions (especially in power converters that are now able to replace efficiently AC transformers), the development of renewable sources such as solar photovoltaic delivering a DC current, and a lot of new loads that need DC supplies (batteries, electronic devices, LEDs, etc.). New objectives will be investigated in the development of a sustainable energy system, which has to be universally accessible and environment-friendly.
In this context, this thesis addresses the modelling and energy management of a microgrid (MG) constituted of energy storage systems and renewable sources. A particular overview on multi-objective
6
optimization has been done with the selection of different criteria that enables to evaluate the cost of electricity, the self-consumption of the renewable source, etc. The analysis of distributed control and monitoring solutions have been important in order to propose our own DC microgrid. The modelling, simulation and multi-objective optimization of the sizing have been implemented in MATLAB and the scheduling optimization problem has been solved with General Algebraic Modeling System (GAMS). For the experimental validation, a low voltage DC prototype has been developed in the laboratory. This small microgrid is constituted of a string of solar photovoltaic (PV) panels (1 kWp), some energy storage systems (more than 10 kWh of installed capacity), and some controllable loads (servers from a datacenter, LED ligthtings, sensors and actuators for an internet of things network). Hence, this experimental platform will be used in the future to validate new smart management of MGs.
My supervisors, Professors Corinne ALONSO and Bruno JAMMES, started to work in the field of microgrids via the creation of the ADREAM building in the LAAS-CNRS, which is an experimental platform of 1700 m² with a solar PV source of 100 kWp (large PV façade and tens of PV panels are placed on the roof). With this building, inaugurated in 2012, an extensive research has been carried out in the fields of PV array reconfiguration under partial shading conditions and PV fault detection. Analysing production and consumption profiles, the research work naturally moved towards the integration of storage systems in this microgrid. The doctoral school ‘Génie Electrique Electronique Télécommunications’ (GEET) granted a doctoral contract of 3 years to pursue the sizing and energy management of energy storage systems in microgrids.
This thesis is organized as follows, chapter 2 presents the context of this work defining the concept of energy system from primary to useful energy, and proposing a short overview of the world’s situation (energy access, environmental issues, etc.). The electrification of our society is also explained and a comparison between all electricity sources has been made based on some selected criteria that promote sustainable development. New electrical architectures such as smartgrid and microgrid are introduced, as well as energy storage systems, which are seen as a possible evolution of our actual electrical grid. Thereafter, in chapter 3, the main technologies of energy storage systems are presented and their performances are investigated through a literature review (capital cost, operating cost, cycle efficiency, lifetime expectancy, etc.). A particular focus has been put on lead-acid batteries, lithium-ion batteries, and supercapacitors with the modelling of their electrical performances and ageing behaviour. Indeed, some definitions will be given such as available capacity, state of charge, and state of health, in order to propose a realistic model of energy storage systems. The steps for the elaboration of an equivalent-circuit model have been detailed. This model is seen as the best trade-off between electrochemical model and black-box model in our application (computation resources are limited and a reasonable number of experimental tests are necessary to investigate the different parameters of the storage system, depending on the desired accuracy, especially in applications with large variations of current rates). Then, the optimal sizing of an energy storage system is developed in chapter 4. Some mono and multi-objective optimization techniques are presented in order to select the most adapted methodology to our application. Several criteria have been defined to evaluate the sizing in terms of reliability, costs, environmental impact, and social political factors. Different study cases have been developed, firstly, the optimal sizing of a hybrid storage system (i.e. association of two storage systems) with a pre-defined strategy of storage and historical data that define the operating profile of the microgrid. The aim of this first study was to evaluate the possible benefits of the hybridization of storage systems in microgrid applications because several studies already demonstrated the benefits in the transportation sector for example. In a second step, a similar study has been conducted with a simple storage system in order to define the optimal capacity and cycle depth of the storage system. The proposed multi-objective methodology of sizing, based on Pareto optimality, has also been adapted to the sizing of LED lightings, finding the best current supply, number of LEDs, and heatsink in order to minimize the annual cost of the luminaire, the electrical consumption, and the primary energy consumed during its entire life (life cycle analysis). Afterwards in the chapter 5, the optimal scheduling and the distributed control of a microgrid are presented through two study cases. Indeed, the Danish grid data has been used to propose
7
an optimal scheduling of a lithium-ion battery pack managing the high penetration of renewable sources. Hence, a non-linear optimal problem has been set and solved in order to minimize the cost of electricity and the cost of the storage system. The distributed control has been experimentally validated through a small-scale microgrid based on ‘DC bus signaling’, which enables to define different modes corresponding to a specific use of energy storage systems, PV source, and energy exchanges with the main grid. Finally, the conclusion of this thesis is given, highlighting the main contributions of this work and the perspectives for further developments of the sizing methodology and operation of the microgrid.
8
Chapter 2.
Renewable sources and Microgrids
“Earth provides enough to satisfy every man’s needs, but not every man’s greed.”
Mohandas Karamchand ‘Mahatma’ Gandhi (2 October 1869 – 30 January 1948) Indian politician and philosopher who inspired a lot of movements for civil rights towards the world.
Energy is often seen as a driver of societal development and economic growth. In order to meet our energy needs and be always more convenient to use, different forms of energy have been mastered such as animal power, mechanical power and electrical power. Yet, our actual production, transportation and use of energy has to evolve because of (i) the depletion of fossil resources that are massively powering mechanical and electrical power, (ii) the greenhouse gas (GHG) emissions due to fossil fuel combustion which contributes to climate change, and (iii) the high world’s population growth rate (inducing a higher energy demand in the future). The global context of energy will be presented with a particular focus on electrification of our society and the integration of new distributed resources. This chapter emphasizes the importance of developing efficient, environment-friendly and more accessible energy carriers such as renewable energy sources. Indeed, renewable energy has many potential benefits such as reduction in GHG emissions, diversification of energy supplies (improvement of reliability), reduced infrastructures for electricity transportation (in case of local consumption), and reduced dependency on fossil fuel resources.
This chapter is organized as follows:
First the concept of “energy system” is presented with a review on the global trends of energy production and consumption. Then, a historical overview is given over the past decades concerning the international “energy transition” which is supposed to turn our actual dependency from fossil fuels to renewable sources. Finally, the development of the electrical grid is described unveiling the latest architectures such as the microgrid that produces its own energy combining renewable energy sources and energy storage systems (ESSs).
9
Table of contents of chapter 2
Chapter 2. Renewable sources and Microgrids ... 8 2.1 Energy context ... 10 2.1.1 Energy system definition ... 10 2.1.1 Access to energy and world’s population growth ... 11 2.1.2 Environmental issues ... 13 2.2 World electrification ... 15 2.2.1 Actual energy sources for electricity generation ... 16 2.2.2 Indicators of sustainability ... 18 2.2.3 International environmental policy ... 22 2.3 Towards the next generation of electricity grid ... 24 2.3.1 Alternating current (AC) and direct current (DC) distributions ... 24 2.3.2 Smart grid and microgrid (MG) – The challenge of renewable sources ... 24 2.4 Case study: the solar (PV) source ... 26 2.4.1 PV systems background ... 26 2.4.2 Energy storage systems (ESSs) ... 32 2.5 Summary... 37
10
2.1 Energy context
2.1.1 Energy system definition
The analysis of energy systems, from production to use of energy, is a key to assess environmental, economic and social impacts of our energy policy [1]-[2]. As presented in Fig. 2.1, energy can be classified into the four following categories:
Primary energy (PE) concerns available energy in nature, which has not been transformed by human (e.g. fossil fuels, biomass, solar radiation, etc.). Usually, PE is not convenient for transportation and direct use.
Secondary energy (SE) is the result of the transformation of PE (e.g. electricity, gasoline, etc.). This energy is often called energy carrier because it enables to use energy wherever and whenever the user wants.
Final energy (FE) is the energy delivered to the end-user that is directly consumed (e.g. electricity at home, gasoline at the service station). This energy is exchanged through formal monetary transactions on which some taxes are levied.
Useful energy (UE) reflects the effective energy that is transformed to provide services. It enables to take into account the efficiency of the end-use device (e.g. illumination is provided by a light bulb that convert only around 10% of the final energy into light).
Figure 2.1 The energy system from primary energy to energy services
As illustrated in Fig. 2.1, energy losses occur when PE is transformed into SE, when the SE is delivered to the end-user as FE and when the FE is used through the end-use device. These losses are crucial because it proves that energy services can be fulfilled with less primary energy through more efficient conversion processes, delivering processes and devices.
For the past decades, the world total final consumption (also called end-use energy) has been continuously increasing, as presented in a report from the international energy agency (IEA) [3] and illustrated in Fig. 2.2. It can be seen that the energy demand has more than doubled since 1971, reaching 9 425 Mtoe (tonne of oil equivalent) in 2014 (according to the IEA, 1 Mtoe corresponds to 11.63 TWh). It is also noticeable that the use of electricity has substantially grown, from 9.4% in 1971 to 18.1% in 2014.
The following notes were initially added to the graph presented in Fig. 2.2: international aviation and international marine bunkers have been included. Peat and oil shale have been aggregated with coal. For some countries, biofuels and waste final consumption data have been estimated. Other includes geothermal, solar, wind, heat, etc.
11
Figure 2.2 World total final consumption from 1971 to 2014
According to the statistics collected in the IEA website [4], industry, transport and buildings (residential and commercial) are the three main sectors in terms of energy demand, see Fig. 2.3. In this figure, IEA indicates that “non-energy use” deals with fuels that are used as raw materials in different sectors and are not consumed as a fuel or transformed into another fuel. “Non-specified” includes fuels that have not been classified elsewhere (e.g. military fuel use for mobile and stationary consumption).
Figure 2.3 World final consumption in 2014
The following sub-sections briefly outlines the major concerns about our global energy system.
2.1.1 Access to energy and world’s population growth
The energy supply is very different from a country to another, as illustrated in Fig. 2.4. Historically, countries that are member of the organisation for economic co-operation and development (OECD) are by far the countries that benefit from the largest share of the total energy supply.
12
Figure 2.4 Primary energy supply by region [3]
Nowadays, it has been estimated that 1.2 billion people do not have access to electricity, most of them are from sub-Saharan Africa or developing Asia, as illustrated in Fig. 2.5. This lack of modern energy access increases inequalities because such households are suffering the deprivation of lighting, communication, healthcare, etc. An additional issue is related to cooking because traditional inefficient stoves are fuelled by solid biomass in poorly ventilated spaces. The consequences are numerous: deaths related to diseases contracted because of the air pollution (mainly children below 5 years old and adults over 30 years old), forest and soil degradation, greenhouse gas (GHG) emissions, etc. As presented in [5], millions of lives can be saved by investing in access to modern cooking fuels.
Figure 2.5 Cooking and electricity access – Global inequalities [5]
Last but not least, another major issue is the growth of the world’s population. Indeed, a report from the Department of Economic and Social Affairs of the United Nations (UN) Secretariat [6], projected that the global population will increase by nearly one billion people over the next 13 years (reaching 8.6 billion in 2030), and will increase further to 9.8 billion in 2050 and 11.2 billion by 2100. A detailed report by regions is provided in table 2.1.
13
Region Population (millions)
2017 2030 2050 2100
Africa 1 256 1 704 2 528 4 468
Asia 4 504 4 947 5 257 4 780
Europe 742 739 716 653
Latin America and the Caribbean 646 718 780 712
Northern America 361 395 435 499
Oceania 41 48 57 72
World 7 550 8 551 9 772 11 184
Table 2.1 United Nations world population projections [6]
As presented in Table 2.1, the main increase in world’s population comes from Africa (expected to double by 2050, and then double again by 2100). Such projections on world’s population implies to wisely design our new global energy system because the demand for energy services will massively rise.
2.1.2 Environmental issues
In 2014, the world total supply was getting close to 14 000 Mtoe, see Fig. 2.6. By comparing the global energy supply to the final consumption, the efficiency of the energy supply system is around 70%. Questions arise with respect to the nature of primary energies that constitutes our total primary energy supply. Indeed, what is the impact of our energy consumption on earth resources and on the environment knowing that around 75% of our global energy supply comes from non-renewable resources, such as fossil fuels (coal, oil and natural gas) and nuclear energy (rare earth minerals). These resources cannot be renewed in a human timescale (at least some thousands years for carbon based materials) and their combustion contribute to the rise of the average temperature observed of the Earth’s climate system, as described in the fifth assessment report delivered by the Intergovernmental Panel on Climate Change (IPCC) [7]. In the global energy mix, oil, coal, natural gas, biofuels and waste, nuclear, hydro and renewable energy resources (solar, wind, geothermal, etc.) have a share of 31.3%, 28.6%, 21.2%, 10.3%, 4.8%, 2.4% and 1.4%, respectively [3].
Figure 2.6 World primary energy supply by fuel type [3]
This way of consumption mainly relying on fossil fuels is not sustainable and has to be changed. An international non-profit organization, Global Footprint Network, advertises about our ecological footprint (i.e. the impact of human activities on Earth resources) and estimated that mankind’s resources consumption is equivalent to 1.7 planets. This organization also warns every year about the “Earth overshoot day” which corresponds to the day when our global energy demand on nature exceeds what
14
Earth can sustainably yearly provide. In 2017, the Earth overshoot day was on the 2nd of august. It is to
notice that these calculations based on estimates and relying on equivalent factors is not accepted by all the scientific community but it seems important to make people aware that our way to produce and consume energy is not sustainable.
Climate models and scenarios of emissions
Fossil fuel combustion and industrial processes contributes to GHG emissions such as carbon dioxide (CO2), methane (CH4) and nitrous oxide (N2O). These gases remain in the atmosphere and are stored in
soils and in the ocean causing warmer global surface temperature, ocean acidification, retreat of glaciers, etc. Climate models are essential to assess the Earth system’s response to human activities and also our capacity to adapt to the predicted changes (ecosystems, economic activities, infrastructures, etc.). The main variables and parameters of climate models are illustrated in Fig. 2.7. Due to the complex interactions between several scientific disciplines (socioeconomic, environmental and technological trends), many parallel scenarios are studied in order to evaluate the uncertainties related to the potential consequences on the Earth’s system. A timeline highlighting the major developments in such models is presented in [8].
Figure 2.7 Main parameters involved in the climate system modelling [8]
According to the IPCC [7], around 50 Gt CO₂-eq were due to anthropogenic activities in 2010 and 65% of these global GHG emissions were related to fossil fuel combustion and industrial processes. The WWF [9] also warns to limit our GHG emissions in order to prevent a temperature rise above 2°C compared to the pre-industrial temperature level (mid-19th century). Indeed, such temperature can lead to massive reductions in biodiversity (animals and plants) and risks over vital resources (water, food, natural resources). From 1970 to 2012, the vertebrate population abundance has already decreases by 58% [9]: the business-as-usual (BAU) trajectory is unsafe. Some projections made by IPCC (called “representative concentration pathways” (RCPs)) predict the possible global rise of average temperatures by 2100 based on our annual anthropogenic CO2 emission trends, see Fig. 2.8. In 2014,
the concentration was around 400 ppm and it should not exceed 530 ppm to achieve the 2° C goal. By 2011, about 1900 Gt CO2have been emitted. Yet, the cumulative CO2emissions from anthropogenic
15
sources have to remain in a range of 2550 to 3150 Gt CO2. This is why our annual emissions have to be
reduced as presented in RCP 2.6 and RCP 4.5 in order to avoid irreversible changes.
Figure 2.8 Global anthropogenic CO2 emissions and possible temperature changes [7]
Several organizations propose scenarios of emissions assessing new global energy mix in order to guide policy makers for reducing carbon emissions. For example, the IEA [10] and the international renewable energy agency (IRENA) [11] have proposed scenarios that highlight the need of both improving energy efficiency and increasing the development rate of renewable sources in order to achieve universal and sustainable access to modern energy (for the IRENA, the global renewable share of the energy mix has to double by 2030). The négaWatt Association, a French non-profit organisation, also proposed a scenario for France involving a supplementary solution called the sufficiency [12]. Sufficiency is defined as a mean to “reduce the overall need for energy-using services through a better sizing, using, and sharing equipment, better organising land and society, etc.”. Based on this scenario for 2050, the French final energy consumption is nearly halved (sufficiency and efficiency contribute to 60% and 40%, respectively) and the renewable sources nearly cover 100% of the primary energy demand (40% from the biomass and more than 50 % from wind, solar and marine energies).
In [13], another strategy is proposed, the idea is to stabilize the global annual carbon emissions for the next 50 years and then decrease of about two-thirds during the 50 following years. The stabilization of emissions can be achieved by choosing 7 from the 15 proposed options that are technically available. One option involves the replacement of some energy produced with coal fuel by PV sources. To validate this option, authors claim that 2000 GWp are needed, which correspond to about 50 times the capacity that has been installed in 2014 (see section 2.2.3, Fig. 2.15). This example shows how complex is the shifting to renewable sources.
2.2 World electrification
Brilliant researchers such as André-Marie Ampère, Charles-Augustin de Coulomb, Benjamin Franklin and Alessandro Volta laid the foundations for electricity theory. Hence, electrification and oil development during the end of the 18th century have been the drivers of the second industrial revolution.
Thereafter, numerous inventions in the field of electrical science and technology enabled to make electricity be more convenient, more efficient and more accessible. The main milestones of this field have been listed by the Institute of Electrical and Electronics Engineers (IEEE) [available online at http://ethw.org/Milestones:List_of_IEEE_Milestones].
However, over the past 25 years, power generation and transport sectors have represented the main anthropogenic GHG emissions. In 2015 in the OECD countries, the power generation has been the
16
largest GHG emitting sector with a share of 39% in total emissions, followed by the transport (30%) and industry (11%) [14], as presented in Fig. 2.9.
Figure 2.9 Breakdown of CO2 emissions by sectors in OECD countries [14]
The expansion of electricity generation and evolution of supply sources in the global mix over the last four decades is presented in Fig. 2.10. It appears that electricity is mainly produced by non-renewable sources that are the most GHG emitting. This is why, a new energy policy called “energy transition” (or “green transition”) aims at encouraging the development of renewable energies and the decarbonisation of the global energy system. Moreover, in some countries, renewable energy sources are seen as a chance to ensure energy sovereignty and do not rely anymore on the availability of natural resources from another country (e.g. in order to avoid an energy crisis such as oil crisis in the 1970s).
Figure 2.10 Historical evolution of global electricity generation by fuel type [3]
2.2.1 Actual energy sources for electricity generation
Since the industrial revolution in the middle of the 19th century, the demand for non-renewable
resources such as oil, coal and natural gas have massively grown. In the 1950s, the American geologist
Marion King Hubbert suggested the decline and depletion of these resources, in particular oil for which he predicted the so-famous “peak-oil” of world crude-oil production (i.e. time when the maximum rate
17
of extracted oil resources has been reached). Three terms aim to evaluate the quantity of fossil fuel resources depending on the demonstrated estimation of recoverable fossil fuel under current economic and operating conditions: proved resources correspond to a reasonable certainty (above 90%), probable resources denote chances above 50% and finally, possible resources are the least probable resources (i.e. lower than 50% chance). According to the global fossil fuel statistics presented in [15], based on our consumption rate actual and proved reserves, depletion dates for oil, gas and coal are estimated in 2066, 2068 and 2126, respectively. Of course recent discoveries such as shale gas or oil sands (also called unconventional oil) in many countries are delaying the end of fossil fuels. The point is that energy from fossil fuel will be harder to extract and thus less cost-effective. This depletion can lead to major issues concerning energy access, and thus threatening food and water supplies.
Uranium is another non-renewable resource that is used in nuclear power plants (and also as a military
weapon). As fossil fuels, uranium is a vital resource for some countries such as France with 58 nuclear reactors providing 79% of the total electricity supply in 2012 [16]. The fission of uranium, nuclear chain reaction which generates large amounts of energy has a great advantage over the previously mentioned fossil fuels because the GHG emissions are very low. This is partly why in 2011 the GHG emissions per inhabitant in France were nearly 2 tCO2eq lower than the mean of the European Union (EU) countries
(9.1 tCO2eq [16]). Two main issues comes with nuclear energy: the safety of nuclear waste which are
harmful for thousands years and the nuclear risk in case of extreme weather conditions (e.g. Fukushima in 2011 which led some countries such as Germany to stop their nuclear production).
Concerning renewable sources, our planet offers thousands times more than our actual energy needs [17]. A diversified portfolio of energy technologies is available to harvest this renewable energy. The following sources of energy are listed by order of importance (from the actual greatest production to the lowest):
Bioenergy corresponds to energy created from the biomass such as biofuels and electricity from organic waste. The production of bioenergy accounted for 10.3% in 2014, approximately 1413 Mtoe [3]. Ethanol is one of the most famous biofuels worldwide, mainly produced in Brazil. The main drawback is that biofuel production is sometimes replacing food production. Hydropower is a very mature and efficient way to produce electricity from a stream of water.
Large hydroelectric dams have been constructed worldwide (e.g. the most powerful is the “three Gorges Dam” in China with an installed capacity of 22 500 MW). Such systems have a high capital cost and can have a large environmental impact (modified water streams, soil erosion, reshaped landscape to create large reservoirs, etc.), but this technology is low GHG emitting and the operating cost are low. Thus, the energy cost is relatively inexpensive [17] and numerous dams that benefit from reservoirs are often used as a very efficient storage system, called pumped hydroelectric energy storage (PHES).
Solar energy can be used to produce either thermal energy (concentrated solar thermal and concentrated solar power) or electricity (photovoltaic cells). Due to the large availability of sunlight, these solar-based technologies are widely developed and their cost is fast decreasing. More explanation about its development will be given in the next section.
Wind energy is producing electricity by converting mechanical power created by air flow through wind turbines. Onshore and offshore wind farms referring to a group of wind turbines that are installed in a land field and off the coast in large bodies of water, respectively. The latter ones are bigger because there are less constraints concerning the neighbourhood but the operation costs are higher. As for solar energy, the massive integration of such sources is an important challenge because the production of electricity is intermittent.
18
Geothermal energy refers to heat energy collected from the Earth at different depths of the ground. Some projects also aim at providing seasonal storage by injecting heated fluids in some cavities and pumping it back later at the same temperature.
Marine energy gathers technologies that use tidal stream, tidal range, waves, ocean temperature and salinity gradients. Nowadays the installed capacity is very small (around 0.5 GW in operation worldwide, 99% of them are from tidal range technology which is very similar to hydropower facilities) but the resources potential is huge [18]. One of the main challenges, except the reduction of both capital and operation cost, is to limit the impact on the ecosystem of marine animals (underwater noise, disruption of water streams, etc.).
Now that the main technologies of electricity supply have been defined, the following section aims at comparing them with sustainable indicators.
2.2.2 Indicators of sustainability
Since the creation of the United Nations Environment Programme at the Stockholm conference in 1972, international environmental conventions have been organized worldwide in order to promote an international policy dealing with environmental issues related to our energy system [19]. It is commonly accepted that the concept of sustainable development has been introduced worldwide in the Brundtland report (Our Common Future) in 1987: “Sustainable development is development that meets the needs of the present without compromising the ability of future generations to meet their own needs”. Nowadays, the sustainable development is often illustrated with a Venn diagram (see Fig. 2.11) highlighting the three pillars of sustainable development that are economic growth, environmental protection and social equality.
Figure 2.11 Venn diagram of sustainable development
In [20], the following list of sustainable indicators assessing power generating technologies has been presented: price of electricity generation, efficiency of energy generation, GHG emissions, land use, water use, social impacts, availability of resources and technological limitations. Given all these indicators, wind energy appears more sustainable than hydro energy (high social impacts and land use), then comes PV energy (that exhibits a poor efficiency, high generation cost and variable energy production), and finally geothermal (poor efficiency, high social impacts, GHG emissions and water consumption).
In order to evaluate the different sources of energy with the criteria of sustainable development described in Fig. 2.11, the following metrics can be used:

![Figure 2.10 Historical evolution of global electricity generation by fuel type [3]](https://thumb-eu.123doks.com/thumbv2/123doknet/2179800.10456/29.892.185.697.694.968/figure-historical-evolution-global-electricity-generation-fuel-type.webp)


![Figure 2.23 Worldwide EPBT of on-grid PV modules including all BOS components for the year 2010 [60]](https://thumb-eu.123doks.com/thumbv2/123doknet/2179800.10456/42.892.151.735.604.897/figure-worldwide-epbt-grid-modules-including-bos-components.webp)

![Figure 3.11 Design of an EDLC and movements of ions in the electrolyte [98]](https://thumb-eu.123doks.com/thumbv2/123doknet/2179800.10456/65.892.124.760.108.415/figure-design-edlc-movements-ions-electrolyte.webp)
![Figure 3.14 Normalized discharged capacity of three types of batteries evaluated for different C-rates at a working temperature of 25°C [101]](https://thumb-eu.123doks.com/thumbv2/123doknet/2179800.10456/68.892.226.666.352.710/figure-normalized-discharged-capacity-batteries-evaluated-different-temperature.webp)
![Figure 3.18 Calendar lifetime of lithium-ion batteries at 50°C, a) effect on nominal capacity, b) effect on internal resistance [112]](https://thumb-eu.123doks.com/thumbv2/123doknet/2179800.10456/72.892.122.777.782.1008/figure-calendar-lifetime-lithium-batteries-capacity-internal-resistance.webp)