is an open access repository that collects the work of Arts et Métiers Institute of
Technology researchers and makes it freely available over the web where possible.
This is an author-deposited version published in: https://sam.ensam.eu Handle ID: .http://hdl.handle.net/10985/7115
To cite this version :
Rindra RAMAROTAFIKA, Abdelkader BENABOU, JeanClaude MIPO, Stéphane CLENET Experimental characterization of the iron losses variability in stators of electrical machines -Transactions on Magnetics - Vol. 48, n°4, p.1629-1632 - 2012
Any correspondence concerning this service should be sent to the repository Administrator : archiveouverte@ensam.eu
Experimental characterization of the iron losses variability in stators of
electrical machines
R.Ramarotafika
1,2, A.Benabou
2, S.Clénet
1and J.C.Mipo
31L2EP/Arts et Métiers Paris Tech, 59000 Lille -France
2L2EP/Université de Lille1, Bâtiment P2, 59655 Villeneuve d’Ascq- France 3VALEO-Systèmes Electriques, 94000 Créteil-France
Abstract— Manufacturing processes may introduce a significant variability on the magnetic properties of claw pole generator
stators. The present work deals with the analysis of two groups of stator samples. The first group is composed of 28 slinky stators (SS) and the second group is composed of 5 stators, manufactured using laser cut stacked laminations (SL). Both groups are made from the same lamination grade and with the same geometrical dimensions. Characterization was carried out for several levels of excitation field at 50Hz. A noticeable variability has been observed on the iron losses for SS samples, whereas it appears to be not significant for SL samples. The loss separation technique has then been investigated for the SS samples. Results show that the variability of static losses is more important than the one of dynamic losses.
Index Terms— Iron losses, loss separation technique, slinky stator, variability
I. INTRODUCTION
HE manufacturing of electrical machines magnetic parts, from the cutting of laminations till the final magnetic core, requires several industrial processes. These can be more or less complex and may have an impact on the magnetic properties of the considered material, especially in terms of iron losses. Several works have been focused on the study of the influence on magnetic properties when different cutting and assembly techniques are used.
On the one hand, some works have been concerned by the study of cutting techniques such as guillotine [1], punching [2], [3] and laser [4]. The presented results showed that the magnetic properties of laminations are very sensitive to the cutting techniques. When comparing these techniques (guillotine, laser, punching) in terms of iron losses, differences from 10% to 20% are observed for 1.5T at 60Hz. The results presented in [2] show that the punching technique presents 20% to 30% of additional iron losses (when the material is not annealed), compared with those of a reference annealed sample. In [3], the variation of the static and dynamic components of the magnetic losses is studied more in detail for the punching technique, from observations on 4 wounded samples. The most important disparities have been observed in the static losses component, due to the deterioration of the magnetic structure of the material, whereas the change observed on the dynamic components is not significant.
On the other hand, the influences of sticking and welding processes are presented in [5]. A relative increase of specific losses after welding was observed in the whole range of the magnetic polarization, depending on the number of welding passes and grade of the non-oriented electrical steel. The increase of iron losses is up to 10% when comparing extreme configurations (highest and lowest number of welding passes). In comparison, the increase of the specific core loss after sticking is very low.
The work presented in [6] investigates the influence of laser cutting, compared with the guillotine technique, for 15mm width strip samples. An increase of iron losses from 10
to 30% was observed for the laser cut sample (compared to the sample obtained from guillotine cutting) for low and average induction levels. This impact is mainly due to the small width of the sample (the impacted region is non negligible regarding to the whole sample). Nevertheless, the laser cutting technique can have less impact on the iron losses if done carefully.
On the other hand, the influence cutting technique by punching on the iron losses can be reduced with a stress relief annealing of the cut or punched components.
According to these different results, studies related to the quantification of the influence of various manufacturing processes may vary with the experimental approach and the considered material. Therefore, it can not be considered suitable for an immediate use by electrical machine designers. The development of models that take account for these uncertainties is still relevant.
The present work is based on a statistical approach. It consists in quantifying the uncertainties of iron losses in the yoke of several stator samples used in claw-pole alternators. The first group consists of 5 stators made of stacked laminations (SL), and the second group is composed of 28 slinky stators (SS) (these are manufactured from a single strip of steel that is edge wound into a spiral). The influence of the manufacturing processes on the iron losses will be taken into account in a global way, including the pressing, welding, cutting and bending (for SS samples) processes. Loss separation will then be investigated in order to compare the static and dynamic components for both groups.
II. EXPERIMENTAL PROTOCOL-VARIABILITY
Both stator groups have the same geometry and are made from the same standard grade laminations M800-50A. They only differ in their manufacturing process: stacked laminations (SL group) and slinky stators (SS group). SL group manufacturing process consists in laser cutting in one piece the entire section of the core. The laser cutting was achieved carefully in order to avoid impact on magnetic properties. The SS group manufacturing process, on the other hand, consists on manufacturing the core from a long iron band, and by
punching progressively the slots. The band is then rolled up in a spiral way and welded on its outer perimeter. This method is used to reduce significantly the material waste. It requires special manufacturing techniques and production machines [7]. Note that all SS samples are issued from same batch and puncher.
The main purpose of the experiment is to quantify the variability of the iron losses of the stator sample’s yokes for both groups. To this end, primary and secondary windings have been realized along their yoke, as for the magnetic characterization of a toroidal sample: each stator sample has an excitation winding that creates a magnetic flux in the yoke along its perimeter, and a secondary winding is added to measure the magnetic flux density (figure1).
The experimental characterization is carried out under sinusoidal magnetic flux density and the quantity of interest are the iron losses Ps [W/kg], which are determined from the calculation of area of the measured B(H) hysteresis loop. The variability has been quantified using descriptive statistics, and by calculating the Coefficient of Variation (Cv), which is given by:
Cv= µσ
(1)
where µ is the empirical mean of the measured characteristics, and σ the empirical standard deviation (SD), for each considered Hmax level.A. Preliminary analysis
In order to verify that the variability of the iron losses are mainly related to the variability of the magnetic property of the material and not to the accuracy of measurements, of the windings and of the geometrical dimensions (which are uncertain due to the tolerances of fabrication), some preliminary investigations have been done.
Thirty repetitive measurements have then been carried out on one sample and for several maximum excitation fields, to investigate noise measurement. Results then give Cv less than 1%, for all the considered Hmax levels are, which mean that uncertainty related to measurement can be considered as negligible.
Influence of the manual winding has also been investigated by winding and re winding one sample 5 times. Results showed a Cv less than 0.5%, which mean also that uncertainty introduced by manual winding is not significant. Moreover, the nominal cross section area of the yoke (according to the manufacturer datasheet) has been used for the calculation of the magnetic flux density. Nevertheless, geometrical tolerances are defined for the manufacturing. To
investigate the influence related to these mechanical tolerances, the magnetic flux density, obtained from the nominal section, is recalculated using a uniformly distributed cross-section area inside the upper and lower tolerance values. For a given sample, the Cv of iron losses, corresponding to the uniformly distributed cross sections, is less than 1.17%.
According to this result, influence introduced by considering the nominal cross section of the yoke during the characterization is not significant. Therefore, and for each sample, nominal section has been considered.
According to these results, if a significant variability is identified among the stators samples, this can be linked directly to the degradation of the magnetic properties due to manufacturing processes.
B. Iron losses variability
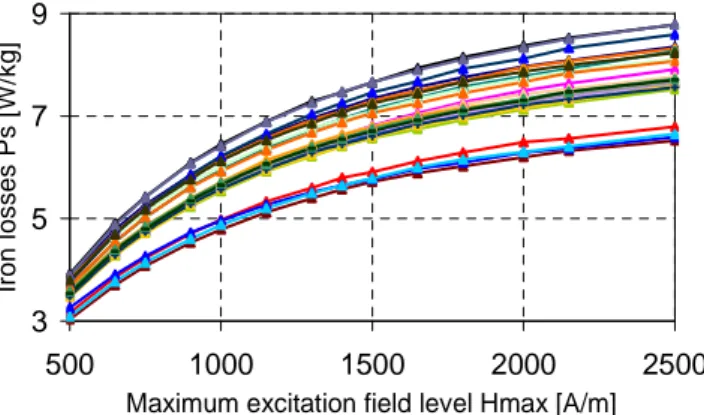
Both groups have been characterized for 14 levels of Hmax at a frequency of 50Hz. The iron losses for each sample of the SS group are reported in figure 2. As it is shown in this figure, variability of SS group iron losses is significant. The maximum disparity for two extreme stators for the whole Hmax level is between 22 % to 26%.
The Cv has then been calculated for all Hmax level and reported in figure 4. Calculated Cv is between 6.35% and 7.74%. According to the preliminary analysis above, the measured variability of the iron losses is greater than the variability introduced by the measurement noise, the fabrication tolerances and the manual winding.
Therefore, this variability may be linked directly to uncertainties on the magnetic properties of these samples. Moreover, and as those samples have been issued from a production chain, variability could be introduced by the manufacturing process.
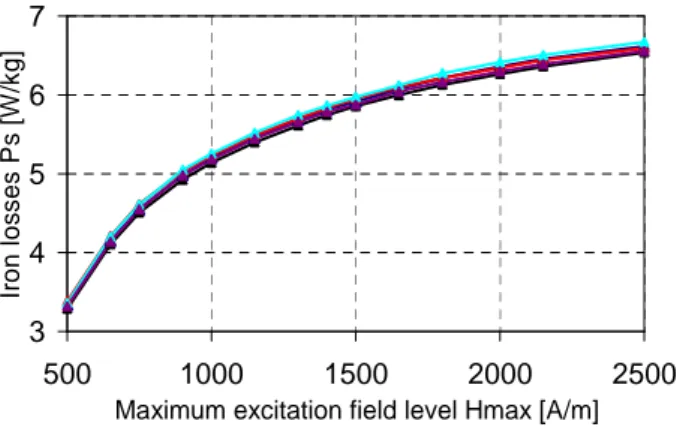
Iron losses for SL group are reported in figure3. It is shown that they are very close. Moreover, Cv for all the considered level of Hmax are less than 1%, which means that variability of SL samples is not significant. The quantified variability can be linked mainly to noise measurements and there is no variability for the iron losses of this group. Moreover, as these samples were manufactured especially for this study, the manufacturing process may be well controlled (laser cut lamination).
Fig 1: Manually wounded samples
3 5 7 9
500 1000 1500 2000 2500
Maximum excitation field level Hmax [A/m]
Ir o n l o s s e s P s [ W /k g ]
This experience confirms also that the noise measurement and the manual winding introduced a very low variability.
C. Average iron losses
In order to investigate the magnetic performance of both groups, their iron losses average, for each Hmax level, have been compared.
It has been realized by averaging, for each group, the iron losses for each level of the excitation field Hmax. It was then found that iron losses for SS group are higher than for SL group (figure 5), especially for the higher level of Hmax (2500
A/m), where the disparity is about 14%. Therefore, it can be concluded that the SL group is more efficient from iron loss point of view.
III. LOSS SEPARATION TECHNIQUES ON SS GROUP
A. Iron loss separation approach
In order to investigate the origin of the variability for the SS group, the loss separation techniques is applied.
According to the phenomenological principle proposed by Bertotti [8], the so-called loss separation approach, the average power losses per unit volume P can be decomposed into three components:
P = Pstat+Pclass+Pexc (2) where Pstat are the quasi-static hysteresis losses, Pclass are the classical losses (macroscopic eddy currents) and Pexc are the excess losses (dynamic behavior of the magnetic domains) [10]. Analytical models have been proposed to investigate these components that require the identification of parameters. These are dependant on the chemical and physical characteristics of the considered material [9-11]. Therefore, for a sinusoidal supply, the static losses can be approximated by the following well known equation proposed by Steinmetz [12], where Bmax is the peak value of the magnetic flux density, f the frequency and α the Steinmetz coefficient:
α
= h max
stat k fB
P
(3)
Classical losses, assuming the skin effect as negligible, can be obtained from:
Pclass=ke (fBmax)2 (4) Excess losses can be evaluated by the following equation: Pexc=kexc(fBmax)1.5 (5)
In order to identify the parameters (kh, α, ke, kexc), the iron losses have to be determined for several magnetic flux densities and frequencies, and used to minimize the function:
(
)
2 n 1 i meas P P∑
= ∗ − (6) where Pmeas is the measured iron losses, n the number of experimental data and P* the predicted iron losses.In our case, the characterization has been realized for 5 levels of Bmax (sinusoidal induction) and different values of the frequency (5Hz to 200Hz). It has been assumed that only static behavior, i.e. hysteresis losses, is involved at 5Hz. Coefficients kh, α, ke and kexc were identified for each stator sample of the SS group. The static and dynamic components are then calculated, and eventually their variability among the samples, especially at 50Hz.
B. Iron losses components variability
As mentioned above, parameters (kh, α, ke, kexc) have been identified for each SS sample, for the whole frequencies and 0% 2% 4% 6% 8% 500 1000 1500 2000 2500
Maximum excitation field level Hmax [Am]
C v o f ir o n l o s s e s P s [ W /k g ] SS SL
Fig 4: Cv of SS and SL groups iron losses Vs Hmax 3 4 5 6 7 500 1000 1500 2000 2500
Maximum excitation field level Hmax [A/m]
Ir o n l o s s e s P s [ W /k g ]
Fig 3: Iron losses curves for SL group
3 4.5 6 7.5
500 1000 1500 2000 2500
Maximum excitation field Hmax [A/m]
Ir o n l o s s e s P s [ W /k g ] SS SL
Bmax levels. Empirical mean and standard deviation Sd for these parameters are reported in table I, as well as their Cv. We have then assumed that dynamic losses are the contribution of Pclass and Pexc. It can be noticed from this table that the variabilities of dynamic losses component parameters ke and kexc are more important compared to those for static components parameters kh and α.
The linear correlation matrix of the 4 parameters is given in table II. It can be observed that the correlation between parameters ke and kexc is significant and follows a linear negative law. For a given frequency and level of induction, the corresponding losses will follow the same correlation law.
Then, as the global dynamic losses Pdyn can be written as the sum of classical and excess losses, this dynamic component has a lower variability than Pclass or Pexc. In fact, according to the property of the variance (the square root of the standard deviation Sd), when considering two dependant random variables with a negative linear correlation, the variance of their sum is lower. From table II, we can conclude also that correlation between static losses and dynamic losses is very small. Iron losses components Pstat, Pclass and Pexc have been then estimated according to those identified parameters and from relations given in (3), (4) and (5), for each sample, at the frequency of 50Hz.
The Cv of static and dynamic losses, for each Bmax level has been calculated according to the relation (1), and presented in figure 6. According to this figure, Cv of static
losses is more significant compared to the Cv of dynamic losses, for all Bmax levels. These variabilities may suppose the introduction of additional constraints during the enrolling of the laminations, which affect mainly the static losses, and much less the dynamic losses mainly related to the conductivity.
IV. CONCLUSION
Influence of the manufacturing processes on the iron losses has been investigated in this paper. Statistical approach was implemented from observations on two groups of stator samples at a frequency of 50Hz, and several levels of maximum excitation fields Hmax. It has been shown that variability of SS samples is more significant compared to SL samples. Loss separation techniques applied on these samples have shown that the variability of their static components is more significant compared with the one of their dynamic component. In the future, a stochastic model will be developed in order to take into account the variability of identified parameters related to each component, and thus the iron losses variability among SS samples.
REFERENCES
[1] A. Schoppa, J. Schneider, C.D. Wuppermann, “Influence of the manufacturing process on the magnetic properties of non-oriented electrical steels”, Journal of Magnetism and Magnetic Material Vol. 215-216, pp.74-78, 2000.
[2] A. Kedous-Lebouc, B. Cornut, J.C. Perrier, P. Manfé and T. Chevalier, “Punching influence on magnetic properties of the stator teeth of an induction motor”, Journal of Magnetism and Magnetic Materials Vol. 254-255, pp.124-126, 2003.
[3] A. Boglietti, A. Cavagnino, M. Lazzari, M. Pastorelli, “Effects of Punch Process on The Magnetic and Energetic Properties of Soft Magnetic Material”, Proceedings of Electric Machines and Drives Conference, IEMDC, pp.396-399, 2001.
[4] M. Emura, F.J.G. Landgraf, W. Ross, J.R. Barretta, “Influence of cutting techniques on the magnetic properties of electrical steels”, Journal of Magnetism and Magnetic Materials Vol. 254-255, pp. 358-360, 2003. [5] A. Schoppa, J. Schneider, C.D. Wuppermann, T. Bakon, “Influence of
welding and sticking of laminations on the magnetic properties of non oriented electrical steel”, Journal of Magnetism and Magnetic Materials Vol. 254-255, pp. 367-369, 2003.
[6] W.M. Arshad, T. Ryckebush, F. Magnussen, H. Lendenmann, B. Eriksson, J. Soulard, B. Malmross, “Incorporating lamination processing and component manufacturing in electrical machine design tools”, Proceedings of Industry Applications Conference, 42nd IAS Annual Meeting, pp. 94-102, 2007.
[7] F. Libert, J. Soulard, “Manufacturing Methods of Stator Cores with Concentrated Windings”, Proceedings of IET International Conference on Power Electronics, Machines and Drives PEMD, pp. 676-680, 2006. [8] G. Bertotti, “General properties of power losses in soft ferromagnetic
materials”, IEEE Trans. Mag. Vol. 24, N°1, pp. 621-630, 1998. [9] M. Amar and R. Kaczmarek, “A general formula for prediction of iron
losses under nonsinusoidal voltage waveform”, IEEE Trans. Mag. Vol. 31, N°5, pp. 2504-2509, 1995.
[10] A. Boglietti, A. Cavagnino, M. Lazzari, M. Pastorelli, “Two simplified methods for the iron losses Prediction in soft magnetic materials supplied by PWM Inverter”, Proceedings of Electric Machines and Drives Conference, IEMDC, pp.391-395, 2001.
[11] A. Boglietti, A. Cavagnino, “Iron loss prediction with PWM supply: An overview of proposed methods from an engineering application point of view”, Proceedings of Industry Applications Conference, 42nd IAS Annual Meeting, pp. 81-88, 2007.
[12] C.P. Steinmetz, “On the law of hysteresis”, American Institute of Electrical Engineers Transactions Vol 9, pp. 3-64, 1982.
4% 5% 6% 7%
0.75 0.9 1.05 1.2 1.35 1.5
Maximum flux density level Bmax [T]
C o e ff ic ie n t o f v a ri a ti o n C v % Cv of static losses Cv of dynamic losses
Fig 6: Coefficient of Variation of static and dynamic components of losses for SS group at 50Hz
TABLEII
LINEAR CORRELATION OF IDENTIFIED PARAMETERS
kh α ke kexc kh 1 0.35 -0.17 -0.04 α 0.35 1 -0.1 0.26 ke -0.17 -0.1 1 -0.64 kexc -0.04 0.26 -0.64 1 TABLEI
EMPIRICAL VARIABILITY OF IDENTIFIED PARAMETERS
Parameters kh α ke kexc
Mean 0.067 1.506 6.9x10⁻⁵ 52x10-5
Sd 47x10-4 23x10-3 9.19x10⁻⁶ 4.90x10⁻⁵