Science Arts & Métiers (SAM)
is an open access repository that collects the work of Arts et Métiers Institute of Technology researchers and makes it freely available over the web where possible.
This is an author-deposited version published in: https://sam.ensam.eu Handle ID: .http://hdl.handle.net/10985/15137
To cite this version :
Julien DEPARDAY, Patrick BOT, Frédéric HAUVILLE, Dario MOTTA, David LE PELLEY, Richard G.J. FLAY - Dynamic measurements of pressures, sail shape and forces on a full-scale spinnaker - In: The 23rd International HISWA Symposium on Yacht Design and Yacht Construction, Pays-Bas, 2014-11 - The 23rd International HISWA Symposium on Yacht Design and Yacht
Construction - 2014
Any correspondence concerning this service should be sent to the repository Administrator : archiveouverte@ensam.eu
DYNAMIC MEASUREMENTS OF PRESSURES, SAIL SHAPE AND FORCES ON A
FULL-SCALE SPINNAKER
J. Deparday, Naval Academy Research Institute, France P. Bot, Naval Academy Research Institute, France F. Hauville, Naval Academy Research Institute, France D. Motta, Yacht Research Unit, University of Auckland, New Zealand D.J. Le Pelley, Yacht Research Unit, University of Auckland, New Zealand
R.G.J. Flay, Yacht Research Unit, University of Auckland, New Zealand
SUMMARY
This work presents a full-scale experimental study on a sailing yacht in downwind conditions with simultaneous time-resolved measurements of pressures, sail shape and loads. Those on-water experiments on a J/80 class yacht permit the dynamic behaviour of the fluid structure system made of a light cloth sail and highly curved flow to be investigated. Aerodynamic forces on the asymmetric spinnaker were determined from pressure distribution and shape measurements and also from strain gauges located on the corners of the sail. Both time-averaged and instantaneous data are analysed.
The time-averaged pressures and forces were studied according to the apparent wind angle. The pressure distribution and thus the loads tend to decrease when the apparent wind angle is increased. The standard deviation of pressures was largest near the luff, decreasing downstream. Simultaneous time series recordings of the pressure distributions, flapping sail shapes, and forces in the sheets show a strong correlation. Flapping of spinnaker creates pressure peaks at the leading edge, increasing the aerodynamic forces dynamically by 50 to 70%. These results will also give reliable benchmark data to validate unsteady fluid structure interaction predictions from numerical simulations of downwind sails.
NOMENCLATURE
AWA Apparent Wind Angle AWS Apparent Wind Speed Cf Force coefficient 𝐶𝑓 =1 𝐹
2𝜌𝑆(𝐴𝑊𝑆)2
∆𝐶𝑝 Difference of pressure coefficient ∆𝐶𝑝 =𝑃𝑙𝑒𝑒𝑤𝑎𝑟𝑑− 𝑃𝑤𝑖𝑛𝑑𝑤𝑎𝑟𝑑 1
2𝜌(𝐴𝑊𝑆)2
FEPV Force Evaluation via Pressures and VSPARS 𝜌 Density of air 𝜌 = 1.25 𝑘𝑔/𝑚3
S Surface of the spinnaker 𝑆 = 63.1𝑚2 TWS True Wind Speed
VSPARS Visual Sail Position And Rig Shape YRU Yacht Research Unit
1. INTRODUCTION
To improve sail design and investigate sail aerodynamics, wind tunnel testing (Viola & Flay (2009); Le Pelley & Richards (2011); Renzsch & Graf (2013); Campbell (2014)) and numerical simulations -with more and more Fluid-Structure Interaction models- (Viola et al. (2014); Renzsch & Graf (2010); Chapin et al. (2011); Ranzenbach et al. (2013); Trimarchi et al. (2013)) are largely used. However those methods are not perfect (Wright et al. (2009)) and full-scale testing is required for comparison and validation (Viola & Flay (2011)) since they permit to determine yacht performance in real sailing conditions.
Aerodynamic loads can be assessed in a variety of ways through on-water experiments. Sail boat dynamometers (Herman (1989); Hochkirch & Brandt (1999); Masuyama (2014); Fossati et al. (2013)) have helped to improve performance prediction. Measuring loads on the rigging lines and sails (Augier et al. (2012)) has contributed to a better comprehension on wind/rig/sail interaction. Measuring pressure distribution and flying shape of a full-scale sail (Viola & Flay (2010); Le Pelley et al. (2012); Lozej et al. (2012); Motta et al. (2014)) has permitted useful insights into sail aerodynamics.
However the steady approach has been mainly used on those experiments since most of wind tunnel tests and numerical models output time-averaged data. Some dynamic investigations have been carried out for upwind measurements at full-scale (Augier et al. (2012)), in wind tunnel (Fossati & Muggiasca (2012a)) and numerically (Fossati & Muggiasca (2012b); Augier et al. (2013); Augier et al. (2014)). For downwind conditions, the dynamic behaviour is mainly investigated by numerical models (Lombardi et al. (2012); Durand et al. (2013)) using Fluid-Structure Interaction models. The flying shape of the spinnaker is highly dependent on the dynamic trimming and the instability of the flow. It is complicated to reproduce
those conditions in a wind tunnel. This is why full-scale testing in downwind condition has been carried out in the perspective of a better comprehension of sail dynamics.
This paper reports on research on sail aerodynamics for downwind condition using full-scale experiments, created thanks to a collaboration between the Yacht Research Unit, University of Auckland, New Zealand and the Naval Academy Research Institute, France. The aim of this first experiment was to develop reliable and accurate methods for acquiring simultaneously aerodynamic loads, pressures and sail shape as well as trying to better understand the dynamic regime of a spinnaker. Those experiments were carried out in the bay of Brest, France on an instrumented J/80 class yacht.
2. EXPERIMENTAL SETUP
Figure 1 shows the arrangement of the sensors on the J/80 class sailing yacht. They measure various boat data (speed, boat motion, position, heading …) as well as the wind data thanks to an ultrasonic 3D anemometer. Loads in the rigging and sails, the pressure and the flying shape of the spinnaker are also recorded. All sensors are linked to an inboard computer and communicate at their own frequency. Each sample is stored in a buffer at its own sampling rate thanks to a real-time acquisition software, RTMaps developed by Intempora. A resampling was applied during the post processing to obtain synchronous data for easier analysis. This setup is a further development of the experimental system presented in Augier et al. (2012). Load, pressure and flying shape measurements as well as the procedure applied are more detailed below.
Figure 1 General Arrangement of system apparatus on J/80
2.1 Loads
The corner points of the spinnaker (head, tack, and clew) are fitted with instrumented shackles. The sensors communicate wirelessly to the acquisition system. The clew sensor is connected via a wire running along the foot to a small light box located near the tack point of the spinnaker. This box contains two strain gauge amplifiers, one for the tack sensor and one for the clew. A microcontroller receives and transmits instantaneously data to the receiver inside the boat via a wireless an d low consumption ZigBee network. Another box is located at the head position for the head instrumented shackle.
The sampling frequency of all those load sensors is 25Hz. The error of measurement is less than 2% of the measurement range of 5000N.
2.2 Pressures on spinnaker
Differential pressures between the suction and pressure sides are recorded at different points along curves of the spinnaker. Ultra-low range differential pressure sensors (Honeywell SXCL04DC) are stuck on the sail cloth on one side and face a 2mm-diameter hole to acquire the pressure difference. On the other side, a light sail cloth patch punctured as well is applied to smooth the surface of the custom built pressure system made at the YRU, at the University of Auckland. Pressures are
recorded along 4 horizontal stripes at different heights. At 1/4, 1/2 and 3/4 of the spinnaker height, there are 12 transducers per horizontal stripe. The 4th stripe at 7/8th of the sail height has 8 transducers. There is a higher concentration of pressure taps near the leading edge, to be able to record leading edge suction peaks and similar features (see Figure 2). The pressure sensors have a sampling frequency of approximatively 40Hz and the resolution and range of the sensors fit the criteria for sailing applications. The pressure acquisition system is more described in Motta et al. (2014).
Figure 2 Picture of the spinnaker hoisted without the mainsail with VSPARS stripes in orange and lines of pressure taps
2.3 Flying shape
Three waterproof outdoor purpose GoPro Hero 2 are mounted on the deck. Two are used for the mainsail, and one for the spinnaker. The video cameras have a frame rate of 25Hz, a good resolution (1280x960), and a wide field of view with an angle of 150°.
A sail analyser software VSPARS (Visual Sail Position And Rig Shape) is used during post-process to acquire the flying shape of the spinnaker. Three visualization stripes in orange are required at 20%, 40% and 70% of the sail height (see Figure 1 and Figure 2). The VSPARS system was developed in the YRU at the University of Auckland by Le Pelley and Modral (Le Pelley & Modral (2008)). The system is able to dynamically track the stripes, calculate the stripe coordinates in 3D space thanks to the known position of the camera and its distortion.
2.4 Force Evaluation via Pressures and VSPARS (FEPV)
The FEPV system uses the output files from VSPARS and the pressure system to obtain the aerodynamic forces and moments. From VSPARS, the 3D position of the stripes and the known tack and head positions permit to recreate the whole surface of the spinnaker. Unfortunately the foot shape cannot be captured by the camera as it is out of the camera field of view. Spline curves joining the leech points and the luff points are created and extended up to the known tack, head and clew positions. An optimisation process scales the foot in both longitudinal and transverse directions to match the calculated length. The sail surface is then interpolated by a fine quadrilateral mesh.
The pressure measurement system gives discrete pressure values. From the pressure tap positions, an interpolation scheme based on the Radial Basis Function interpolates the pressures to the centre of each geometrical cell of the mesh. Forces are computed by integrating the pressures on each cell area and directed with their normal direction. The system is more described in Motta et al. (2014).
2.5 Procedure
Sea trials were performed in the bay of Brest, offshore Ecole Navale. Those measurements are separated in two periods”1” and “2” corresponding to experiments carried out in the morning and in the afternoon. During both periods, the weather conditions were stable:
- average true wind speed: 6 m/s (12kts)
- gust: 8m/s (16kts)
- wind direction: 270° (westerly wind). Stable. Flat water.
The spinnaker was adjusted to be at the optimum trim. The trimmer did not fix the spinnaker sheet and could smoothly adjust to be on the verge of luffing at the leading edge. The Apparent Wind Angle (AWA) was kept constant as much as possible.
3. RESULTS
3.1 Time-average results
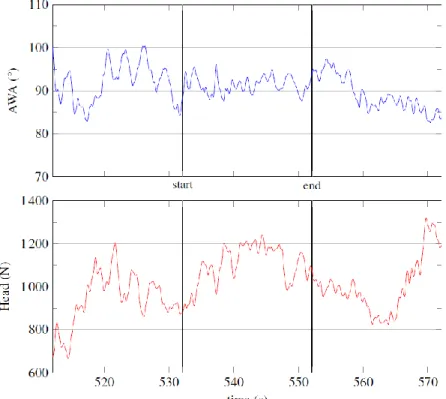
At downwind courses, the environment is unsteady and dynamic: massively separated flow, flexible and soft sail, waves, helming, etc. Thus only time periods of 20 seconds were chosen where the standard deviation of the AWA was below 5° and of the Apparent Wind Speed (AWS) below 1kt (0.5m/s). In Figure 3, time series are shown during 40 seconds for the AWA and the load measured at the head of the spinnaker. When the standard deviations are below the thresholds, the 20s "stable" period is between the two vertical lines. To choose a "stable" period, only criteria on the input like the wind have been used. Loads are seen as an output and thus can fluctuate much more as shown in Figure 3. The average loads and pressure distribution are compared according to the AWA. A large range of AWA has been met in a rather constant TWS: from 5.8m/s to 7.1m/s thus between 11.2kts to 13.8kts.
Figure 3 Evolution of AWA and Head load during 40s of a run. 20s “stable” run detected between the two vertical lines
3.1 (a) Spinnaker Loads
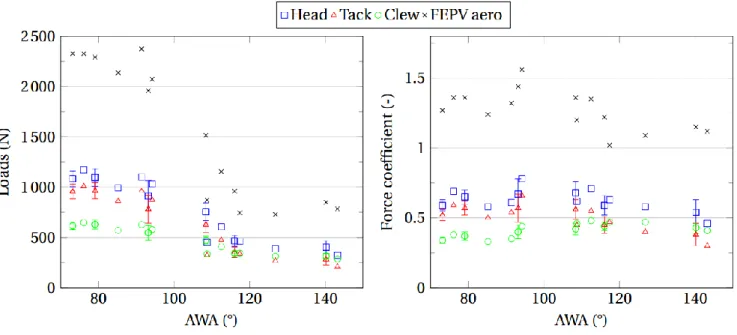
According to Figure 4, for the 3 corners the loads decrease when the AWA is increased. The highest load is found at the head of the sail. The tack load is in the same order of magnitude (around 1000N at 70° to 300N at 140°). Clew point is almost half loaded for tight angle till 90° whereas it has the same order of magnitude for AWA larger than 120°. The FEPV system calculates the total aerodynamic force produced by the spinnaker. From AWA 70-80° to AWA 120-150°, the aerodynamic force is divided by 3. Above 120°, it stays rather constant. The smaller loads at higher AWA are mainly due to the reduced AWS when running downwind.
To compare without the influence of the AWS, Figure 4 also shows the load coefficients. Head and tack force coefficients are rather constant according to the AWA and seem to slightly decrease for AWA larger than 110°. Whereas the clew force coefficient slightly increases in concordance with the smaller decrease rate of its load. The total aerodynamic force coefficient calculated by FEPV seems to slightly decrease when AWA is bigger than 110°.
Figure 4 Loads on corners of the spinnaker.
Error bars indicate the standard deviation obtained during one 20s “stable” run
3.1 (b) Pressures
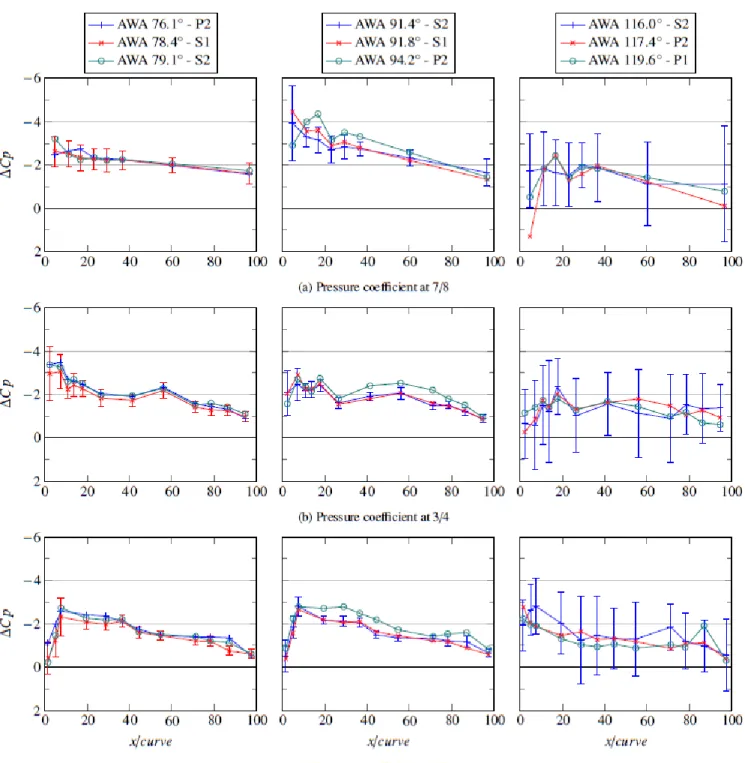
Pressure measurements performed correctly even though in the afternoon the first stripe at 1/4th height of the sail did not record any measurements. However, we can compare the three stripes 1/2, 3/4 and 7/8 for most of the measurements. Results are reported in Figure 5 for both tacks and for two periods of the day (in the morning and afternoon). In all figures, the pressure difference is leeward minus windward, thus giving negative values. The pressure coefficient plots have the negative direction upwards as commonly used. The suctions are generally higher over the entire surface for lower AWA. At 3/4 and 1/2 stripes, the pressure distribution has similar behaviour. The leading edge suction peak is sometimes wide enough to be seen by the first pressure tap of the stripe. Then a pressure recovery is present at around 10 to 20% of the curve followed by a higher suction due to the sail curvature. Towards the trailing edge, the suction decreases. At 7/8th stripe, the pressure distribution is flatter and decreases along the curve. It is probably due to the more detached flow at the top of the spinnaker.
For tight AWA up to 120°, the trends of the pressure along the curve are similar for close AWA even for both tacks and at two periods of the day. It demonstrates a good repeatability. However for larger AWA the pressure distribution along the curve is more scattered. At higher AWA, it is more likely the air flow around the spinnaker is detached. Furthermore, due to lower AWS, the flying sail is less stretched and more curved. The entire sail shape is less stable, and therefore increasing the risk of collapsing and instabilities.
Figure 5 Differential pressure coefficients at different heights of the spinnaker along curve for different AWA. P: Port tack, S: Starboard tack, 1: Set 1 (morning), 2: Set 2 (afternoon).
Error bars indicate the standard deviation during the 20s “stable” recording
3.1 (c) Standard deviations
Even during the “stable” runs where AWA and AWS are almost constant, pressure loads and flying shape fluctuate because of the unsteady nature of the “wind/spinnaker” system. This section presents the standard deviations of measured quantities to analyse the fluctuation amplitudes.
In Figure 4, standard deviations of loads are around 8% of the averages at the head and tack of the spinnaker for an AWA around 70-90°. Standard deviations for an AWA between 100° and 140° are around 11 to 20% of the average loads. The aerodynamic forces are highly dependent on the flying shape and thus the trimming. For greater AWA, as seen in Section 3.1 (b), the flying shape is less stable, resulting in bigger variations of aerodynamic loads.
In Figure 5, for AWA between 70° and 110°, the standard deviation is rather small around 0.2, except at the leading edge where it is around 0.8 and can exceed 1. This higher standard deviation reveals the high suction peak and the flapping of the luff. For AWA bigger than 110°, the standard deviation of the pressure is much higher, of the same order of magnitude than the mean value of ∆𝐶𝑝.
Despite good repeatability of mean pressures and loads, the standard deviations highlight instabilities. At low AWA, at its optimum trim, the flying shape is very sensitive to the Angle of Attack. At high AWA, the flow around the spinnaker is massively separated and the shape is more unstable. The dynamic behaviour of the spinnaker for low AWA (78°) is more investigated in the next section.
3.2 Time-resolved results
For this section, we will only focus on a few seconds of a 20 second run where 𝐴𝑊𝐴̅̅̅̅̅̅̅ = 77.8° and 𝑠𝑡𝑑(𝐴𝑊𝐴) = 4.7 < 5°. This run was chosen even if the mainsail was not hoisted, because the spinnaker was slightly flapping and though the AWA was quite stable.
Flapping of spinnaker, high peaks of suction at leading edge, and extremum in forces are strongly correlated to each other as revealed in Figure 6.
Figure 6 describes space-time diagram of ∆𝐶𝑝(𝑥, 𝑡) (Figure 6 (a) and (b)) and time series of ∆𝐶𝑝(𝑡) close to the leading edge, at about 2% of the curve length (Figure 6 (c)) and force coefficients of corner loads (Figure 6 (d)). Positive pressure difference appears when the spinnaker is curling. Just before the spinnaker starts folding, the minimum of loads and suction are spotted. During the curling of the spinnaker, low suction area starts from the leading edge, evolves up to 15-20% of the curve, and then this area is reduced from the centre to the leading edge. During this diminution, high suction area replaces the low suction zone. So it occurs from 20% of the curve and reaches the leading edge at the end of the curling of the spinnaker. At that moment loads are also at their maxima.
For better explanation, we focus on 4 different instants, described in Table 1, of a flapping starting at 67.5s and ending at about 69s.
Minimum of suction and loads appear at instant A. Spinnaker loads are about 25% less than the average load recorded during this 20 second. At that moment, low suction areas are detected from 40% of the curve length up to the trailing edge, and also at the leading edge if the luff is folded like at the 3/4 stripe. The spinnaker starts luffing as snapshot a) of Figure 7 demonstrates. During a flapping, the minimum of suction does not appear when the spinnaker folds the most but before when the flying shape is almost full. As noticed just before instant "A", there is a loss of suction on the whole curve, thus sail cloth is less loaded. It might be the cause of the flapping since the spinnaker is less stretched.
Instant B and C are "intermediate" moments during flapping. For both heights, the low suction area increases from the
leading edge up to about 15% of the curve length correlated with the increase of folded luff area. The maximum of luffing occurs and then the unfolding starts. The low suction area decreases from the inner part of the curve towards the leading edge. This low suction area is replaced by a very high suction zone which develops from 20% of the curve length to the leading edge. Nevertheless, this sequence does not occur at the same time for both heights. At instant B, the 3/4 stripe recovers and the low suction area is reduced while at the 1/2 stripe, low suction area is increased and the spinnaker starts luffing. At instant C, the latter stripe is still curling whereas the 3/4 has recovered its full shape (see snapshot b) and c) of Figure 7. The curling wave propagates downwards from the top of the luff, as well as the recovery to full shape.
Figure 8 highlights also the change from a low suction area to a high suction region. The recovery of a curling to a full flying shape (instant C) produces high suction just behind the folded part of the sail. It also increases the suction from 20% up to the trailing edge. Despite the curling, high suction produced behind the folded area compensates and permits to increase the loads at the three corners of the spinnaker.
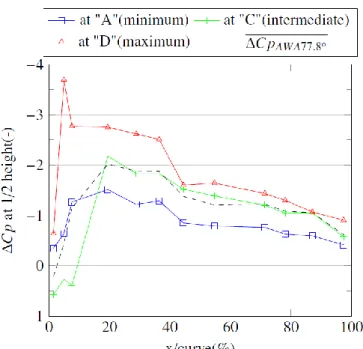
Maximum of loads and suction occur at instant D. The high suction area has reached the leading edge and produces also a peak of loads of about 35% higher than the average loads. As shown in Figure 8, |∆𝐶𝑝| is much higher (about 1.5 more) than the average pressure distribution from 0 to 40% of the curve length and still slightly higher (about 0.5) up to 80 90% of the curve length. The maxima of suction at 1/2 and 3/4 heights occur exactly at the same time. The duration of this high suction peak is quite short compared to the period of curling especially at 1/2 height (1.5s of flapping compared to 0.5s of high pressure difference).
This short but strong increase of suction might be due to the fast recovery of the flying shape. The quick deceleration of the luff creates a “whiplash” giving a consequent added mass of air. It can also be related to a local increase of the flow speed amplifying locally ∆𝐶𝑝 .
Figure 6 Evolution in time of the pressure distributions and loads on spinnaker
Space-time diagrams of ∆𝐶𝑝(𝑥, 𝑡) at 3/4 height (a), at 1/2 height (b); time series of ∆𝐶𝑝(𝑡) at x/c=0.2 on both 3/4 and 1/2 height (c); time series of force coefficient of loads measured on the sail corners (d)
curling curling curling
curling curling curling curling
(a)
(b)
(c)
Table 1 Meaning of instants A, B, C and D A 67.7s Minimum of pressure and loads B 68.1s Intermediate step
C 68.5s Intermediate step D 68.9s Maximum of pressure
a) Flying shape for instant A b) Flying shape for instant B
c) Flying shape for instant C d) Flying shape for instant D Figure 7 Snapshots of the flying shape during flapping
Figure 8 Details of pressure distribution at 1/2 height at minimum (A), when recovering (C), at maximum (D) and average pressure distribution for equivalent AWA for comparison
3.3 Spinnaker load and FEPV aerodynamic force measurement
In this section, we discuss the general trend and differences between spinnaker loads measured directly from load cells on the sail corners and aerodynamic force calculated by FEPV. For this process, FEPV calculations have been carried out every 5 frames (i.e. at 5Hz). At each instant, the force has been calculated combining the instantaneous sail shape (as obtained with VSPARS) and the instantaneous pressure distribution.
Figure 9 Evolution of dynamic force coefficient during 25s. Force coefficient measured at head of spinnaker (Head) and total aerodynamic force calculated by FEPV.
In Figure 9, the spinnaker aerodynamic force magnitude calculated by FEPV and the load measured at the head of the spinnaker are plotted. Since the directions of the loads on the corners were not measured, quantitative comparison is not relevant. However their dynamics can be observed. The trend is similar for both load coefficients. They have similar low frequency behaviour. The local maxima found in the head force coefficient also occur most of the time in the aerodynamic force. However the force coefficient calculated by an instantaneous flying shape and instantaneous pressure distribution varies on a bigger range and quicker than the force measured at the head of the spinnaker. The standard deviations explain as well the difference of dynamic attitude. For the aerodynamic force calculated by FEPV, the standard deviation is about 26% of the average, while for measured loads the standard deviations are only 13% of their mean values. The difference of
dynamics could indicate a damping effect between the dynamic pressure and the aerodynamic force given by the spinnaker to the sailboat. The dynamic viscoelastic behaviour of the sail cloth Nylon, but also of the sheets might give a structural damping. A variation of shape or the curvature itself might also absorb some energy and thus limit high speed variations of loads.
This difference of dynamic behaviour might also come from the amount of pressure taps on the spinnaker. High suction areas occur and disappear quickly in small local regions. A rough discretization might lead to overestimate or underestimate those peaks of pressure. The pressures and flying shape are highly correlated. Errors in the flying shape acquisition (especially at the leading edge) might increase the inaccuracy of force as well.
Nonetheless, the average aerodynamic force calculated by instantaneous shapes and pressures is 30% lower than the aerodynamic force calculated by an average shape and an average pressure distribution. If the FEPV computation is seen as an operator Ƒ, Ƒ((𝑃(𝑥, 𝑡), 𝑆ℎ𝑎𝑝𝑒(𝑡))̅̅̅̅̅̅̅̅̅̅̅̅̅̅̅̅̅̅̅̅̅̅̅̅̅̅̅ ≠ Ƒ(𝑃(𝑥,𝑡)̅̅̅̅̅̅̅̅̅, 𝑆ℎ𝑎𝑝𝑒(𝑡)̅̅̅̅̅̅̅̅̅̅̅̅) because pressures and flying shape are dependant variables to each other. This difference highlights the importance of the dynamic effects and the strong correlation between the flying shape and pressure distribution.
4. CONCLUSIONS
Full-Scale experiments have been carried out on a J/80 sailing yacht in downwind condition where boat data, loads, pressures and flying shape on a spinnaker were simultaneously measured. From a steady approach, loads on the spinnaker decrease when running downwind. Despite clear trends according to the AWA, the variations of loads during a "stable" 20 second period are significant; the standard deviations are 10 to 20% of the average value. It is also confirmed by the pressure distributions on the spinnaker. A good repeatability of the pressure distribution is shown up to an AWA of about 120°, even though a high standard deviation is found especially at the leading edge, 30% of the differential pressure at the luff. For greater AWA, the standard deviation is in the same order of magnitude than the mean differential pressure itself; the AWS is lower and the flow around the sail more detached. Thus the entire sail shape is less stretched, more curved and less stable preventing optimal trim during long periods of time. This non-optimum trim and low dynamic pressure drive to greater pressure fluctuations increasing this instability.
Even for tighter AWA, there is a strong correlation between pressure, load and flying shape fluctuations. Minimum of suction appears just before the curling of the luff; and the recovery from the folded flying shape of the spinnaker creates a high suction peak at the leading edge. This might be due to the sudden deceleration of the sail cloth when it reaches its original full shape creating added mass of air. At that moment, the loads reach also a maximum.
However those high fluctuations of pressure are dampened. The transmission of the aerodynamic loads from dynamic pressure on the sail to tension in the lines acts as a low-pass filter maybe due to the curvature of the sail and the dynamic viscoelasticity behaviour of the sail cloth and of the sheets.
To even better assess the aerodynamic loading, FEPV system could be refined with a better discretised pressure distribution on the sail and more accurate flying shape acquisition with more VSPARS visualisation stripes. This is actually an on-going research. Further experiments will also be carried out with a more specific and stricter procedure to minimize any unwanted perturbations. Further studies will also focus on investigating the dynamics of the spinnaker for deeper AWA and analyse the influence of different parameters which could affect the spinnaker dynamic performance.
5. ACKNOWLEDGEMENTS
This project has received funding from the European Union's Seventh Programme for research, technological development and demonstration under grant agreement No PIRSES-GA-2012-318924, and from the Royal Society of New Zealand for the UK-France-NZ collaboration project SAILING FLUIDS.
REFERENCES
Augier, B., Bot, P., Hauville, F., Durand, M., "Dynamic behaviour of a flexible yacht sail plan", in Ocean Engineering, 66, pp.32–43, 10.1016/j.oceaneng.2013.03.017, 2013
Augier, B., Bot, P., Hauville, F., Durand, M., "Experimental validation of unsteady models for fluid structure interaction: Application to yacht sails and rigs", in Journal of Wind Engineering and Industrial Aerodynamics, 101, pp.53–66, 10.1016/j.jweia.2011.11.006, 2012
Augier, B., Hauville, F., Bot, P., Aubin, N., Durand, M., "Numerical study of a flexible sail plan submitted to pitching: Hysteresis phenomenon and effect of rig adjustments", in Ocean Engineering, (26 m), pp.1–10,
10.1016/j.oceaneng.2014.06.040, 2014
Campbell, I.M.C., "A comparison of downwind sail coefficients from tests in different wind tunnels", in Ocean
Chapin, V.G., de Carlan, N., Heppel, P., "A Multidisciplinary Computational Framework for Sailing Yacht Rig Design & Optimization through Viscous FSI", in 20th Chesapeakse Sailing Yacht Symposium, Annapolis, 2011
Durand, M., Lothode, C., Hauville, F., Leroyer, A., Visonneau, M., Floch, R., et al., "FSI Investigation on Stability of Downwind Sails with an Automatic Dynamic Trimming", in 3rd International Conference On Innovation in High
Performance Sailing Yachts, Lorient, 2013
Fossati, F., Muggiasca, S., "An experimental investigation of unsteady sail aerodynamics including sail flexibility", in 4th
High Performance Yacht Design Conference, Auckland, pp. 222–231, 2012a
Fossati, F., Muggiasca, S., "Motions of a sailing yacht in large waves: an opening simple instationary modelling approach", in 22nd HISWA Symposium on Yacht Design and Yacht Construction, Amsterdam, 2012b
Fossati, F., Muggiasca, S., Bayati, I., "LECCO INNOVATION HUB SAILING YACHT LAB PROJECT A Sailing Research Infrastructure", in 3rd International Conference On Innovation in High Performance Sailing Yachts, Lorient, 2013
Herman, J.S., "A sail force dynamometer: design, implementation and data handling", Massachussets Institute of Technology. 1989
Hochkirch, K., Brandt, H., "Fullscale hydrodynamic force measurement on the Berlin sailing dynamometer", in 14th
Chesapeake Sailing Yacht Symposium, Annapolis, pp. 33–44, 1999
Lombardi, M., Cremonesi, M., Giampieri, A., Parolini, N., Quarteroni, A., "A strongly coupled fluid-structure interaction model for wind-sail simulation", in 4th High Performance Yacht Design, Auckland, pp. 212–221, 2012
Lozej, M., Golob, D., Bokal, D., "Pressure distribution on sail surfaces in real sailing conditions", in 4th High Performance
Yacht Design Conference, Auckland, pp. 242–251, 2012
Masuyama, Y., "The work achieved with the sail dynamometer boat “Fujin”, and the role of full scale tests as the bridge between model tests and CFD", in Ocean Engineering, pp.1–12, 10.1016/j.oceaneng.2014.06.037, 2014
Motta, D., Flay, R.G.J., Richards, P.J., Le Pelley, D.J., Deparday, J., Bot, P., "Experimental investigation of asymmetric spinnaker aerodynamics using pressure and sail shape measurements", in Ocean Engineering,
10.1016/j.oceaneng.2014.07.023, 2014
Le Pelley, D., Modral, O., "V-spars: a combined sail and rig shape recognition system using imaging techniques", in 3rd
High Performance Yacht Desing Conference, Auckland, pp. 57–66, 2008
Le Pelley, D., Morris, D., Richards, P., "Aerodynamic force deduction on yacht sails using pressure and shape measurements in real time", in 4th High Performance Yacht Design Conference, Auckland, pp. 28–37, 2012
Le Pelley, D., Richards, P., "Effective Wind Tunnel Tesing of Yacht Sails Using a Real-Time Velocity Prediction Program", in 20th Cheasapeake Sailing Yacht Symposium, Annapolis, 2011
Ranzenbach, R., Armitage, D., Carrau, A., "Mainsail Planform Optimization for IRC 52 Using Fluid Structure Interaction", in 21st Chesapeake Sailing Yacht Symposium, Annapolis, 2013
Renzsch, H., Graf, K., "An experimental validation case for fluid-structure-interaction simulations of downwind sails", in
21st Chesapeake Sailing Yacht Symposium, Annapolis, 2013
Renzsch, H., Graf, K., "Fluid Structure Interaction Simulation of Spinnakers–Towards Simulation Driven Sail Design", in
21st HISWA Symposium on Yacht Design and Yacht Construction, 2010
Trimarchi, D., Vidrascu, M., Taunton, D., Turnock, S.R., Chapelle, D., "Wrinkle development analysis in thin sail-like structures using MITC shell finite elements", in Finite Elements in Analysis and Design, 64, pp.48–64,
10.1016/j.finel.2012.09.005, 2013
Viola, I.M., Bartesaghi, S., Van-Renterghem, T., Ponzini, R., "Detached Eddy Simulation of a sailing yacht", in Ocean
Viola, I.M., Flay, R.G.J., "Force and pressure investigation of modern asymmetric spinnakers", in Internation Journal of
Small Craft Technology, Transaction RINA, 2009
Viola, I.M., Flay, R.G.J., "On-water pressure measurements on a modern asymmetric spinnaker", in 21st HISWA
Symposium on Yacht Design and Yacht Construction, Amsterdam, 2010
Viola, I.M., Flay, R.G.J., "Sail pressures from full-scale, wind-tunnel and numerical investigations", in Ocean Engineering, 38(16), pp.1733–1743, 10.1016/j.oceaneng.2011.08.001, 2011
Wright, A.M., Claughton, A.R., Paton, J., Lewis, R., "Off-Wind Sail Performance Prediction and Optimisation", in 2nd