On the Assessment of the CO2 Emissions from the Industrial
Sector: the Role of Energy and Exergy Analysis Methods, an
Approach to Enhance Sustainable Strategies
BY
RAUL ARANGO MIRANDA
MANUSCRIPT BASED THESIS PRESENTED TO ÉCOLE DE
TECHNOLOGIE SUPÉRIEURE IN PARTIAL FULFILLMENT
FOR THE DEGREE OF DOCTOR OF PHILOSOPHY
Ph. D.
MONTREAL, AUGUST 20, 2019
ÉCOLE DE TECHNOLOGIE SUPÉRIEURE
UNIVERSITÉ DU QUÉBEC
This Creative Commons licence allows readers to download this work and share it with others as long as the author is credited. The content of this work may not be modified in any way or used commercially.
BOARD OF EXAMINERS
THIS THESIS HAS BEEN EVALUATED BY THE FOLLOWING BOARD OF EXAMINERS
Mr. Robert Hausler, Thesis Supervisor
Department of construction engineering at École de technologie supérieure
Mr. Rabindranarth Romero Lopez, Thesis Co-supervisor Faculty of civil engineering at University of Veracruz
Mr. Patrick Sears, President of the Board of Examiners
Department of mechanical engineering at École de technologie supérieure
Mr. Mathias Glaus, of the Jury,
Department of construction engineering at École de technologie supérieure
Mr. Adrian Vazquez, External Evaluator
Professor, Autonomous University of Ciudad Juarez
THIS THESIS WAS PRENSENTED AND DEFENDED
IN THE PRESENCE OF A BOARD OF EXAMINERS AND THE PUBLIC ON JULY 5TH, 2019
ACKNOWLEDGMENTS
I would like to express all my gratitude to Ph.D. Robert Hausler and Ph.D. Rabindranath Romero, my research director and co-director, respectively, for sharing their experience and expertise during the development of my doctoral studies at STEPPE; their patience, guidance, kindness and friendship towards me were the motivation to start my career as researcher. I thank to the board of examiners for accepting to review my thesis and providing me with valuable comments and suggestions. I would also like to thank Maria Cendan, for her friendship, advises and support even before my arrival to Quebec. Also, thanks to all my colleagues and friends with whom I shared these past years at ETS.
My gratitude also to Mexico’s National Council for Science and Technology (CONACYT) and to the Veracruz Council for Scientific Research and Technological Development (COVEICYDET) for the Ph.D. scholarship (No. 218934) granted.
In addition, I will like to say thanks to the SARA student service at the ETS, particularly to Prasun, whose reviews and comments to the articles and thesis were very helpful.
In memory of My Dad, Don Manuel Arango, he will be so proud; also thanks to my Mom, even far from here, she is with me since day one, thanks Jova, homage in life. I love you both guys.
Finally, a very special thanks to my family: Maria del Rocio and Emma Rocio, for being my rock in this Canadian adventure, with their smile they are the light and the reason of my life, particularly during all the ups and downs on this long road to the Ph. D. Thanks girls. You know that at the end of this long road, this is for you. You are here with me and together we will make our next adventure, even better than this one. All my love and gratitude for you girls, you are the best, forever and ever… so, I tried to be like you, try to feel it like you do. But without you it’s no use.
Sur l'évaluation des émissions de CO2 du secteur industriel; le rôle des méthodes d'analyse d'énergie et d'exergie, une approche pour renforcer les stratégies durables
Raul ARANGO MIRANDA
RÉSUMÉ
La croissance démographique, l'urbanisation rapide et les progrès technologiques ont entraîné une augmentation de la demande en énergie. Au cours des 50 dernières années, les sociétés du monde entier se sont transformées de manière plus rapide et incessante. La croissance de la population a entraîné la génération de mégapoles; parallèlement, la croissance économique de ces régions entraîne une grande consommation de biens. Cela défi la disponibilité des ressources naturelles ; en conséquence, la relation de l'unité industrielle avec son environnement urbain a été modifiée dans le but de créer le moins d'impact possible sur le paysage.
L’augmentation de la population, du PIB et des exportations au cours des dernières décennies a entraîné la croissance de l’industrie manufacturière et du transport de marchandises. Globalement, le secteur industriel reste l’un des trois principaux consommateurs de combustibles fossiles; par conséquent, il s'agit de l'une des principales sources de gaz à effet de serre (GES), entraînant des problèmes pour l'environnement et la santé. En Amérique du Nord en particulier, le secteur industriel représente environ 50% de la consommation totale d'énergie et plus de 30% des émissions totales de dioxyde de carbone (CO2).
Une définition simple de l'exergie affirme que l'exergie est l'énergie disponible pour être utilisée. Les applications antérieures d’exergy comprennent la comptabilité des ressources, les économies d’énergie, l’analyse de systèmes complexes et l’amélioration de l’efficacité. L’objectif général de cette recherche était de valider l’utilité de l’analyse exergétique en tant qu’outil permettant d’aider les décideurs à concevoir des politiques énergétiques et environnementales futures, tant au sein d’institutions publiques que privées, en vue de renforcer les stratégies durables. Pour explorer la pertinence de l’exergy, une approche géographique a été appliquée pour analyser trois niveaux géographiques différents (global, régional et local). Par la suite,, analysez les principaux facteurs d'émissions de CO2, dans le cadre des hypothèses relatives à la courbe de Kuznets dans l'environnement (EKC), y compris les indicateurs d'exergie.
Afin d’examiner la pertinence de l’analyse des exergies, nous avons introduit de nouveaux indicateurs des émissions de CO2 (consommation d’énergie-exergy et efficacité
énergétique-exergétique), ainsi que des indicateurs établis des émissions de CO2 (produit intérieur brut,
intensité énergétique, intensité carbonique, ouverture commerciale et l’index du développement humain) pour étudier leur pertinence en tant qu’indicateurs.
Nous avons utilisé ces travaux de recherche pour formuler des recommandations sur la manière d’appliquer l’analyse exergétique à grande échelle (secteurs de la société) et de fournir les outils nécessaires pour effectuer une analyse exergétique à l’aide de ces données, afin de mieux s’appliquer à ce secteur industriel particulier.
A l’échelle global, les résultats montrent une forte corrélation entre le CO2, le PIB, la
consommation d’énergie, l’intensité énergétique et l’ouverture commerciale est observée, d’autre part, des valeurs statistiquement non significatives concernant l’ouverture des marchés et l’intensité énergétique. À l'échelle régionale, la causalité de Granger a été trouvée dans les variables d'exergie proposées aux États-Unis et au Mexique; L'ouverture commerciale a également montré une causalité au Canada et aux États-Unis. Finalement, au niveau local, le secteur industriel mexicain est encore peu efficace en termes d’efficacité exergétique, par rapport aux pays développés.
Les résultats de l’approche méthodologique appliquée menée pour les trois niveaux géographiques proposés dans la thèse confirment l’adéquation des méthodes exergy en tant qu’outil d’aide à la conception de politiques énergétiques et environnementales, aussi bien au sein d’institutions publiques que de sociétés privées, en tant qu’approche visant à améliorer las stratégies durables. En particulier pour les décideurs des trois pays de l'ALENA l’exergie s’avère utile en raison de l'impasse actuelle des négociations, non seulement pour lutter contre les émissions de CO2, mais aussi pour promouvoir la croissance de la part des énergies
renouvelables. L'ajout de l'indicateur exergétique fournit un aperçu intéressant des stratégies énergétiques et environnementales. Cette thèse a montré la nécessité d'accélérer les processus de décarbonatation; il a été démontré que la méthode d'analyse d'exergie offre une approche non traditionnelle du droit de réduire les émissions de gaz à effet de serre et contribue à le développement durable.
Mots-clés: analysés d’exergie, analysés d’énergie, secteur industriel, émissions du CO2,
On the assessment of the CO2 emissions from the industrial sector: the role of energy and exergy analysis methods, an approach to enhance sustainable strategies
Raul ARANGO MIRANDA
ABSTRACT
Growing population, rapid urbanization and technological advancements have resulted in increasing energy demand. During the last 50 years, societies around the world have been transforming in a faster and incessant way. The growth of the population has resulted in the generation of mega-cities; at the same time, the economic growth of these areas entails consumption of goods. It is challenging the availability of natural resources; as a result, the relationship of the industrial unit with its urban environment has been changing in the pursuit to create the minimum possible impacts to the landscape.
This constant increase in population, gross domestic product and exports in the last decades has resulted in the growth of the manufacturing industry and the transportation of goods. Globally, the industrial sector remains as one of the three main consumers of fossil fuels; hence, it is one of the prime sources of greenhouse gases (GHG), resulting on environmental and health problems. Particularly in the North American region, the industrial sector embodies about 50% of the total energy consumption and more than 30% of the total carbon dioxide (CO2) emissions.
A simple definition of exergy affirms that exergy is the energy that is available to be used. Some applications of exergy include resource accounting, energy conservations, complex systems analysis and efficiency improvements. The general objective of this research was to validate the suitability of exergy analysis, as a tool to assist decision makers in the design for future energy and environmental policy, both in public and private institutions as an approach to enhance sustainable strategies. To explore the appropriateness of this indicator, a geographical approach was applied to analyze three different geographic levels (global, regional and local). Additionally, analyze the main drivers of CO2 emissions, within the framework of the environmental Kuznets curve (EKC)
hypotheses, including exergy indicators.
In order to explore the appropriateness of exergy analysis, new indicators of CO2 emissions
(energy-exergy consumption and energy-exergy efficiencies) were introduced, with the goal to be compared to traditional indicators of CO2 emissions (gross domestic product, energy
intensity, carbon intensity, trade openness and human development index) to study their suitability as indicators.
Results of these thesis gives recommendations on how to apply exergy analysis on a large scale level (societal sectors) and to provide the tools necessary for exergy analysis, using this data, so as to better be applicable to this particular industrial sector. At global level, the results shows high correlation between CO2, GDP, energy consumption, energy intensity and
intensity. At regional level, granger Causality was found from proposed exergy variables in the USA and Mexico to CO2 emissions; also causality was detected in Canada and the US
from trade openness to CO2 emissions. Finally, at the local level (study case), poor exergy
efficiency is still occurring in the Mexican industrial sector, compared with developed countries.
The outcomes of the applied methodological approach conducted for the three geographical levels proposed in the thesis, confirms the suitability of exergy methods as a tool to assist the design of energy and environmental policy, both in public institutions or private corporations as an approach to enhance sustainable strategies. Particularly, for policymakers of the three NAFTA countries, exergy proves value due the current impasse of negotiations, not only for tackling CO2 emissions, but also for promoting growth in the renewable energy share. The
addition of the exergetic indicator provides an interesting insight on energetic and environmental strategies. This thesis showed the need to speed de-carbonization processes; it was demonstrated that the exergy analysis method provides a non-traditional approach in the right to reduce GHGs and contribute to sustainable development.
Keywords: exergy analysis, energy analysis, industrial sector, CO2 emissions, sustainability,
TABLE OF CONTENTS
INTRODUCTION ...1
CHAPTER 1 LITERATURE REVIEW ...7
1.1 Atmospheric pollution and sustainability ...7
1.2 Industrial sector environmental assessment ...8
1.2.1 Principles of air pollution emissions assessment; greenhouse gases (GHG) and Carbon dioxide (CO2) ... 12
1.3 Energy and exergy analysis ...15
1.3.1 Theoretical background ... 15
1.3.2 Exergy of fuels ... 17
1.3.3 Energy and exergy efficiency evaluation methods ... 19
1.4 The Environmental Kuznets Curve (EKC) ...19
CHAPTER 2 PRESENTATION OF THE RESEARCH PROJECT ...23
2.1 Work approach: Exergy analysis for environmental policies and regulations ...23
2.2 Problem statement ...24
2.3 Working hypothesis ...25
2.4 Objectives ...26
2.5 Methodological framework ...27
CHAPTER 3 CARBON DIOXIDE EMISSIONS, ENERGY CONSUMPTION AND ECONOMIC GROWTH: A COMPARATIVE EMPIRICAL STUDY OF SELECTED DEVELOPED AND DEVELOPING COUNTRIES. “THE ROLE OF EXERGY” ...31
3.1 Introduction ...32
3.2 Data sources ...36
3.2.1 Countries selection criteria ... 36
3.2.1.1 Socio-economic criteria ... 36
3.2.1.2 Environmental criteria ... 37
3.3 Methods...38
3.3.1 Exergy analysis theoretical background ... 38
3.3.1.1 Exergy of a flowing stream of matter ... 39
3.3.1.2 Exergy of fuels ... 40
3.3.2 Linear correlations coefficients (R) detection ... 40
3.3.3 Econometric analysis ... 41
3.4 Results and discussion ...42
3.4.1 Energy and exergy analysis ... 42
3.4.2 Linear correlations, empirical evidence ... 44
3.4.3 Econometric analysis of empirical results ... 46
3.5 Conclusions ...50
CHAPTER 4 ECONOMIC GROWTH, ENERGY AND THE ENVIRONMENTAL KUZNETS CURVE IN NORTH AMERICAN COUNTRIES (NAFTA PARTNERS) ...53
4.2 The EKC, sustainability, energy and exergy analysis ...55
4.3 The NAFTA countries ...59
4.4 Data and Methodology ...59
4.4.1 Data ... 59
4.4.2 Countries socio-economic and environmental profiles ... 60
4.4.3 Methods... 60
4.4.4 Exergy analysis ... 61
4.4.4.1 Theoretical Background (the exergy approach) ... 61
4.4.4.2 Exergy of a flowing stream of matter ... 62
4.4.4.3 Exergy of Fuels ... 62
4.5 Econometric analysis ...63
4.5.1 Ordinary least squares test ... 64
4.5.2 VAR test... 65
4.5.3 Granger causality test ... 65
4.6 Empirical Results ...66
4.6.1 Ordinary least squares test ... 66
4.6.2 VAR test... 68
4.6.3 Granger causality test ... 69
4.7 Conclusions and policy implications ...73
CHAPTER 5 AN OVERVIEW OF ENERGY AND EXERGY ANALYSIS TO THE INDUSTRIAL SECTOR, A CONTRIBUTION TO SUSTAINABILITY ...77
5.1 Introduction ...78
5.2 Methodology ...80
5.2.1 Theoretical Background ... 81
5.2.2 Computation of the Thermodynamic Efficiencies: Energy (η) and Exergy (ψ) ... 83
5.2.3 Computation of the exergetic renewable share (ERS) ... 89
5.3 Study Case ...90
5.3.1 Mexico; economic, energetic and environmental issues of the industrial sector ... 90
5.3.2 Data sources ... 91
5.4 Results ...92
5.4.1 Mexican Industrial Sector (MIS) exergy consumption ... 92
5.4.2 Mexican Industrial Sector (MIS): energy (η) and exergy (ψ) efficiencies ... 93
5.4.3 Mexican Industrial Sector (MIS) Exergetic Renewable Share (ERS) ... 93
5.5 Discussion ...94
5.5.1 Approach to Update the Exergy Analysis Method Applied to the Industrial Sector: Case Study Application ... 94
5.5.2 Mexican Industrial Sector: energy and exergy consumptions and efficiencies ... 95
5.5.3 Mexican Industrial Sector (MIS): thermodynamic efficiencies comparison to detect areas in need of improvement ... 98
XIII
5.5.4 Mexican Industrial Sector (MIS) exergetic renewable share (ERS)
compute and comparison with overall exergy efficiencies ... 100
5.5.4.1 Mexican Industrial Sector (MIS) comparison of exergy efficiencies (ψ) and exergetic renewable share (RS) as sustainable indicators ... 101
5.5.4.2 Mexican Industrial Sector (MIS) comparison of exergy efficiencies (ψ) and exergetic renewable share (ERS) with other countries... 103
5.6 Conclusions ...105
CHAPTER 6 GENERAL DISCUSSION ...107
6.1 Summary of research work ...107
6.1.1 Preliminary results regarding correlation among variables (EKC exploration) ... 108
6.1.2 Results appiying the EKC methods ... 111
6.1.3 Suitability of energy-exergy and environmental variables ... 117
6.1.4 Limitations and uncertainty of the results ... 118
6.2 Operational implications of exergetic indicators ...119
6.3 Future venues of research ...121
CONCLUSIONS...123
LIST OF TABLES
Page
Table 1-1 Brief summary of the environmental Kuznets curve literature review ...22
Table 2-1Methodological approach ...28
Table 3-1 Environmental variable, comparison of ...37
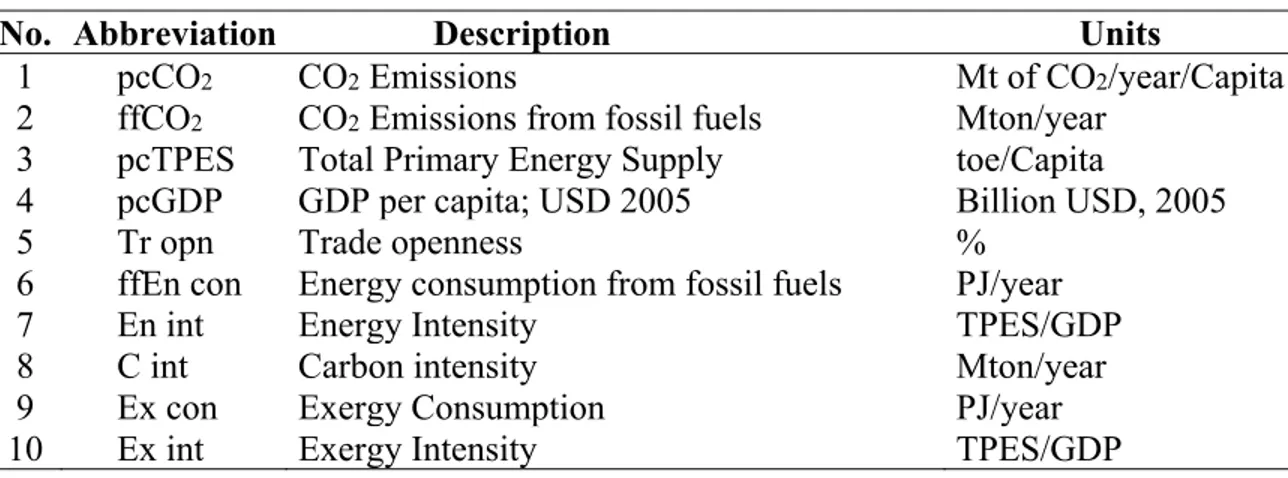
Table 3-2 Multivariable framework summary (International Energy Agency (IEA), 2018) ..41
Table 3-3 Exergy consumption rates of countries, year 2014 ...43
Table 3-4 Correlation coefficients matrix ...45
Table 3-5 Summary of empiric results of the multi-variable framework ...47
Table 3-6 Regression results of ffCO2 emissions ...47
Table 3-7 Regression of ffCO2 emissions and pcGDP ...48
Table 4-1 Variable definitions and descriptive statistics (average values by 3 countries) ...61
Table 4-2 EKC parameters for NAFTA Countries ...66
Table 4-3 Granger causality test ...70
Table 5-1 Properties of the most common energy sources. ...83
Table 5-2 Data heating processes for industrial activities, adapted from Utlu (Utlu & Hepbasli, 2007a) ...86
Table 5-3 MIS thermodynamic efficiency results: energy (η) and exergy (ψ), 2000–2015 ....87
Table 5-4 MIS evolution of the exergetic renewable share, from 2000 to 2015 ...94
LIST OF FIGURES
Page
Figure 1-1 Urbanization around the world. Adapted from UN (I. Nations, 2018) ...8
Figure 1-2 Countries with the largest ecological footprint and the number ...9
Figure 1-3 Comparison of environmental assessment tools. From Loiseua, 2013. ...10
Figure 1-4 CO2 emissions (Mt) by geographic. From IEA, 2017 ...12
Figure 1-5 World CO2 emissions from fuel combustion (Mt). From IEA, 2017...13
Figure 1-6 The staircase of environmental management systems. ...15
Figure 1-7 Graphical structure of society economic sectors; adapted from Utlu, 2007 ...17
Figure 5-1 MIS energy consumption rates, 2000-2015 ...88
Figure 5-2 Mexican Society Sectors, 2015 ...92
Figure 5-3 MIS average values of thermodynamic efficiencies, 2000–2015: ...97
Figure 5-4 MIS average energetic and exergetic efficiencies, ...99
Figure 5-5 MIS evolution of exergy efficiencies and exergetic ...100
Figure 5-6 Comparison of countries exergy efficiencies and exergetic ...104
Figure 6-1 Global level correlation curves: a) GDP per capita vs CO2 per capita emissions.108 Figure 6-2 Regional level correlation curves: a) GDP per capita vs CO2 per capita ...110
Figure 6-3 Global level Kuznets curve: a) GDP per capita vs CO2 per capita; ...112
Figure 6-4 Regional level Kuznets curve (the USA). a) Trade openness vs CO2 per capita. 114 Figure 6-5 Local level Kuznets curve (Mexico): a) Energy intensity vs CO2 per capita. ...116
LIST OF ABREVIATIONS
C int Carbon intensity
CC Climate change
CO2 Carbon dioxide emissions
ED Environmental degradation
Ef Exergy of fuels
EG Economic growth
EKC Environmental Kuznets Curve En int Energy Intensity
EnC Energy consumption
EnvCAN Environment and Climate Change Canada Ex con Exergy consumption
Ex int Exergy intensity
ExC Exergy consumption
Exergy Ch Chemical exergy of the system under study
Exergy Kn Kinetic exergy of the system under study
Exergy Ph Physical exergy of the system under study
Exergy Pt Potential exergy of the system under study
Exergy sys Exergy of the system under study
ffCO2 Carbon dioxide emissions from fossil fuels
ffEncon Energy consumption from fossil fuels GDP Gross domestic product
GW Global warming
HHVf High heating value of fuels
IEA International Energy Agency
OECD The Organization for Economic Co-operation and Development pcCO2 Carbon dioxide emissions per capita
pcGDP Gross domestic product (GDP) per capita; USD 2005 pcTPES Total primary energy supply per capita
PCF Product carbon footprints RED Renewable energy directive
SEMARNAT Secretaria de Medio Ambiente y Recursos Naturales, México Tropn Trade openness
UN The United Nations
UNIDO The United Nations Industrial Development Organization USEPA The United States Environmental Protection Agency
WB World Bank
γf Exergy grade function
NAFTA The North American Free Trade Agreement IEA The International Energy Agency
LIST OF SYMBOLS AND UNITS OF MEASUREMENTS
GJ/t giga joules per tonne GWh giga watt hour
kg kilogram
kj kilojoules
Mton million tonnes
MtCO2-eq million tonnes of carbon dioxide-equivalent
Mtoe million tonnes of oil-equivalent
MWh megawatt-hour
PJ petajoule
Atm pressure (atmospheres) C temperature (degree Celsius) K temperature (degree Kelvin) USD United States dollar
INTRODUCTION
Growing population, rapid urbanization and technological advancements have resulted in increasing energy demand. Modern societies require huge amounts of products and services, the consumption rates are constantly increasing, putting pressure in natural resource consumption, with undesired decline in forest and agricultural lands, solid waste generation, pollution of water basins and air pollutants. Growing consumption trends of citizens increase the pressure on the industry to satisfy such demands. Globally, the industrial sector remains as one of the main consumers of energy, mostly from fossil fuels, particularly the heavy industry. In 2016, total global gas emissions continued to increase by about (+/- 1%) to about 49.3 gigatonnes in CO2 equivalent (Gt CO2 equiv). Most of the emissions (about 72%)
consist of CO2 (Jos GJ Olivier, Schure, & Peters, 2017).
Since early 70’s, first versions of environmental laws were focused to detect, control and minimize the harm caused by pollutants. To combat these negative effects, after the Rio Conference in 1992 (Keating, 1994), new comprehensive and preventive approaches were developed to support the theory of sustainable development, such as the life cycle assessment, industrial ecology, industrial symbiosis, etc.
In December 1997, while meeting in Kyoto, Japan, for the 3rd Conference of Climate
Change, representatives from 160 countries were developing specific climate protection objectives and the options available to achieve them.
A key point to better inform decision makers, at governmental or private level is the proper use of energy policies and the development of environmental regulations. An essential part of the use of energy is the application of energy analyses in the industrial sector. Among Gong and others (Gong & Wall, 2001, 2016; Hammond & Stapleton, 2001), Scholars agree that exergy analyses are a great fit to complement energy analysis with the goal to enhance the performance of industrial processes. So far, it is mainly used as a complement to the energy
concept, to describe, analyze and improve energy systems and processes (Gong & Wall, 2001). Reistad (G. M. Reistad, 1975) acquainted one the first definitions of exergy:
“Availability or exergy is defined as the thermodynamic property that measures the potential of a system to do work when restricted by the inevitable surroundings at To, Po, (dead state temperature and pressure).” Recently (BoroumandJazi, Rismanchi, & Saidur, 2013), defines exergy as:
“The maximum amount of work that can be produced by a system or a flow of matter or energy in equilibrium with its surroundings”
For the purposes of this thesis, when referring to exergy, the definition of BoroumanJazi will be considered. Exergy can be used to detect inefficiencies of a process by locating the degradation of energy. Mandatory regulatory instruments, as exergy analysis, are tools that address sectorial-level greenhouse-gas emissions; they include, i.e. EU’s Renewable Energy directive (RED), etc. A growing number of public and private voluntary product carbon footprints (PCF) schemes are also being applied (J. F. Peters, Petrakopoulou, & Dufour, 2014).
Also, this thesis applies the Environmental Kuznets Curve (EKC) hypothesis, since it is the most influential model for relating CO2 emissions to economic development to answer an
important question in environmental economics: must economic development come at the expense of environmental degradation, or is there some tendency for pollution to fall after the economy achieves a certain level of income?
In this context, the general objective of this work is validate the suitability of exergy (an environmental accounting method belonging to the energy analysis approach, to assist energy and environmental practitioners and research efforts for future policies and regulations at governmental institutions and private firms. The thesis is composed of five chapters described below.
3
Chapter 1
Present the review of the literature used as a theoretical and practical basis for the development of the work, summarizing a background of the main concepts, methodologies and ensemble approaches in energy and exergy analysis methodologies, similarly the environmental concepts of the environmental Kuznets curve and sustainability.
Chapter 2
Introduce the concept of exergy and the exergy analysis methodology, also the approach of the environmental Kuznets curve (EKC) is applied to study co-relationships between carbon dioxide (CO2), GDP and energy consumption using panel data estimation techniques in a set
of 10 countries (developed and developing) during the period 1971-2014. The results could help to analyze, compare and improve energy and environmental directives and policies for practitioners. This article was published in the journal Energies, Oct 2018 (MDPI editions).(R. Arango-Miranda, R. Hausler, R. Romero-López, M. Glaus, & S. Ibarra-Zavaleta, 2018a) Arango-Miranda, R., Hausler, R., Romero-López, Carbon dioxide
emissions, energy consumption and economic growth: A comparative empirical study of selected developed and developing countries. The role of exergy. Energies, 11(10), 2668. Preliminary data and results reported in this article were presented at the 2017 INNOVATIONMATCHMX International Congress; May 31 to June 2, 2017, in Mexico City, Mexico.
Chapter 3
Shows the research results in the article entitled: “Economic growth, energy and the environmental Kuznets curve in North American Countries (NAFTA partners)". It is focused to study the correlations at regional level; the variables of trade openness and exergetic renewable share are proposed to detect the main drivers of CO2. An analysis is proposed to
study corelationship between carbon dioxide (CO2), GDP and energy consumption using
panel data estimation techniques in the North American region including Canada, Mexico & the U.S.A. The hypothesis of the environmental Kuznets curve (EKC) is tested and then confirmed. The results are proposed as tools for practitioners and legislators for future energy
and environmental directives and policies. Preliminary data and results reported in this article were presented at the 2016 INOVATIONMATCH MX, International Congress; April 6 to 8, 2016, in Guadalajara, Jal., Mexico.
Chapter 4
Shows the research results in the article entitled "An Overview of Energy and Exergy Analysis to the Industrial Sector, a Contribution to Sustainability". A study case in the Mexican Industrial Sector is developed. Exergy analysis is proposed and lifted to study the Mexican industrial sector as a study case. The results support the need to employ exergy analysis to complement the prevailing energy-based methods utilized to develop official reports or environmental and energetic policies and strategies, once it was demonstrated that exergy provides key elements to improve the energetic performance. This work was published in the journal Sustainability (MDPI Editions), Jan 2018. Arango-Miranda, R., Hausler, R., Romero-López, R. (2018). An overview of energy and exergy analysis to the industrial sector, a contribution to sustainability. Sustainability, 10(1), 153. Preliminary data and results reported in this article were presented at the 2016 INNOVATIONMATCHMX International Congress; April 5 to 8, 2016, in Guadalajara, Jal. Mexico. A similar methodology was applied to study the industrial sector of Quebec, Canada. Results of this work will be presented as an oral presentation at the ACFAS 87e International Congress,
2019 edition, in Ottawa, Canada, May 27-31, 2019.
Chapter 5
Summarizes all the work accomplished in this thesis, linking the outcomes in the different chapters, while highlighting their benefits and limitations. Presents theoretical and operational implications arising from the results and findings obtained during the development of the work, as well as the main considerations for future research venues.
In this work, the study of the main drivers of CO2 emissions is based on the detection of the
correlation between them, for which statistical analysis, particularly the theory of the Kuznets environmental curve (EKC), was applied. These theories establish different data compilation
5
criteria over time. Also, the selection of variables included economic, social, environmental and exergetic indicators. In Chapter 2, at global geographic level, a sample of ten was studied in a period of 44 years. In Chapter 3, at regional geographic level, a sample of three countries was selected for a period of 15 years. In Chapter 4, at local geographic level, a study case is presented including the analysis of the Mexican industrial sector (MIS).
CHAPTER 1 LITERATURE REVIEW
1.1 Atmospheric pollution and sustainability
The biggest challenge of sustainability is to achieve society-economy-environment balance, once the world population increase, urban areas grow to be able to accommodate people, demanding jobs, consumer goods and services. Consequently the request for finished products grows constantly and thus the need for greater quantity and diversity of products to fulfil such needs (United Nations Human Settlements Programme, 2010). Conversely, unsustainable lifestyles or unsustainable consumption of societies play a key challenge to reach sustainable development.
Since the latter part of the 18th century, humans have been altering the Earth at an unprecedented and unsustainable rate and scale by radical consumption rates. According with Hoekstra, assessing land, water, energy, material, and other footprints along supply chains is paramount in understanding the sustainability, efficiency, and equity of resource use from the perspective of producers, consumers, and government (Hoekstra & Wiedmann, 2014).
In developed countries, even environmentally minded and environmentally active people often consume far beyond their fair share of global emissions (Lenzen & Cummins, 2011). In an era of social media, this consumption trends has been rapidly widespread. These impacts are related to the structure as well as the level of consumption (Thøgersen, 2014) and has implications on energy and environmental policy.
Nowadays, more than half the world's population lives in urban areas, thus, it is predicted that by the year 2050, most of the geographic regions will be predominantly urban (see Figure 1-1).
Growing population, urbanization always growing and technological advancements have resulted in increasing energy demand. Disproportionate population growth over the last 70 years is associated with the development of mega-cities.
Figure 1-1 Urbanization around the world. Adapted from UN (I. Nations, 2018)
1.2 Industrial sector environmental assessment
Consumption of fossil fuels as the main source of energy is triggering environmental degradation. Particularly, large emissions of green-house gases (GHG) associated with urban regions are leading to unsustainable societies. CO2 emissions are the most important GHG,
by 2016 reaches near 72% of the total amounts of GHG (Jos GJ Olivier et al., 2017). Anthropogenic CO2 from the burning of fossil fuels are the primary cause of global warming
(Davis & Caldeira, 2010).
The industrial sector faces the challenge to meet this high demand for manufacturing goods and simultaneously, optimize resources and reduce impacts of its activities. Figure 1-2, describes a list of the countries with the largest ecological footprint globally. The mega-cities will multiply globally, compromising key natural reserve areas; therefore, the new industrial challenge is to mimic nature to be able to remain inside or close to the urban region and fill up with the demands required by future societies (Susan, 2017; United Nations Industrial Development Organization (UNIDO), 1997), avoiding long travel distances to omit the increase of CO2 emissions by transport materials, products and workers.
9
Figure 1-2 Countries with the largest ecological footprint and the number of earths needed to satisfy their consumption lifestyles.
From Statista, infographics. (Dyfed Loesche, 2017)
Paradoxically, while industrial activities mean benefits for human development in the form of consumer goods and services, these products came with by-products, and environmental pollutants (air emissions, solid wastes, wastewater, etc.), due industrial process’s inefficiencies (United Nations Human Settlements Programme, 2013). Many changes in environmental laws have been occurring since recent decades, subsequently new comprehensive and preventive trends to support the theory of sustainable development were created aimed to mimic natural ecosystems to consume and discard as little as possible and still obtain consumer goods (US-Environmental protection Agency (US-EPA), 2016).
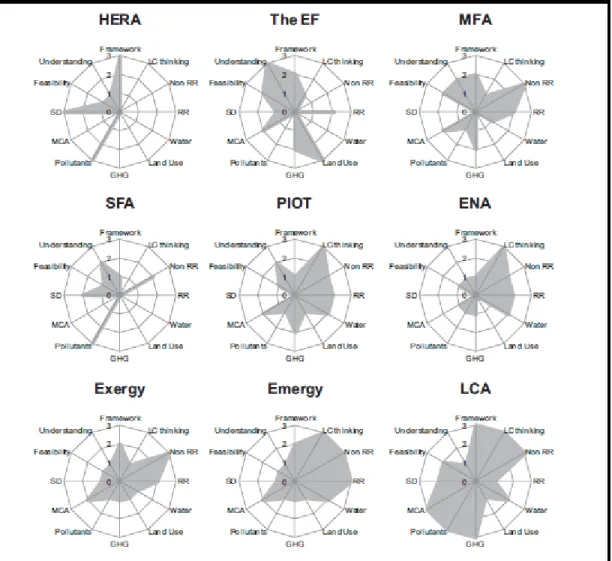
In 2012, Loiseau (Loiseau, Junqua, Roux, & Bellon-Maurel, 2012) developed a comparison of nine different methods of environmental assessment of territories (Figure 1-3), establishing the strengths and weakness or limitations of some of them concluding that there is presently no consensual and widely adopted method although it is recommended for example, by European directives.
Figure 1-3 Comparison of environmental assessment tools. From Loiseua, 2013. Human and environmental risk assessment (HERA); The ecological footprint
(EF); Material and energy flow analysis (MFA); Substance flow analysis (SFA); Physical input- output table (PIOT); Ecological network analysis
(ENA); Exergy; Emergy; Life cycle assessment (LCA)
Among others, exergy analysis and emergy synthesis are part of the energy family methods applied in the environmental assessment of territories and natural or anthropogenic systems. Compared to material and energy flow analysis applies (tools based on the first law of
11
thermodynamics), exergy analysis applies the principles of the second law of thermodynamics.
According to (Gasparatos & Scolobig, 2012), after 25 years of debate there is no shortage of sustainability assessment tools. He claims that sustainability assessment tools can be divided into three broad categories: monetary, biophysical and indicator-based. Exergy, emergy, ecological footprint material and energy flow analysis are part of the biophysical category.
Hence, these conventional methodologies are applied in the assessment of industrial environmental impacts. Governmental institutions were created, with the goal to apply the law enforcement, some examples are: Environment Canada (EC), the Environmental Protection Agency of the United States (US-EPA) or the European Environmental Agency (EEA), among others. They have been evolving according to the challenges faced throughout time. Due their global effects and time persistence, industrial atmospheric pollutants represent a major concern of global warming, particularly the emissions of CO2. Kyoto’s
protocol, established the commitment of countries to reduce greenhouse gases emissions. GHG’s are relevant because the most of it has fossil fuels as the main source since the Industrial Revolution; the switch to renewable sources is changing panorama, but it is a mid-term solution (Loiseau et al., 2012). Figure 1-4 describes the growing trend curves of CO2
Figure 1-4 CO2 emissions (Mt) by geographic. From IEA, 2017
1.2.1 Principles of air pollution emissions assessment; greenhouse gases (GHG) and
Carbon dioxide (CO2)
The relationship between energy consumption and economic growth has received a great deal of attention in the recent past. This is principally because of the enormous implications that this relationship has for policy prescriptions relative to energy conservation. Moreover, environmental concerns require more attention around the globe with a lot of calls to reduce green-house gases (GHG) emissions which are seen as a major source of global warming (Appiah, 2018).
Climate change (CC) has become a topical issue across the world. Scientist places it at the top of the list of problems that humans need to deal with in current times and future times. There is also a consensus that human (anthropogenic) activities are causing recent global warming (Intergovernmental Panel on Climate Change (IPCC) UNEP, 2016). Climate change is also a disaster that human beings must cope with for decades. Excessive amounts of GHG’s (water, vapors, carbon dioxide, methane, nitrous dioxide and chlorofluorocarbons) in the atmosphere are the main reason for global climate change (Özokcu & Özdemir, 2017).
13
According to the US-EPA (US-Environmental protection Agency (US-EPA), 2016), greenhouse gas can be defined as any gas that absorbs infrared radiation in the atmosphere . The increase of greenhouse gases emissions is a major threat to the environment of the world. The rapid economic growth and expansion of the process of industrialization of developing countries impel intensive use of energy and other natural resources as a result more residues and wastes are being released in nature that could lead to environmental degradation (Sharif Hossain, 2011).
The consumption of energy is a standard to gauge the pace of economic progress and the promotion of industrialization in developed and developing countries. But the rising demand for non-renewable energy sources in developing countries is causing negative impacts on the environment (Hanif, 2017b).
Despite efforts to improve energy efficiency, today the industrial sector remains as one of the main consumers of energy fuels with an average of 37 % overall, with a range of consumption varying from 30% to 70% locally (Dincer & Rosen, 2012). Figure 1-5 shows the world CO2 emissions from fuel combustion, from years 1971 to 2015 (International
Energy, 2017).
Therefore, the relationship between fossil fuels consumption to produce energy and to generate GHG’s, requires the mitigation of source through process energetic efficiency; however this is not always realistic because several factors restrict the transformation or improvement of systems for industrial power generation, such as costs associated with production, availability of technology, design of equipment, availability of space, etc. This is a challenge proposed to the scientific community, how to evaluate and decrease the negative effects of pollutants in the atmosphere, the soil, water-bodies and ecosystems? But most important to minimize impacts on human health (Kothari, Tyagi, & Pathak, 2010).
Since the initial efforts to combat environmental harm in the 70s, constant evolution of environmental laws, codes, standards, etc., have been taken place. The command-control method used strongly during the 70s as legal tool (end of the pipe approach, failed, however promotes the creation of good environmental practices for companies worldwide (M. E. Kraft, 2011; Portney, 2010). Below, the evolution of the environmental management tools is showed in Figure 1.-6.
15
Figure 1-6 The staircase of environmental management systems. Adapted from (Basu & van Zyl, 2006)
After decades of “command and control” environmental policy in the United States, environmental regulation and enforcement that has dictated how companies addressed environmental, health and safety issues, the amount of codes and regulations increased drastically (Richards, 1997).Consequently, the following stage of environmental tools grow up evolving in to comprehensive and management systems, from just recycling into life cycle assessment or mimic the natural ecosystems a is suggested by industrial ecology (Chertow, 2007).
1.3 Energy and exergy analysis
1.3.1 Theoretical background
On his historical review on exergy Sciubba & Wall (Enrico Sciubba & Wall, 2007), showed that exergy has been in constant evolution, with a maturity that occurred during the decade of
the 70s (corresponding with the oil shock in 1973); this keystone, opened the door to further areas of research, since the development of related application of exergy for various industrial applications i.e. steam power cycles (Fiaschi & Lombardi, 2002), energy conservation (Dincer, 2002), energy conversion cycles (Dincer & Rosen, 2004), efficient energy consumption (Kotas, 2013), etc.
Meanwhile, on the field of environmental sciences, some methodologies have been developed, for example those that links costs and thermodynamics known as the Exergy Cost (Jan Szargut, David R. Morris, & Frank R. Steward, 1987). The concept of Cumulative Exergy Content (Enrico Sciubba, Bastianoni, & Tiezzi, 2008) or the Exergoeconomics or Thermo-economics (Lozano & Valero, 1987). Combined with this concept were included other externalities (Göran Wall, 1977a), bringing into new methodologies such as Exergy Life-Cycle-Assessment (Cornelissen & Hirs, 2002), or the comprehensive exergy evaluation of social systems (Göran Wall, 1987).
Regarding exergy analysis, Rosen states that it provides a more realistic basis to the system’s performance, compared to energy analysis he establishes the following: “while energy analysis cannot always do that, even sometimes provides misleading information. Exergy analysis has been useful for design and performance evaluation of thermal systems during recent years.“ (Marc A Rosen, Dincer, & Kanoglu, 2008).
Although exergy and its direct connection with environmental problems does not result in a direct measurement of environmental impacts (E. Sciubba, Wall, G. , 2007). The exergy balance method allows to measure resource consumption (primary sources), to get new styles on the design of environmentally friendly industrial facilities or to redesign processes or applying reengineering tools to improve performance of old industrial plants, located mostly in developing countries. Though, regarding exergy and the environment, Rosen and Dincer have been studying this relation (Dincer & Rosen, 2004; Dincer & Rosen, 2013a; Ozcan & Dincer, 2013; Marc A. Rosen & Dincer, 2001). Their findings are focused on the influence of
17
exergy as a tool to increase energy efficiency and simultaneously decrease environmental harm.
Scholars have been studying exergy analysis on a large-scale base, such as a country, its society or their own economic sectors (A Al-Ghandoor, 2013; Apostolos, Alexios, Georgios, Panagiotis, & George, 2013; Bühler, Nguyen, & Elmegaard, 2016; Ertesvåg, 2001; Göran Wall, Sciubba, & Naso, 1994). Figure 1-7 depicts a societal sectors structure.
Figure 1-7 Graphical structure of society economic sectors; adapted from Utlu, 2007
Among others, recent areas of research regarding exergy, highlights those of exergy analysis in the industrial sector (Li & Tao, 2017; Wu, Wang, Pu, & Qi, 2016); on waste emissions (Mora & de Oliveira Jr, 2018; Wu et al., 2016); on processes equipment and devices (Ahmadi & Toghraie, 2016; Mehrpooya, Lazemzade, Sadaghiani, & Parishani, 2016); on renewable energy sources (Di Somma et al., 2017; Ezzat & Dincer, 2016).
1.3.2 Exergy of fuels
In 1997, Dincer (M. A. Rosen, 1992; M. A. Rosen & I. Dincer, 1997) evaluated the energy consumption of the industrial sector in Canada to increase its efficiency based on exergetic
analyses. They developed one of the first large-scale exergy analysis methods. Toward the construction of an exergy balance of a non-constant flow system (like mass or energy balances), a common scenario requires establishing a control volume as well as a reference environment; it is usually established through a temperature T0 = 25 °C and a P0 =1 atm. (M.
A. Rosen, 1992). The flow of exergy entering in a system can be best described as the sum of the totality of their exergies (physical, chemical, potential, kinetic and nuclear exergies) (Marc A. Rosen, 2013; Enrico Sciubba, 2001).
𝐸𝑥𝑒𝑟𝑔𝑦 = 𝐸𝑥𝑒𝑟𝑔𝑦 + 𝐸𝑥𝑒𝑟𝑔𝑦 + 𝐸𝑥𝑒𝑟𝑔𝑦 + 𝐸𝑥𝑒𝑟𝑔𝑦 + 𝐸𝑥𝑒𝑟𝑔𝑦 (1.1)
The chemical exergy is the maximum work that can be obtained by taking a substance having the parameters (To, Po, mjo) to the state determined by the dead state (To, Po, mjo).
The most common mass flows in industrial processes are hydrocarbon fuels at near-ambient conditions; then the terms ExergyPh, ExergyKn, ExergyPt, ExergyNu, in equation (1.1) are
approximately zero; as a result, the exergy of fuels reduces only to the chemical exergy (ExergyCh) component.
Researchers have been proposing a correlation factor or exergy factor (A. Al-Ghandoor, Phelan, Villalobos, & Jaber, 2010; Guevara, Sousa, & Domingos, 2016; M. A. Rosen, 1992; Utlu & Hepbasli, 2007b), defined as the ratio of chemical exergy to the higher heating value (HHVf). With the use of these exergy factors, conversions of energy data to exergy values of energy carriers are given by proportionality constant (Bühler et al., 2016; Guevara et al., 2016). In other words, due the complexity of the chemical composition of fuels, a simple approach was applied, since the higher heating value (HHVf) of fuels is close to their chemical exergy component. In this work, the average exergy grade functions for different energy carriers considered were taken from several sources (Ertesvåg, 2001; G. M. Reistad, 1975; M. A. Rosen, 1992; J. Szargut, D.R. Morris, & F.R. Steward, 1987; Utlu & Hepbasli, 2007a).
19
1.3.3 Energy and exergy efficiency evaluation methods
With the aim to assesses the control volume, previous research applied different methods to obtain thermodynamic efficiencies (Aljundi, 2009; Dincer & Rosen, 2012; E Sciubba, 1994; Tsatsaronis, 2007). Energy and exergy heating efficiencies derives from the first and second laws of thermodynamics, respectively. Electric and fossil fuel heating processes were chosen to generate products heat at a constant temperature, either from electrical energy or fuel mass.
Due the diversity and complexity characteristics of this sector, the assessment of the accurate conditions of each process (temperature, pressure, thermodynamic properties, etc.) becomes hard to handle. However, some criterions are necessary to solve this situation. A standard method applied by Utlu (Utlu & Hepbasli, 2007b), to compute the efficiencies of electrical and fuel heating, as well for the fossil-fuel heating efficiencies has been applied in several studies for the industrial sector. Briefly, to assesses industrial activities this method consists to consider standard reference operation categories. They are divided into three main categories of temperature heating (high-medium-low) in terms of heating processes temperatures.
1.4 The Environmental Kuznets Curve (EKC)
The idea of a causal relationship between energy consumption and economic growth was first introduced in the influential paper of Kraft (J. Kraft & Kraft, 1978b), once the causality relationship between them has important policy implications. A literature review on the EKC starts with the influential research from Grossman and Krueger (Gene M Grossman & Krueger, 1995) in their attempt to explore the path of sustainable development theory to describe the environmental degradation-economic growth relationship.
The debate about what becomes first, economics or environment, no matter at local or global level was settled and the functional relationships between economic growth and environmental degradation were masterfully expressed by the environmental Kuznets curve
(EKC), an inverted U-shape curve (David I. Stern, 2004). To face the problem of GHG’s as precursors of climate change is a great challenge. In the late 80’s, efforts from governmental and non-governmental organizations mainly in industrialized countries, were the first steps in the route of sustainable development (Robinson, 2004).
As part of this effort to tackle greenhouse gases, CO2 emissions are broadly used in the
industry as an indicator of the environmental performance of a company (Sariannidis, Zafeiriou, Giannarakis, & Arabatzis, 2013). To control the carbon emissions issues, governments have been taking actions to face this challenge (Turki, Sauvey, & Rezg, 2018).
One way of determining the effectiveness of environmental policies is through the Environmental Kuznets Curve (EKC). The EKC hypothesis suggests that environmental damage first increases with income (GDP per capita), then declines. In other words, GDP per capita (income) and pollution per capita have an inverted U-shaped relationship (Kaika & Zervas, 2013a; Olale, Ochuodho, Lantz, & El Armali, 2018).
The environmental Kuznets curve (EKC) was initially developed by (G. M. Grossman & Krueger). At its most basic level, the EKC hypothesizes an inverted U-shape in the relationship between per capita emissions (such as CO2) and per capita GDP (or per capita
income). Relative low levels of per capita GDP, per capita emissions increase with per capita GDP but eventually at a declining rate. After per capita emissions reach a maximum, they decline as per capita GDP continues to grow (Brown & McDonough, 2016).
Several years of economic growth without bearing in mind environmental harm, scholars, practitioners and policy makers, mostly representing developed countries, perceiving the risk related with industrialization and deforestation processes, among other anthropogenic activities and react; hence, a heated debate between the importance of economy without compromising our natural resources started (Vlontzos, Niavis, & Pardalos, 2017).This dilemma about economic activity and pollution opened up grounds for a rich research agenda (Moutinho, Varum, & Madaleno, 2017).
21
Subsequently, researchers have been developed empirical studies of the EKC in single or multiple countries or geographical regions, applying different methodologies (Alam, Murad, Noman, & Ozturk, 2016; Ben Jebli, Ben Youssef, & Ozturk, 2016; Dinda, 2004; Panayotou, 2001).
Other researches have focused their attention on different environmental dimensions (i.e., CO2, SO2, NOx, particulate matter, wastewater, protected areas) or time contexts. Mixed and
even inconclusive findings are still reported (Rahman & Kashem, 2017). Scholars found that the relationship presented multiple shaped EKC such as U, inverted-U, N, etc. Additionally, there were also evidences that the testing results depended on the specific econometric models (Chowdhury & Moran, 2012). Some authors have been reviewing the vast literature of the EKC, offering an overview of the relevant past empirical studies, highlighting among others, the work of (Bo, 2011; Özokcu & Özdemir, 2017; Ozturk, 2010; David I. Stern, 2017).
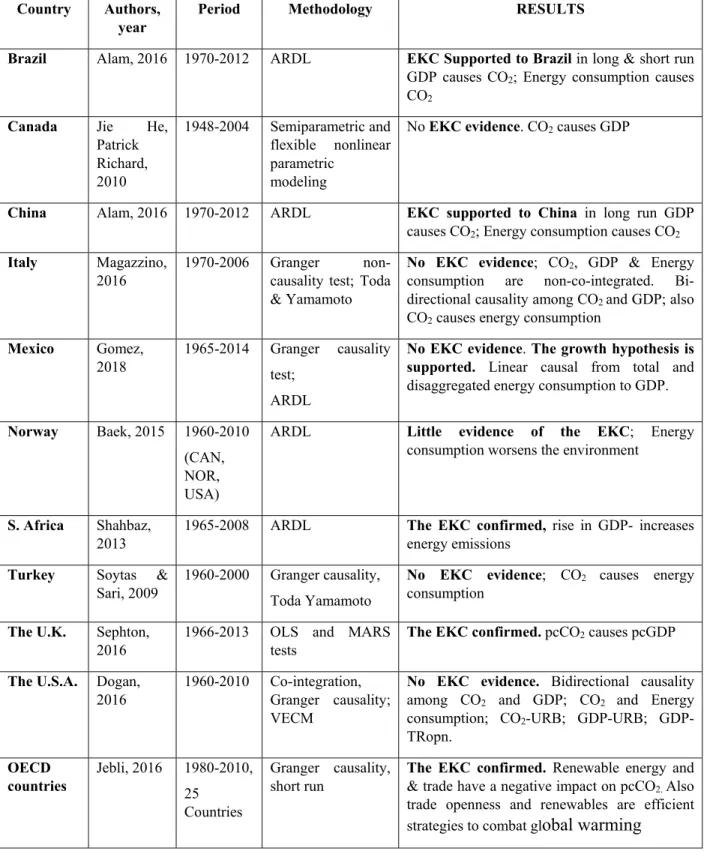
Below, Table 1-1 show a brief literature review summary from some countries in search of the environmental Kuznets curve, mainly focused on the set of ten countries analyzed in this research. Table 2-1 shows the methods or tests used to determine the causality between the variables studied as well as the existence or not of the Kuznets curve. Also describes the main results, methods applied by author, year and country, taking as a sample the proposed ten countries chosen for the Global geographic scale. The criteria were to select the more relevant works in terms of newest, time frame and similar methods as those applied in our research work.
Table 1-1 Brief summary of the environmental Kuznets curve literature review
Country Authors,
year
Period Methodology RESULTS
Brazil Alam, 2016 1970-2012 ARDL EKC Supported to Brazil in long & short run
GDP causes CO2; Energy consumption causes CO2
Canada Jie He,
Patrick Richard, 2010 1948-2004 Semiparametric and flexible nonlinear parametric modeling
No EKC evidence. CO2 causes GDP
China Alam, 2016 1970-2012 ARDL EKC supported to China in long run GDP
causes CO2; Energy consumption causes CO2
Italy Magazzino,
2016
1970-2006 Granger non-causality test; Toda & Yamamoto
No EKC evidence; CO2, GDP & Energy consumption are non-co-integrated. Bi-directional causality among CO2 and GDP; also CO2 causes energy consumption
Mexico Gomez,
2018
1965-2014 Granger causality test;
ARDL
No EKC evidence. The growth hypothesis is supported. Linear causal from total and
disaggregated energy consumption to GDP.
Norway Baek, 2015 1960-2010
(CAN, NOR, USA)
ARDL Little evidence of the EKC; Energy
consumption worsens the environment
S. Africa Shahbaz, 2013
1965-2008 ARDL The EKC confirmed, rise in GDP- increases
energy emissions
Turkey Soytas & Sari, 2009
1960-2000 Granger causality, Toda Yamamoto
No EKC evidence; CO2 causes energy consumption
The U.K. Sephton, 2016
1966-2013 OLS and MARS tests
The EKC confirmed. pcCO2 causes pcGDP
The U.S.A. Dogan,
2016
1960-2010 Co-integration, Granger causality; VECM
No EKC evidence. Bidirectional causality
among CO2 and GDP; CO2 and Energy consumption; CO2-URB; URB; GDP-TRopn. OECD countries Jebli, 2016 1980-2010, 25 Countries Granger causality, short run
The EKC confirmed. Renewable energy and
& trade have a negative impact on pcCO2. Also trade openness and renewables are efficient strategies to combat global warming
CHAPTER 2
PRESENTATION OF THE RESEARCH PROJECT
2.1 Work approach: Exergy analysis for environmental policies and regulations
As environmental tool, exergy analysis methodology is a systemic and multidisciplinary approach, allowing the study of sustainability axes (economic, social and environmental topics). Also, exergy analysis is applied to detect the inefficiencies of processes by locating the degradation of energy, i.e., heat lost, etc. Scholars claim that exergy brings opportunities in decision-making to increase energy efficiency and energy conservation, e.g. (Utlu & Hepbasli, 2009).
The evolution of exergy analysis starts with the theoretical developments of Reistad, growing as a concept to resource accounting, energy conservations, efficiency improvements in industrial equipment or power cycles and its components, then including environmental applications, complex systems analysis, sectors and extended exergy analysis in societies or countries, mainly including conversion, transportation, residential and agricultural sectors. Regarding the industry, exergy analysis has been developed in three main categories: sectorial analysis, by type of industrial process; by industrial equipment.
The available evidence (Marc A Rosen, 2013) propose that compared to energy efficiencies (first law of thermodynamics), exergy efficiencies (second law of thermodynamics) offer larger areas for improvement from an exergy perspective, compared to the overly optimistic margin indicated by energy. Even even those on a large scale such as the economic sectors of a country or an entire society. Gong (Gong & Wall, 2016) established that to improve energy and material conversion processes, the exergy concept should be applied. Thus, exergy and exergy analysis are helping tools to create and preserve a sustainable or rather a vital society.
2.2 Problem statement
How can we return to pre-industrial levels of CO2 emissions?
It is known that CO2 occurs naturally in Earth's atmosphere, presented as a trace gas.
However, there is evidence that the rate of release of carbon dioxide (CO2) in the atmosphere
may be greater than the earth's ability to assimilate it (Baldocchi & Penuelas). Anthropogenic emissions of CO2 – primarily from use of fossil fuels and deforestation – have rapidly
increased its concentration in the atmosphere. Since the Industrial Revolution, levels have almost doubled. Today are higher than at any point in at least the past 800,000 years, the concentrations reach 410 ppm, near 70% higher from pre-industrial levels of 280 ppm. The amount of carbon dioxide in the atmosphere is increasing as increased amounts of fossil fuels are burned. In 2016, Carbon dioxide emissions accounted for approximately 72% of global greenhouse gas (GHG) emissions (Jos GJ Olivier et al., 2017).
As an example, in the United States (a key player to combat climate change, highly industrialized, one the 5th most populated countries globally), the CO2 releases to the
atmosphere increased by approximately 7% between 1990 and 2013. By 2016, 22% of the total GHG emissions came from the industrial sector in the USA. This one of the reasons for which this work is focused on the CO2 emissions from the industrial sector (International
Energy, 2017).
However, despite the greater focus on CO2 emissions and the efforts to reduce environmental
damage, fossil fuels (i.e. oil, coal, fuel-oil and natural gas) still dominate overall energy consumption. Fossil fuels had an 81% share in the last 25 years. That relationship did not change between 1989 and 2014, although the use of oil fuel decreased, from 37% to 31%. During that same period, the use of natural gas increased from 19% to 21%, but most importantly the use of coal, the most pollutant of the group (due its long chains of hydrocarbons) increased from 25% to 28%, mostly in developing economies like China and India.
25
Industrial activities mean benefits for human development as employment, and economic development; paradoxically waste and pollutants are generated as a by-product or wastes in the form of air, solid or liquid pollutants (Portney, 2010). These problems are related to deficient planning, lack of proper environmental policies and regulations, or lack of law enforcement. The current rates of worldwide economic development show that increased energy demand at all sectoral levels may represent a threat to the achievement of global reduction objectives for 2050 (Intergovernmental Panel on Climate Change (IPCC) UNEP, 2016). The industrial sector plays a key role in terms of energy use and air emissions, particularly the high-intensity energy consumption by sub-sectors. Is it possible to use fossil fuels in a more sustainable way?
2.3 Working hypothesis
In order to analyze the correlations among CO2 drivers to promote policy instruments, this
research was split in three different geographical levels including a general set of countries, a subset and a single sample of countries.
Correlations between exergy, environmental impact and sustainability
The thesis explores the potential relationship between some industrial environmental indicators by means of the existence of the EKC; several variables are proposed, such as energy consumption, energy efficiency, with the intensity of resource utilization; the main hypothesis to test will be the existence of the EKC in the geographic levels (global, regional, local);however the statistical methods, sample of countries, time-frame set, will affect the results.
At global level, it is not expected to find the EKC; at regional level, it is expected to detect the EKC; and finally, at local level it is expected also to find the EKC.
Above all, it is expected that energy consumption would affect carbon dioxide (CO2)
Additionally, at regional level, it is expected that exergetic variables, exergy intensity and exergetic renewable share, the higher the rates of exergetic renewable share, the lower the rates of CO2 emissions. At local level (study case), the higher the exergy efficiencies, the
lower the CO2 emissions. To summarize, we expect correlations among exergy and
environment variables.
Additionally, exergy-based indicators are proposed like exergy efficiency, exergy intensity (in both cases, higher values indicating higher resource utilization levels) and exergetic renewable share. Regarding the compute of exergy indicators, the hypothesis in this dissertation is based on the approach that, once exergy efficiency tends to increase, environmental impacts, particularly air emissions, conversely decrease, and thereafter sustainability will increase; this exergetic postulate is in accordance with Dincer (Dincer, 2002)
2.4 Objectives
Accordingly, this work explores the applicability of the exergy analysis method at large scale, specifically to widely used parameters on both, industrial sector energy as well as exergy performance. These parameters on the industrial sector include efficiency, fuel consumption, CO2 emissions; while on the exergy performance side they include other
variables related to the industrial sector and sub-sectors, like exergy consumption, exergetic renewable share, exergetic intensity. Following the traditional structure of the thesis by chapters, the research work was conducted applying a geographical level approach. We considered analysis of several countries industrial sector at global, regional and local geographic levels. A study case was proposed at local level. Thus, the following specific objectives were proposed.
Particular Objective 1
Evaluate the main drivers of CO2 emissions with the assessment of corelationship between
27
level in a set of ten countries. Additionally, propose to test the influence of an exergy variable as a determinant factor for the environmental Kuznets curve (EKC) of the selected countries (global-geographical level). At this first stage of this research the EKC will be only explored.
Particular Objective 2
Introduce and compare the suitability of exergetic variables: exergy intensity and exergetic renewable share, among others (trade openness, GDP and energy consumption) to detect the main drivers of CO2. Also, the existence of the environmental Kuznets curve (EKC)
hypothesis was studied among the North America free trade agreement (NAFTA) commercial partners: Canada, Mexico and the U.S.A. (regional-geographical level). In this second stage of this research the EKC will be applied.
Particular Objective 3
Detect the areas within the industrial sector able to improve performance and minimize impacts by exploring the energy and exergy consumption rates as well as the changes of the efficiency of energy and exergy utilization of industrial activities. Study case of the Mexican industrial sector (local-geographical level). In this third stage of this research the EKC will be applied.
2.5 Methodological framework
An approach of geographic and temporal scales was applied in this work, in three basic stages in order to fulfill the proposed objective.
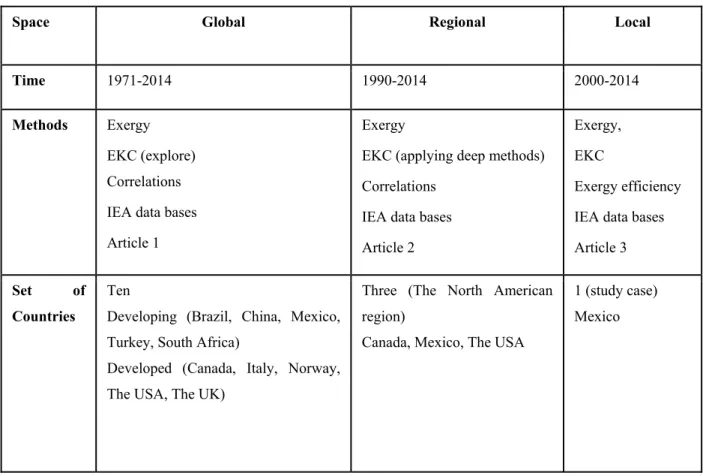
Table 2-1Methodological approach
Space Global Regional Local
Time 1971-2014 1990-2014 2000-2014
Methods Exergy
EKC (explore) Correlations IEA data bases Article 1
Exergy
EKC (applying deep methods) Correlations
IEA data bases Article 2
Exergy, EKC
Exergy efficiency IEA data bases Article 3
Set of
Countries
Ten
Developing (Brazil, China, Mexico, Turkey, South Africa)
Developed (Canada, Italy, Norway, The USA, The UK)
Three (The North American region)
Canada, Mexico, The USA
1 (study case) Mexico
Table 2-1 above shows the characteristics used in each of the three stages referred to hereafter as Global, Regional and Local geographic levels. In general terms we can indicate that the common factor among the three stages is the exergetic analysis, detect correlations among the proposed variables, the test to detect the existence of the EKC and the generic database created for ten countries from the data published by the IEA on its website, between 1970 and 2014.
But, a difference among each of the three levels was that at first glance the EKC was only explored in the study of the set of ten countries; with the acquired experience, the next level was to apply in a deeper way econometric methods to test the EKC in a sub-set of three countries at regional level. And finally, at local level, instead to go deeper to study a single to detect the EKC, the research was focused to compute exergy efficiencies.