HAL Id: hal-01447454
https://hal.archives-ouvertes.fr/hal-01447454
Submitted on 13 Nov 2019
HAL is a multi-disciplinary open access
archive for the deposit and dissemination of
sci-entific research documents, whether they are
pub-lished or not. The documents may come from
teaching and research institutions in France or
abroad, or from public or private research centers.
L’archive ouverte pluridisciplinaire HAL, est
destinée au dépôt et à la diffusion de documents
scientifiques de niveau recherche, publiés ou non,
émanant des établissements d’enseignement et de
recherche français ou étrangers, des laboratoires
publics ou privés.
Attribute profiles on derived features for urban land
cover classification
Bharath Bhushan Damodaran, Joachim Höhle, Sébastien Lefèvre
To cite this version:
Bharath Bhushan Damodaran, Joachim Höhle, Sébastien Lefèvre. Attribute profiles on derived
fea-tures for urban land cover classification. Photogrammetric engineering and remote sensing, Asprs
American Society for Photogrammetry and, 2017, 83 (3), pp.183-193. �10.14358/PERS.83.3.183�.
�hal-01447454�
Delivered by Ingenta to: American Society for Photogrammetry and Remote Sensing Member Access
IP: 77.68.251.11 On: Wed, 08 Mar 2017 18:32:14
Copyright: American Society for Photogrammetry and Remote Sensing
Attribute Profiles on Derived Features for
Urban Land Cover Classification
Bharath Bhushan Damodaran, Joachim Höhle, and Sébastien Lefèvre
Abstract
This research deals with the automatic generation of 2D land cover maps of urban areas using very high resolution multi-spectral aerial imagery. The appropriate selection of classifier and attributes is important to achieve high thematic accura-cies. In this paper, new attributes are generated to increase the discriminative power of auxiliary information provided by re-mote sensing images. The generated attributes are derived from the vegetation index and elevation information using morpho-logical attribute profiles. The extended experimental evaluation and comparison of attribute profile-based mapping solutions is conducted to derive the optimal combinations of attributes required for classification and to understand the genericity of attributes on a range of classifiers, i.e., various combinations of attributes and classifiers. Experimental results with two high resolution images show that the proposed attributes derived on auxiliary information outperform the existing attribute profiles computed on original image and its principal components.
Introduction
Nowadays, due to the advances in the sensor technology, it is possible to acquire very high-resolution satellite or airborne multispectral imagery to generate accurate urban land cover maps. However, analyzing very high-resolution imagery is complex, mainly due to the diversity in the size and shape of objects, high spectral and spatial variations, and objects composed of similar type of materials (Foody, 2000). Urban areas are of special interest because they change all the time and the maps should be updated in short intervals (Cao et al., 2015). Also, small objects like walls, hedges, and trees should be detected. Machine learning techniques or supervised clas-sifiers are used to translate images into useful information in form of a thematic map. The thematic accuracy of land cover maps depends very much on the type of landscape, the input data, the class attributes, and on the type of the classification method used (Damodaran and Nidamanuri, 2014a; Thomas et
al., 2003). The type of class attributes has a significant impact
on the performance of the underlying classifier. Therefore, derivation and appropriate use of both simple and advanced attributes are of prime importance for generating accurate 2D thematic maps from very high-resolution imagery.
The image classification is generally carried out using the spectral characteristics of remotely sensed images. However, this information alone is not sufficient to obtain accurate thematic maps. On the other hand, it is essential to derive the spatial contextual attributes to incorporate the neighboring re-lation among the pixels (Blaschke, 2010; Salehi et al., 2012b; Damodaran et al., 2015). Several spatial-based attributes such as texture and geometrical attributes are derived to account for the neighborhood information in high-resolution imagery. The
combination of these attributes has significantly increased the classification accuracy. The commonly used texture attribute is described by means of gray-level co-occurrence matrix, mean, standard deviation, entropy, and contrast (Trias-Sanz et
al., 2008). The geometrical attributes are derived based on the
contours (boundaries) and regions in the image. The common-ly used attributes are convexity, perimeter, compactness, and area (De Martinao et al., 2003; Du et al., 2015; Inglada, 2007). Recently, operators based on multi-scale modeling by math-ematical morphology (MM) have been employed to extract the
geometrical informative attributes from high-resolution urban imagery (Dalla Mura et al., 2010; Du et al., 2015). The attri-bute profiles (AP) are built from morphological operators that
provide multi-level or multi-scale geometrical characteriza-tion of very high-resolucharacteriza-tion imagery (Dalla Mura et al., 2010; Aptoula et al., 2016). These attribute profiles are a powerful model to increase the discrimination between the land cover classes. The concept of the APs with all its modifications and generalizations is explained in Ghamisi et al. (2015). Several other studies were carried out to demonstrate the potential of attribute profiles with multi- or hyperspectral imagery using single classification methods (Benediktsson et al., 2005; Fau-vel et al., 2008; Pedergnana et al., 2010; Ghamisi et al., 2014).
Apart from the intensities of the original images or ortho-images, auxiliary information such as the normalized differ-ence vegetation index (NDVI), the digital surface model (DSM)
or the normalized digital surface model (nDSM) are considered
as important (widely used) attributes for remote sensing image classification (Elshehaby and Taha, 2009; Salehi et al., 2012a; Höhle and Höhle, 2013). Several studies in literature high-lighted the importance of DSM and NDVI attributes to provide
discriminative information to distinguish between the classes in very high-resolution imagery (Salehi et al., 2012a; Sampath and Shan, 2007). The height above ground (nDSM) derived
from filtering the DSM was considered as even more important
in high-resolution urban imagery (Höhle, 2013). However, the performance improvement of the thematic map using only the above information might be limited, and sometimes it might not be as effective as expected. Recently, Tokarczyk et
al. (2015) showed that the NDVI attribute was not a useful
at-tribute for the classification of high resolution urban imagery, since it does not provide any additional information. Thus, it is essential and necessary to provide an alternative way to utilize the NDVI attribute for high resolution urban image
clas-sification, which could benefit many urban mapping applica-tions. In this paper, we propose a methodological framework to utilize the NDVI attribute for high-resolution urban image
classification by incorporating the multi-level spatial con-textual information from the NDVI attribute. The multi-level
characterization of the NDVI attribute is generated by means of
Bharath Bhushan Damodaran & Sébastien Lefèvre are with Univer-sité de Bretagne-Sud, UMR 6074, IRISA, Vannes 56000, France. Joachim Höhle is with Aalborg University, Department of planning, Skibbrogade 3, DK 9000 Aalborg, Denmark ([email protected])
Photogrammetric Engineering & Remote Sensing Vol. 83, No. 3, March 2017, pp. 183–193. 0099-1112/17/183–193 © 2017 American Society for Photogrammetry and Remote Sensing doi: 10.14358/PERS.83.3.183
Delivered by Ingenta to: American Society for Photogrammetry and Remote Sensing Member Access
IP: 77.68.251.11 On: Wed, 08 Mar 2017 18:32:14
Copyright: American Society for Photogrammetry and Remote Sensing
morphological attribute profiles. So far, as per our knowledge,studies on generating attribute profiles on the NDVI have not been reported. Similarly, the incorporation of the spatial con-textual information from the DSM or nDSM might be required to achieve the expected improvement in the classification accuracy (Merciol and Lefèvre, 2015). Recently, the attribute profiles were generated from the DSM derived by lidar data (Pedergnana et al., 2012; Ghamisi et al., 2014; Khodadadzadeh
et al., 2015; Liao et al., 2016), and they have shown the ability
of attribute profiles to improve the classification accuracy. However, only limited studies exist on assessing the perfor-mance of the attribute profiles derived from the DSM or nDSM, and there is a need for conducting experiments to validate the conclusions derived from these previous studies. Therefore, the first contribution of this paper is the generation of a multi-scale representation of the NDVI and DSM (nDSM) attributes.
Furthermore, the simple attributes (image intensities of several bands, NDVI, DSM or nDSM) could bring complimen-tary information when compared with the spatial attributes derived by the attribute filters from NDVI, DSM, and nDSM. Thus, integrating the spectral (simple) and spatial attributes is essential for generating accurate land cover maps (Zhang
et al., 2012). Therefore, the second objective of this study is
to conduct extensive experiments on different combinations of various attributes to assess the impact of different attribute combinations and to identify the best combination of attri-butes for generating land cover maps of highest accuracy. Finally, the type of classifier employed to generate land cover maps has a significant impact on the thematic accuracy of the maps (Damodaran and Nidamanuri, 2014b; Thomas et
al., 2003). It is established that there is no single best classifier
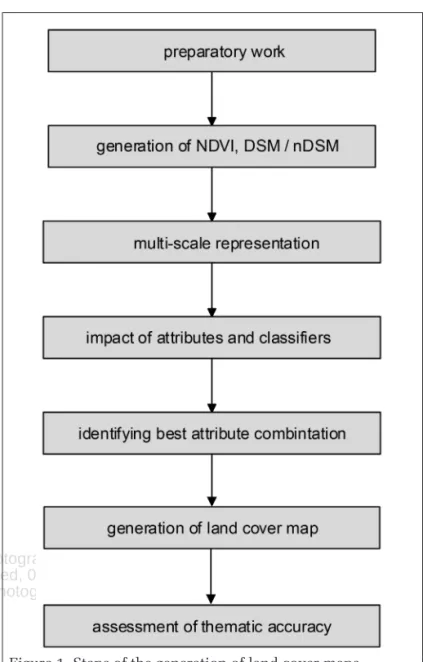
available that could offer optimal performance across differ-ent types of attributes and landscapes. Since these classifiers differ in the principles they rely on, it is necessary to have a practical knowledge on the choice of the classifier and attri-butes to generate classification maps of high thematic accuracy. Recently, the PerTurbo classifier has been proposed to the remote sensing community for hyperspectral image classifica-tion (Chapel et al., 2014). This classifier has shown better or comparative performance than support vector machines (SVM). Both the SVM and PerTurbo are non-linear classifiers implicitly mapping the data into the reproducing kernel Hilbert space (RKHS). While SVM is a discriminative classifier, PerTurbo is a generative classifier. Such an important classifier has not been extensively studied. Thus, the third objective of this paper is to assess the genericity of the proposed attributes over a wide range of state-of-the-art classification methods and to validate the performance of the PerTurbo classifier extensively. Figure 1 shows the flowchart of generation of land cover maps. The preparatory work comprises the selection and the derivation of data, which characterize the classes of the land cover map to be produced. The attribute generation consists in deriving auxilia-ry information such as NDVI, DSM (nDSM) from the images and in generating multi-scale representations of this information. The training of the applied classifier requires some reference data. The classification of all map units (pixels or DSM cells) can then be achieved. The assessment of the map’s thematic accuracy is a necessary step of the generation of land cover maps. Also, cartographic enhancement may be part of the whole process.
The contributions of this paper can be summarized as fol-lows: (a) generation of multi-scale representation of the NDVI,
DSM, and nDSM attributes, (b) integration of simple and spatial attributes for urban cover classification and identification of the optimal combination of attributes for accurate classification, and (c) comparative analysis of the state-of-the-art machine learning classifiers, and validation of the PerTurbo classifier.
The paper is structured as follows. The next Section deals with the class attributes and machine learning methods used
for generation of land cover maps, followed by a description of the experimental setup and the approaches used in the as-sessment. The next Section presents the results and discus-sion with aerial imagery of two test sites, followed by our conclusions.
Materials and Methods
In this section, we provide the background of the multi-scale representation of the NDVI, DSM, and nDSM using attribute
profiles and state-of-the-art machine learning classifiers used in this study.
Multi-Scale Representation Using Attribute Profiles
Mathematical morphology is widely used to model the spatial characteristics of the classes (objects) in high resolution aerial and satellite images. The predefined structuring element (SE)
is used to generate morphological profiles by applying closing and opening operations. The objects that are smaller than the
SE are removed during these operations, and filtering artifacts
are avoided using morphological operators by reconstruction. Recently, morphological attribute profiles were used to gener-ate multi-level characterization of the classes by sequential application of morphological attribute filters to model the dif-ferent kinds of structural information (Dalla Mura et al., 2010; Ghamisi et al., 2015). Various filtering criteria have been introduced (e.g., area, standard deviation, moment of inertia,
Delivered by Ingenta to: American Society for Photogrammetry and Remote Sensing Member Access
IP: 77.68.251.11 On: Wed, 08 Mar 2017 18:32:14
Copyright: American Society for Photogrammetry and Remote Sensing
and diagonal bounding box) and they are called attributesin the afore-mentioned papers and the general literature on mathematical morphology and attribute profiles. However, we will refer in this paper to the usual terminology of machine learning and remote sensing when using the term attribute. Two kinds of attribute filters are available: thinning when an object not matching the criterion is merged to a simi-lar nearby object of lower gray level, and thickening if it is merged to one of higher gray level. The other objects are kept unchanged. A wide range of thresholds can be used when as-sessing the criterion, thus leading to a series of values called the attribute profile. More details about the attribute profiles are given in (Dalla Mura et al., 2010; Ghamisi et al., 2015).
In this study, we apply the attribute profiles on the NDVI,
DSM/nDSM to generate the multi-scale or multi-level tation of these attributes. The generated multi-scale represen-tation of NDVI, DSM/nDSM incorporates the spatial contextual information and increases the discrimination between the land cover classes compared to the simple NDVI, DSM/nDSM at-tributes. The attribute profiles are generated using four criteria among the most popular ones (area, diagonal bounding box, standard deviation, moment of inertia). We generated a total of 96 features (including all the criteria), among which, 48 features are from thinning operations and 48 are from thick-ening operations. The attribute profiles are computed using the Matlab codes developed by Dalla Mura et al. (2010).
State-of-the-Art Machine Learning Methods in the Generation of Land
Cover Maps
In this subsection, we review the state-of-the-art machine learning methods used in this study. Several methods are used in this paper to assess the genericity of the attributes over a wide range of classifiers, and the choice of these clas-sifiers are motivated by the demonstrated performance in remote sensing image classification.
Decision Tree
There are two steps involved in the decision tree (DT) classifi-cation: the generation of the decision tree and the assignment of a class to each map unit. The derivation of the decision tree is carried out by means of training data. They are usually ob-tained from maps or orthoimages by digitizing polygons rep-resenting a class and extracting their position and some other attributes. Thresholds for the attributes are then automatically derived which split the training data into two parts. This test-ing occurs several times until all traintest-ing units are separated into the selected classes. The derived structure is named ‘decision tree.’ The classes can be distinguished by means of attributes that characterize the selected classes. By means of the derived DT, the class of each map unit can be predicted and a land cover map can be generated. The theoretical back-ground of the DT method is given in previous publications, e.g., Breiman et al. (1984). Experiences with DT classification are published notably in Friedl and Brodley (1997), Thomas
et al. (2003), and Höhle (2015).
Random Forest
Random forest (RF) is an ensemble classifier, which uses the decision trees to construct the base classifiers in the ensemble learning framework (Breiman, 2001; Pal, 2005). Each of the decision trees is trained on bootstrap samples of the origi-nal training data. During the training phase, the RF uses the randomly selected subset of attributes to determine the split of the nodes. The number of attributes or variables used to split is calculated from the square root of the original number of attributes. The number of decision trees to be grown is a user-defined parameter. The predictions of all the outcomes of the decision trees are combined by means of a majority voting procedure.
Multinomial Logistic Regression
Multinomial Logistic Regression (MLR) generalizes the logis-tic regression to predict multiple classes. The weights are derived for each class and attributes are linearly combined. The weights are obtained by maximizing the log-likelihood function. The detailed description of the MLR can be found in Bohning (1992), and Pal (2012).
Support Vector Machines
The Support Vector Machine (SVM) is a binary classifier which finds an optimal hyperplane so that the samples between two classes are maximally separated. As a SVM is designed for the binary or two-class classification, we have used the ‘one ver-sus one’ approach for the multi-class classification problem (Hsu and Lin, 2002). The Gaussian radial basis function (RBF) is used as a kernel function in this study. The hyper-param-eters of the SVM classifier are bandwidth parameters and the cost function. They are automatically tuned using a fivefold cross-validation approach. The SVM is a widely-used classifier in the machine learning community due to its outstanding capability to handle the non-linearity in the data. The theo-retical background and experiences with the SVM are given in Melgani and Bruzzone (2004).
PerTurbo Classifier
PerTurbo is a discriminative classifier, in which each class is characterized in the manifold by the Laplace-Beltrami opera-tor (Chapel et al., 2014). The Laplace-Beltrami operaopera-tor is approximated using the Gaussian RBF kernel. The PerTurbo classifier contains two parameters to be optimized: the band-width parameter of the Gaussian RBF kernel and a regulariza-tion parameter for finding the inverse of Gaussian RBF kernel. These hyper-parameters are automatically tuned using a fivefold cross-validation approach. PerTurbo is a recently proposed classifier that has shown comparative or better per-formance than the SVM classifier. However, the performance of the PerTurbo classifier has not been studied extensively yet.
All classification experiments are performed through R programming using open source packages. The ‘rpart’ package is used for the DT classification, ‘e1071’ for the SVM classifier, ‘randomForest’ for the RF classifier, and ‘nnet’ for the MLR
classification. For the PerTurbo classifier, we used our own implementation.
Experimental Design and Assessment Approaches
In this section we will describe the design of our experiments and investigations regarding multiple attributes. The ap-proaches in the assessment of the thematic accuracy will also be dealt with.
Design of Experiments and Investigation of Multiple Attributes
The attributes should characterize the classes well and pro-vide discriminative information so that they can be separated from the other classes. The performance of the classifiers significantly depends on the type of the attributes used to characterize the underlying land cover classes. Therefore, the attributes must be selected with proper care. Thus, it is necessary to conduct investigations on the effectiveness of the attributes in advance and only such attributes should then be used to improve the accuracy of the classification. To achieve a strong improvement in classification accuracy, the fusion or combination of the simple and spatial information attributes is also essential. In this study, we investigate dif-ferent combinations (all possible combinations) of the simple and spatial contextual attributes. The sequence of steps to be followed when generating land cover maps is shown in Figure 1. The attributes considered in this study are: Orthoim-age (intensities of three or four bands), NDVI, DSM or nDSM; the
Delivered by Ingenta to: American Society for Photogrammetry and Remote Sensing Member Access
IP: 77.68.251.11 On: Wed, 08 Mar 2017 18:32:14
Copyright: American Society for Photogrammetry and Remote Sensing
spatial attributes considered are: multi-scale NDVI (NDVIAP),multi-scale DSM (DSMAP), or multi-scale nDSM (nDSMAP). The investigation on all the possible combinations employed are: (1) orthoimage, (2) NDVI, (3) DSM, (4) orthoimage+NDVI, (5) orthoimage+DSM, (6) orthoimage+NDVI+DSM, (7) NDVIAP, (8)
DSMAP, (9) orthoimage+NDVIAP, (10) orthoimage+DSMAP, (11) orthoimage+DSM+NDVIAP, and (12) orthoimage+NDVI+DSMAP. The above 12 different combinations are applied using all the mentioned classifiers. Furthermore, we also compared our best combination to the standard usage of attribute profiles in the literature, through five different configurations where at-tribute’s profiles are derived from either the original orthoim-age or its principal components.
Approaches in Accuracy Assessment
The assessment of the thematic accuracy of land cover maps requires accurate and reliable reference data. Such data can be a complete map or a set of samples. The approaches in the assessment should be based on statistical principles. This means that these data should be independent from the training data. The samples should be selected randomly and the sample size should be large enough to compute accuracy measures of small confidence intervals (Congalton and Green, 2008; Höhle and Höhle, 2013). Details on the quality assess-ment of extracted geo-spatial objects are published in Zhan et
al. (2005). When results of classifications are compared, it is
necessary to use the same assessment approach. The follow-ing characteristics should be known: the type of reference points (3D points taken from stereo pairs or 2D points taken from orthoimages) and the type of sampling (independence from training points, random extraction from the map or from reference data, number of points or sample size).
From the available ground truth (reference) samples, we randomly selected 500 samples per class for training, and the remaining samples are used for testing. To avoid the bias induced in random sampling, Monte-Carlo simulations are performed and the accuracy measures are averaged over several runs. The accuracy measures can be user’s accuracy, producer’s accuracy, overall accuracy, and kappa coefficient (Congalton and Green, 2008). Other measures are correctness, completeness, and F1-score (ISPRS WG III/4, 2014). The ac-curacy measures are derived from an error matrix (also known as a confusion matrix). The matrix can be written in different ways. For example, it can be normalized where the reference is written in the rows and the classification in the columns of the matrix. The calculation of the accuracy measures will dif-fer when normalization in row direction is not applied. In this investigation, we will write the reference values in columns and the classification values in the rows. Furthermore, we will not normalize the values (counts). The accuracy measure should be supplemented with a confidence interval (CI). The width of the CI informs on the reliability of the calculated ac-curacy measure.
Experimental Results and Discussion
In this study the practical tests are carried out with two types of aerial images covering two urban areas. The images were taken either by a large-format camera (Zeiss DMC) or a medium-format camera (Leica RCD30). Both cameras are met-ric cameras. The images consist of four bands (RGB and NIR)
and have a ground resolution (GSD) below 10 cm. The very
high resolution and overlapping images enable the deriva-tion of accurate and dense digital elevaderiva-tion models (DEMs) by means of software tools. In the following, we first describe the test sites, the applied procedures in the assessment, and then, the obtained results. The classification results are ana-lyzed in two ways. First, we deal with classification results obtained by combing different simple attributes. Second, we
derive classification results obtained by combining simple and multi-scale (spatial contextual) attributes; and finally we compare the derived classification results with some baseline approaches in literature.
Classification Results of the ISPRS Dataset
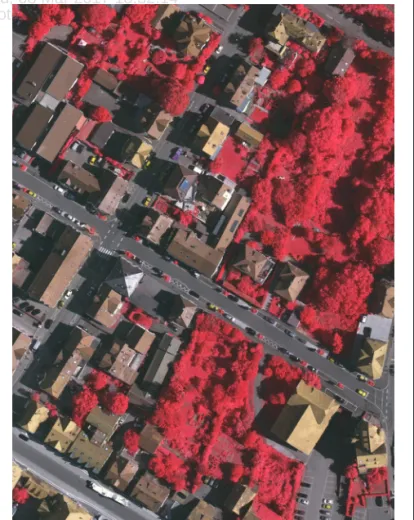
The first test site is a city area with many houses, roads, trees, bushes, and cars. The site is situated in Germany and covers 3.9 ha.
Description of Data
The data are part of the ISPRS “2D semantic labelling contest” which is currently available to compare various methods of classification for the extraction of multiple urban objects (ISPRS WG III/4, 2014). A digital surface model (DSM) and a false-color orthoimage (based on the DSM) were derived from aerial images by the organizers of the contest. The test mate-rial is of high-resolution (GSD = 9 cm) allowing the extraction of small objects, like trees, cars, etc. The data are in raster format; geocoding information was not provided. Figure 2 de-picts the orthoimage of the test site. The ground truth (refer-ence) samples for the entire area are provided along with the dataset. This reference map consists of five major urban land cover classes: impervious surfaces, building, low vegetation, tree, and car.
Assessment of Classification Results with Simple and Multi-Scale Attributes
Table 1 reports the classification accuracy of the ISPRS dataset with six different combinations of simple attributes and six combinations of multi-scale attributes (spatial contextual at-tributes) obtained by the DT, RF, MLR, SVM, and PerTurbo clas-sifiers. The reported overall accuracy and confidence interval are averaged over ten independent runs. First, we assess the performance of the simple attributes considered in the remote sensing image classification. More specifically we assess the
Delivered by Ingenta to: American Society for Photogrammetry and Remote Sensing Member Access
IP: 77.68.251.11 On: Wed, 08 Mar 2017 18:32:14
Copyright: American Society for Photogrammetry and Remote Sensing
performance of NDVI and DSM attributes, and then we showhow the limitations of NDVI attribute are addressed through
multi-scale characterization with attribute profiles.
Table 1 shows that NDVI attribute obtained worst
classifica-tion results with all the considered classifiers. Furthermore, its combination with the orthoimage and DSM attributes does
not lead to any classification improvement. It confirms the fact that the NDVI attribute does not provide any additional
infor-mation to distinguish between the used land cover classes, and this observation is also supported by the per-class accuracy measures (where all pixels are classified into the “low vegeta-tion” class). On the other hand, DSM attribute provided better
class discrimination than NDVI attribute, which is shown by
the increase in classification accuracy by about 2 to 8 percent when the DSM is combined with the orthoimage. The
classifi-cation accuracy measures with all the attribute combinations reveal that the combination of the orthoimage (intensities of the NIR-, R-, G-bands) and the DSM attribute is the best attribute
combination to generate land cover maps with this dataset. The comparative analysis (see Table 1a and 1b) shows that the incorporation of spatial information (attribute profiles) along with the simple information has increased the classi-fication accuracy significantly. It can be observed from both tables that multi-scale representation or multi-level character-ization of NDVI attributes has improved the SVM classification
accuracy by 53 percent when compared to the simple NDVI
attribute. Averaging the results of all five classifiers the gain is 46 percent. This shows that the multi-scale characterization of the NDVI attribute provides additional class discriminating
information, and hence it is an important attribute to generate accurate land cover maps. When the multi-scale representa-tion of DSM attribute is incorporated along with the original DSM attribute the magnitude of increase in accuracy is not
as high as the NDVI multi-scale characterization, but
how-ever, it remains significant. The average improvement with five classifiers is about 4.4 percent. Thus, for both derived features, the multi-scale characterization by attribute pro-files provides additional class discriminative information. Furthermore, in Table 1a, the DSM attribute outperformed the NDVI attribute, but when the spatial contextual information is
included the multi-scale characterization of the NDVI attribute
outperformed the multi-scale characterization of the DSM
at-tribute. When the orthoimage is combined with multi-scale representations of NDVI and DSM, the classification accuracy is
further significantly increased This shows that original pixel intensities bring some additional complementary information, thus we decided to combine all the available simple attributes to benefit from such complementary information along with multi-scale NDVI and DSM attributes. This combination
im-proved the classification accuracy significantly and resulted in the best set of attributes (orthoimage+NDVI+DSM+NDVIAP)
to obtain accurate classification maps for the ISPRS dataset.
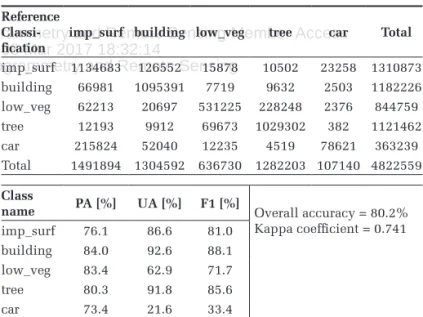
Table 2 reports the confusion matrix, producer’s accuracy, user’s accuracy, and F1 score of the best attribute combination (orthoimage+DSM+NDVIAP) and the best classifier (SVM) for the ISPRS dataset. The reported measures are from one run of the
Monte-Carlo simulations.
Table 1. Classification results of the ISPRS dataset using simple attributes and spatial contextual attributes by means of the five used classifiers. The reported overall accuracy measures and the corresponding confidence intervals are averaged over ten runs. The numbers in bold indicate the best attribute regarding each classifier (OA=Overall Accuracy, LB=Lower Bound, UB=Upper Bound of the Confidence Interval). The RF classifier was not Applied with the NDVI and DSM Attributes, since they contain only a one-dimensional attribute. The numbers in bold indicate the best-obtained classification results regarding each attribute combination. The Values are in %.
Attribute combination
Classification methods (a) Simple attributes
DT RF MLR SVM PerTurbo OA LB UB OA LB UB OA LB UB OA LB UB OA LB UB OrthoImg 62.08 62.04 62.13 68.2 68.16 68.24 59.32 59.27 59.36 72.12 72.08 72.16 62.93 62.81 62.97 NDVI 19.99 19.95 20.21 - - - 02.22 02.21 02.24 13.20 13.17 13.23 30.94 30.90 30.98 DSM 39.74 39.69 39.78 - - - 34.13 34.09 34.18 39.41 39.36 39.45 28.53 28.49 28.58 OrthoImg+NDVI 62.09 62.04 62.14 67.77 67.73 67.81 59.32 59.28 59.37 72.21 72.16 72.25 62.93 62.88 62.97 OrthoImg+DSM 61.82 61.78 61.87 75.12 75.08 75.16 67.35 67.30 67.40 74.64 74.61 74.68 70.31 70.27 70.36 OrthoImg+NDVI+DSM 61.82 61.79 61.87 75.17 75.13 75.21 67.35 67.30 67.40 74.32 74.28 74.36 70.31 70.27 70.36
(b) Joint simple and multi-scale attributes
NDVIAP 57.49 57.45 57.54 65.21 65.17 65.25 63.45 63.41 63.50 66.80 66.75 66.84 62.90 62.86 62.95 DSMAP 39.74 39.70 39.78 39.69 39.65 39.74 37.63 37.59 37.68 41.44 41.39 41.48 40.57 40.52 40.61 OrthoImg+NDVIAP 58.51 58.47 58.56 70.41 70.37 70.46 68.24 68.20 68.29 73.03 72.99 73.07 69.69 69.64 69.73 OrthoImg+DSMAP 62.69 62.64 62.73 75.39 75.35 75.43 77.14 77.10 77.18 79.02 78.99 79.06 74.95 74.91 74.99 OrthoImg+DSM+NDVIAP 68.94 68.90 68.98 77.63 77.60 77.67 77.27 77.24 77.31 78.96 78.92 79.00 75.61 75.57 75.65 OrthoImg+NDVI +DSMAP 61.81 61.78 61.87 67.99 67.94 68.03 67.24 67.20 67.29 71.37 71.33 71.42 68.42 68.38 68.47
Table 2. Confusion matrix of the best attribute combination (OrthoImg+DSM+NDVIAP) with the SVM classifier for the
ISPRS data set. The reported confusion matrix is from one run of the Monte-Carlo Simulation.
Reference Classi-fication
imp_surf building low_veg tree car Total
imp_surf 1134683 126552 15878 10502 23258 1310873 building 66981 1095391 7719 9632 2503 1182226 low_veg 62213 20697 531225 228248 2376 844759 tree 12193 9912 69673 1029302 382 1121462 car 215824 52040 12235 4519 78621 363239 Total 1491894 1304592 636730 1282203 107140 4822559 Class
name PA [%] UA [%] F1 [%] Overall accuracy = 80.2% Kappa coefficient = 0.741 imp_surf 76.1 86.6 81.0 building 84.0 92.6 88.1 low_veg 83.4 62.9 71.7 tree 80.3 91.8 85.6 car 73.4 21.6 33.4
Delivered by Ingenta to: American Society for Photogrammetry and Remote Sensing Member Access
IP: 77.68.251.11 On: Wed, 08 Mar 2017 18:32:14
Copyright: American Society for Photogrammetry and Remote Sensing
Of interest is also the graphical output, the land cover map(see Figure 3). It may be checked as to how the classes of the map are detected and separated from each other. It can be noticed that the classes “building” and “impervious surface” are well detected. The class “car” with F1 = 33.4 percent is not well discovered.
Classification Results of RCD30 Dataset
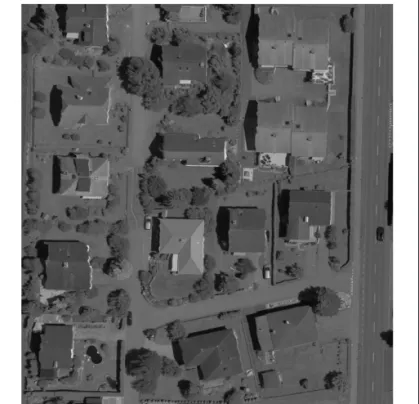
Example 2 is a suburb area in Switzerland. This test site consists of several residential houses, roads, lawns, trees, and bushes (see Figure 4), and it covers 1.4 ha.
Description of the Data
The images of the RCD30 demo set were taken with a GSD of 5 cm and were then geo-referenced. By means of two overlap-ping images a digital surface model (DSM) with 907339 cells has been derived using matching techniques. The software package “Match-T” has been applied for this task (Heuchel
et al., 2011). The resolution of the gridded DSM is about 11 cm. By means of filtering, a digital terrain model (DTM) and a normalized digital surface model (nDSM) were derived from the DSM. Based on the DTM, a false-color orthoimage has been compiled. The intensities of four channels (R, G, B, NIR) were used in the classification (attribute “OrthoImg”).
A land cover map was generated using six classes (“build-ing”, “hedge & bush”, “grass”, “road & parking lot”, “tree”,
“wall & car port”). A few other objects exist in the area, e.g., cars and swimming pools; their number is very small. There-fore, they are not chosen as a class. The assessment of the the-matic accuracy used reference points that were extracted from the geo-referenced orthoimage. About 2,400 points were used for each of the six classes in the assessment. The classification results of the RCD30 dataset are presented in the following. It will be done in the same way as with the ISPRS dataset.
Classification Results with Simple and Multi-Scale Attributes
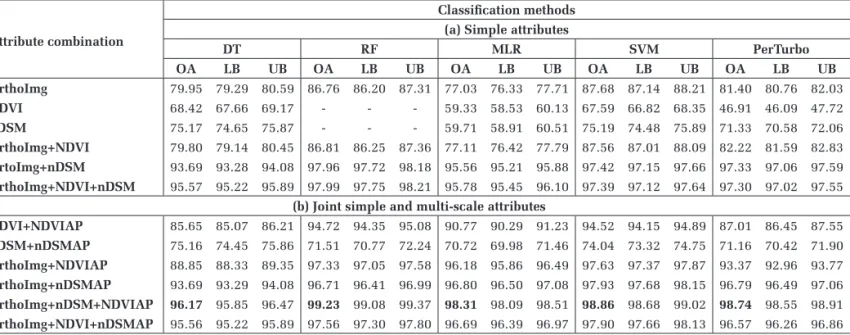
Table 3 reports the classification results of the RCD30 dataset regarding the six simple attributes and six spatial contextual (multi-scale) attributes for the five classifiers.
When the classification results of the NDVI and nDSM attri-butes are analyzed, it shows that the classification results of the
NDVI attributes are worse when compared to the nDSM attribute. This indicates that the height above ground (nDSM) is crucial information for the urban cover imagery. It is also interesting to see that when the NDVI attribute is combined with the intensi-ties of the orthoimage: there is no change in classification ac-curacy when compared to the classification acac-curacy using the orthoimage attributes (orthoImg). On the other hand, when the
nDSM attributes are combined with the orthoimage attributes, a significant improvement (greater than 10 percent) emerges in the classification accuracy. This result states further that the
NDVI attribute does not provide any additional information for class discrimination, whereas the nDSM attribute increases the class discriminate information and results in the highest clas-sification accuracy. The analysis for the identification of the best attribute combination reveals that orthoimage intensities combined with nDSM attributes is the optimal attribute combi-nation for the RCD30 data set. The best classification accuracy achieved with RCD30 data set is about 97 percent.
When the multi-scale representation of the NDVI attributes is incorporated along with the original NDVI attributes, the classification accuracy has been increased significantly by about 26 percent with SVM classifier and by an average of 29 percent with all the five classifiers in comparison with simple
NDVI attribute. This shows that the multi-scale representation of NDVI attributes increases the class discriminant information and classification accuracy as observed with the ISPRS dataset.
Figure 3. Graphical result of the generated land cover map using the SVM classification method and the attribute combination (orthoimage intensities, NDVI, DSM, NDVIAP)
Delivered by Ingenta to: American Society for Photogrammetry and Remote Sensing Member Access
IP: 77.68.251.11 On: Wed, 08 Mar 2017 18:32:14
Copyright: American Society for Photogrammetry and Remote Sensing
On the other hand, when the multi-scale representation of the
nDSM attributes is incorporated along with the original nDSM
at-tribute, the improvement in classification accuracy is limited. Furthermore, when the orthoimage or all the simple attributes are combined with multi-scale attributes, the classification accuracy has significantly improved. Finally, the combination of orthoimage+nDSM+NDVIAP has been identified as the optimal
attribute combination of the RCD30 dataset. The confusion matrix, producer’s, and user’s accuracy of land cover classes of the RCD30 data with respect to the best attribute combination and classification method is shown in Table 4.
We initially expected that the incorporation of the ‘raw’
NDVI attribute along with orthoimage would increase the clas-sification accuracy, but in our two examples it was observed that NDVI was not a useful attribute (in its ‘raw’ format) to characterize the land cover classes. Tokarczyk et al. (2015) also observed similar behavior of the NDVI attribute for the classification of high-resolution urban imagery. However, in this study we showed how the NDVI attribute can be utilized for urban cover classification by modeling the spatial contex-tual information using morphological attribute profiles. This is an important contribution that could directly influence many real-world applications when dealing with high-resolu-tion urban imagery.
The produced land cover map is depicted in Figure 5. It can be noticed that the classes “building” and “road & park-ing lot” are well detected. Smaller objects like hedges and walls are also represented in the map. Shadows behind build-ings are the reason for errors. Shadows should, therefore, be removed by preparatory work before the classification.
Comparison with Existing Attribute Profiles
In this sub-section, we compare the classification accuracies of the best feature set including NDVI-derived attribute profiles with some baseline approaches representative to the existing use of attribute profiles in the literature. Attribute profiles are usually computed from the original orthoimage or from its principal components (extended attribute profile). For the orthoimage, we compute the attribute profiles marginally (i.e., channel wise) on each of the bands and concatenate the fea-tures into a single vector. When principal component analysis is applied, the attribute profiles are computed either on the first principal component (PC) or on the first two PCs (the first two PCs account to 99 percent variance of the original image for both datasets).
Tables 5 and 6 show results achieved with five different classifiers when considering the five different baseline con-figurations and the proposed feature set on the ISPRS and RCD datasets. The proposed set consisting of the multi-scale NDVI
characterization along with simple attributes significantly out-performed the baseline approaches for both datasets. Indeed, the improvement observed with the ISPRS dataset is about 3 percent on average when compared with attribute profiles Table 3. Classification accuracy measures of the RCD30 dataset with different combinations of the simple and multi-scale attributes by five different classification methods. The reported accuracy measures are averaged over ten independent runs (OA=Overall Accuracy, LB=Lower Bound, UB=Upper Bound of the Confidence Interval). The RF classifier was not applied with the NDVI and nDSM attributes, Since they contain one-dimensional attributes only. The numbers in bold indicate the obtained best classification results with regard to each attribute combination. The values are in %.
Attribute combination
Classification methods (a) Simple attributes
DT RF MLR SVM PerTurbo OA LB UB OA LB UB OA LB UB OA LB UB OA LB UB OrthoImg 79.95 79.29 80.59 86.76 86.20 87.31 77.03 76.33 77.71 87.68 87.14 88.21 81.40 80.76 82.03 NDVI 68.42 67.66 69.17 - - - 59.33 58.53 60.13 67.59 66.82 68.35 46.91 46.09 47.72 nDSM 75.17 74.65 75.87 - - - 59.71 58.91 60.51 75.19 74.48 75.89 71.33 70.58 72.06 OrthoImg+NDVI 79.80 79.14 80.45 86.81 86.25 87.36 77.11 76.42 77.79 87.56 87.01 88.09 82.22 81.59 82.83 OrtoImg+nDSM 93.69 93.28 94.08 97.96 97.72 98.18 95.56 95.21 95.88 97.42 97.15 97.66 97.33 97.06 97.59 OrthoImg+NDVI+nDSM 95.57 95.22 95.89 97.99 97.75 98.21 95.78 95.45 96.10 97.39 97.12 97.64 97.30 97.02 97.55
(b) Joint simple and multi-scale attributes
NDVI+NDVIAP 85.65 85.07 86.21 94.72 94.35 95.08 90.77 90.29 91.23 94.52 94.15 94.89 87.01 86.45 87.55 nDSM+nDSMAP 75.16 74.45 75.86 71.51 70.77 72.24 70.72 69.98 71.46 74.04 73.32 74.75 71.16 70.42 71.90 OrthoImg+NDVIAP 88.85 88.33 89.35 97.33 97.05 97.58 96.18 95.86 96.49 97.63 97.37 97.87 93.37 92.96 93.77 OrthoImg+nDSMAP 93.69 93.29 94.08 96.71 96.41 96.99 96.80 96.50 97.08 97.93 97.68 98.15 96.79 96.49 97.06 OrthoImg+nDSM+NDVIAP 96.17 95.85 96.47 99.23 99.08 99.37 98.31 98.09 98.51 98.86 98.68 99.02 98.74 98.55 98.91 OrthoImg+NDVI+nDSMAP 95.56 95.22 95.89 97.56 97.30 97.80 96.69 96.39 96.97 97.90 97.66 98.13 96.57 96.26 96.86 Table 4. Confusion matrix, producer’s accuracy, user’s accuracy,
and F1 score of the different land cover classes obtained by the best attribute combination (Orthoimage+Ndsm+NDVIAP) using the random forest classifier and the RCD30 Data. The reported measures are from the best single run of a Monte-Carlo simulation (ten independent runs).
Reference Classi-fication building hedge & bush grass road & parking lot tree wall & car port Total building 3704 0 0 0 0 0 3704 hedge&bush 0 2788 8 0 2 18 2816 grass 0 11 2169 0 0 27 2207 road& parking lot 0 0 0 2651 0 0 2651 tree 0 1 0 0 1326 0 1327 wall&car port 0 8 3 1 1 1731 1744 total 3704 2808 2180 2652 1329 1776 14449 Class name PA [%] UA [%] F1[%] Overall accuracy = 99.5% Kappa coefficient = 0.993 building 100 100 100 hedge&bush 99.29 99.01 99.15 grass 99.50 98.28 98.88 road& parking lot 99.96 100 99.98 tree 99.77 99.92 99.85 wall&car port 97.47 99.25 98.35
Delivered by Ingenta to: American Society for Photogrammetry and Remote Sensing Member Access
IP: 77.68.251.11 On: Wed, 08 Mar 2017 18:32:14
Copyright: American Society for Photogrammetry and Remote Sensing
computed from all bands of the orthoimage or from its twofirst principal components. It is about a 20 percent improve-ment when the attribute profile is computed from a single feature (the first principal component). A similar observation can also be derived for the RCD30 dataset. More interest-ingly, our proposed set of simple features and NDVI attribute
profile attain this improvement with a much smaller number of features than those of baseline approaches. While attribute profiles computed from the original orthoimage or its first two principal components, respectively, lead to feature vector lengths of 291 and 194, respectively; our proposed combined set contains only 101 features. When the multi-scale attri-butes with similar number of features vectors is considered, the attribute profile computed from NDVI only is also better
than the attribute profiles computed from the first principal component (9 percent gain with ISPRS, 2 percent with RCD30).
These various observations show the potential of applying attribute profiles on derived features to generate accurate land cover maps.
Figures 6 through 9 show the per-class (producer’s and us-er’s) SVM classification accuracies for different configurations
with both datasets. They reveal that integrating the proposed multi-scale characterization of derived features (NDVI or DSM/ nDSM) outperformed baseline approaches for most of the land
cover classes.
Performance Analysis of Classification Methods
In this sub-section, we assess the impact of classification methods over the considered different attribute combinations. From Tables 1 and 3 it is evident that there is a variability of classification accuracy regarding different attribute combina-tions and classifiers for both datasets. Thus, it is necessary to conduct comparative analysis on the performance of differ-ent classifiers and differdiffer-ent attribute combinations to gain the knowledge on choice of the appropriate methods. Based on the performance analysis of the different classification methods, we have not found a unique classifier being optimal
Figure 5. Graphical result of the generated land cover map using the RF classification method with the attribute combination (orthoimage intensities, NDVI, nDSM, NDVIAP). Table 5. Classification of the ISPRS dataset: accuracy measures (in %) achieved with the best proposed combined feature set and with five baseline configurations. The reported measures are averaged over 10 independent runs (OA=overall accuracy, LB=lower bound, UB=upper bound of the confidence interval). The numbers in bold indicate the obtained best classification results and the numbers in brackets indicate the number of features..
Attribute combination Classification methods DT RF MLR SVM PerTurbo OA LB UB OA LB UB OA LB UB OA LB UB OA LB UB OrthoImg+DSM+NDVIAP (101) 68.94 68.90 68.98 77.63 77.60 77.67 77.27 77.24 77.31 78.96 78.92 79.00 75.61 75.57 75.65 OrthoImgAP (291) 60.38 60.34 60.43 76.05 76.01 76.09 73.82 73.78 73.86 77.54 77.51 77.58 72.54 72.50 72.58 PC1AP (97) 44.35 44.31 44.39 57.31 57.26 57.35 52.47 52.43 52.51 58.71 58.67 58.76 55.93 55.88 55.97 OrthoImg+PC1AP (99) 64.23 64.18 64.27 72.45 72.41 72.49 71.34 71.30 71.38 74.75 74.72 74.79 66.70 66.65 66.74 PC12AP (194) 66.66 66.62 66.71 74.76 74.73 74.80 72.26 72.21 72.30 75.40 75.37 75.44 72.48 72.44 72.53 OrthoImg+PC12AP (195) 66.66 66.62 66.70 74.96 74.92 75.00 72.78 72.74 72.82 76.44 76.40 76.48 72.62 72.58 72.67 Table 6. Classification of the RCD30 dataset: accuracy measures (in %) achieved with the best proposed combined feature set and with five baseline configurations. The reported measures are averaged over 10 independent runs (OA=overall accuracy, LB=lower bound, UB=upper bound of the confidence interval). The numbers in bold indicate the obtained best classification results and the numbers in brackets indicate the number of features.
Attribute combination Classification methods DT RF MLR SVM PerTurbo OA LB UB OA LB UB OA LB UB OA LB UB OA LB UB OrthoImg+nDSM+NDVIAP (102) 96.17 95.85 96.47 99.23 99.08 99.37 98.31 98.09 98.51 98.86 98.68 99.02 98.74 98.55 98.91 OrthoImgAP (388) 94.54 94.16 94.90 99.39 99.26 99.51 99.06 98.89 99.21 99.36 99.22 99.48 98.41 98.19 98.60 PC1AP (97) 77.53 76.84 78.20 92.99 92.57 93.40 90.26 89.77 90.73 93.23 92.82 93.64 86.55 85.98 87.10 OrthoImg+PC1AP (100) 88.48 87.96 89.00 96.87 96.58 97.15 95.51 95.16 95.84 96.86 96.57 97.13 93.46 93.05 93.86 PC12AP (194) 92.84 92.41 93.25 98.78 98.60 98.95 98.55 98.35 98.74 99.17 99.01 99.31 97.71 97.45 97.94 OrthoImg+PC12AP (196) 92.84 92.41 93.25 98.88 98.70 99.04 98.47 98.27 98.67 99.28 99.13 99.41 98.08 97.85 98.30
Delivered by Ingenta to: American Society for Photogrammetry and Remote Sensing Member Access
IP: 77.68.251.11 On: Wed, 08 Mar 2017 18:32:14
Copyright: American Society for Photogrammetry and Remote Sensing
Figure 6. Producer’s accuracies for SVM classification using multi-scale attributes with the ISPRS dataset. These accuracy measures are averaged over ten runs.
Figure 7. User’s accuracies for SVM classification using multi-scale attributes with the ISPRS dataset. These accuracy measures are averaged over ten runs.
Figure 8. Producer’s accuracy for SVM classification using multi-scale attributes with the RCD30 dataset. These accuracy measures are averaged over ten runs.
Figure 9. User’s accuracy for SVM classification using multi-scale attributes with the RCD30 dataset. These accuracy measures are averaged over ten runs.
Delivered by Ingenta to: American Society for Photogrammetry and Remote Sensing Member Access
IP: 77.68.251.11 On: Wed, 08 Mar 2017 18:32:14
Copyright: American Society for Photogrammetry and Remote Sensing
across different attribute combinations when the simpleattri-butes were used. There exist up to two classifiers which can be considered as optimal across different attribute combina-tions. A similar result was also derived by Damodaran and Nidamanuri (2014a) and Fabio et al. (1997). These studies suggest that the superiority of one method over the others depends on the nature of the attributes used. In a similar man-ner, it is also observed that the performance of the classifiers is also variable with respect to each attribute combination. On the other hand, when the multi-scale attributes are consid-ered, the variability among the classification methods is less and there is a possibility of identifying a set of classification methods. This indicates that the feature engineering is more important than the choice of the classification method. This eliminates the dilemma in choosing the appropriate classifier for the problem at hand. Finally, the analysis of the PerTurbo classification method showed comparable performance with the best classification methods (SVM and RF) using a few attri-bute combinations. However, the performance PerTurbo clas-sifier is worth to explore, as it has the capacity to model the class distributions using manifold assumptions. Due to this characteristic, PerTurbo does not need complex optimization procedures. This is a unique advantage over the SVM classifier.
The produced land cover maps are by no means perfect even though the calculated overall accuracy has been very high (80.2 percent and 99.5 percent, respectively). The areas of the classes are not homogeneous. Some misinterpreta-tions can also be noticed. The produced maps need to be of higher quality to be used as topographic maps. Enhancement by means of image processing methods will further improve the cartographic quality of the produced maps. A methodol-ogy for such cartographic enhancement is proposed in Höhle (2016). A high geometric accuracy would also be a require-ment of topographic mapping. An assessrequire-ment of the geomet-ric accuracy should therefore be carried out too.
Conclusions
This study had the goal to develop a methodological frame-work to effectively utilize the auxiliary information (NDVI, DSM, nDSM) derived from remotely sensed images to produce
urban land cover classification maps and to find an optimal methodology to produce land cover maps of high thematic accuracy from aerial imagery. To understand the strong influ-ence of the choice of both the classification method and the applied class attributes, we conducted extensive experiments with seventeen different combinations of attributes and five classification methods. The experimental results state that the use of attribute profiles to model multi-level characterization has made a high thematic accuracy possible. They also re-vealed that the developed multi-level characterization of the vegetation index has a significant impact on urban imagery classification over the existing attribute profiles approaches. Furthermore, the generation of appropriate class attributes has decreased the variability of classification accuracies of different classification methods, thus indicating that the ap-propriate choice of classifier is not so important in real-world applications. The type of landscape together with the speci-fied classes of the land cover map require tests in advance to yield an optimal result. The obtained results in the two examples demonstrate that the integration of techniques from photogrammetry, remote sensing, and machine learning can produce urban land cover maps of high thematic accuracy.
Acknowledgments
The research leading to these results has received funding from the French Agence Nationale de la Recherche (ANR)
under reference ANR-13-JS02-0005-01 (Asterix project), and from the People Programme (Marie Curie Actions) of the European Union’s Seventh Framework Programme (FP7/2007-2013) under REA grant agreement number PCOFUND-GA-2013-609102, through the PRESTIGE programme coor-dinated by Campus France. The authors want to thank Leica Geosystems and the ISPRS WG III/4 for providing data for these investigations, and Dr. Mauro Dalla Mura for supplying the Matlab code for attribute profiles.
References
Aptoula, E., M. Dalla Mura, and S. Lefèvre, 2016. Vector attribute profiles for hyperspectral image classification, IEEE Transactions
on Geoscience and Remote Sensing, 54(6):3208–3220.
Benediktsson, J.A., J.A. Palmason, and J.R. Sveinsson, 2005. Classification of hyperspectral data from urban areas based on extended morphological profiles, IEEE Transactions on
Geoscience and Remote Sensing, 43(3):480–491.
Blaschke, T., 2010. Object based image analysis for remote sensing,
ISPRS Journal of Photogrammetry and Remote Sensing,
65(1):2–16.
Bohning, D., 1992. Multinomial logistic regression algorithm, Annals
of the Institute of Statistical Mathematics, 44(1):197–200.
Breiman, L., J. Friedman, C.J. Stone, and R.A. Olshen, 1984.
Classification and Regression Trees, CRC Press.
Breiman, L., 2001. Random Forests, Machine Learning, 45(1):5–32. Cao, B., L. Kang, S. Yang, D. Tan, X. Wen, 2015. Monitoring the
dynamic changes in urban lakes based on multi-source remote sensing images, Geo-Informatics in Resource Management and
Sustainable Ecosystem, Springer Berlin Heidelberg, pp. 68–78.
Chapel, L., T. Burger, N. Courty, and S. Lefèvre, 2014. PerTurbo manifold learning algorithm for weakly labeled hyperspectral image classification, IEEE Journal of Selected Topics in Applied
Earth Observations and Remote Sensing, 7(4):1070–1078.
Congalton, R.G., and K. Green, 2008. Assessing the Accuracy of
Remotely Sensed Data, CRC Press.
Dalla Mura, M., J.A. Benediktsson, B. Waske, and L. Bruzzone, 2010. Morphological attribute profiles for the analysis of very high resolution images, IEEE Transactions on Geoscience and Remote
Sensing 48(10):3747–3762.
Damodaran, B.B., and R.R. Nidamanuri, 2014a. Assessment of the impact of dimensionality reduction methods on information classes and classifiers for hyperspectral image classification by multiple classifier system, Advances in Space Research, 53(12):1720 –1734.
Damodaran, B.B., and R.R. Nidamanuri, 2014b. Dynamic linear classifier system for hyperspectral image classification for land cover mapping, IEEE Journal of Selected Topics in Applied Earth
Observations and Remote Sensing 7(6):2080–2093.
Damodaran, B.B., R.R. Nidamanuri, and Y. Tarabalka, 2015. Dynamic ensemble selection approach for hyperspectral image classification with joint spectral and spatial information, IEEE
Journal of Selected Topics in Applied Earth Observations and Remote Sensing, 8(6):2405–2417.
De Martinao, M., F. Causa, and S.B. Serpico, 2003. Classification of optical high resolution images in urban environment using spectral and textural information, Proceedings of the IEEE
Geoscience and Remote Sensing Symposium (IGARSS), pp.
467–469.
Du, P., A. Samat, B. Waske, S. Liu, and Z. Li, 2015. Random forest and rotation forest for fully polarized SAR image classification using polarimetric and spatial features, ISPRS Journal of
Photogrammetry and Remote Sensing, 105:38–53.
Du, S., F. Zhang, and X. Zhang, 2015. Semantic classification of urban buildings combining VHR image and GIS data: An improved random forest approach, ISPRS Journal of Photogrammetry and
Remote Sensing, 105:107–119.
Elshehaby, A.R., and L.G.E. Taha, 2009. A new expert system module for building detection in urban areas using spectral information and LIDAR data, Applied Geomatics, 1(4):97 –110.
Delivered by Ingenta to: American Society for Photogrammetry and Remote Sensing Member Access
IP: 77.68.251.11 On: Wed, 08 Mar 2017 18:32:14
Copyright: American Society for Photogrammetry and Remote Sensing
Fabio, R., G. Giacinto, and G. Vernazza, 1997. Comparison andcombination of statistical and neural network algorithms for remote-sensing, Neurocomputation in Remote Sensing Data
Analysis, Advances in Spatial Science Series, Springer-Verlag,
pp. 117–124.
Fauvel, J.A., J.A. Benediktsson, J. Chanussot, and J.R. Sveinsson, 2008. Spectral and spatial classification of hyperspectral data using SVMs and morphological profiles, IEEE Transactions on
Geoscience and Remote Sensing, 46(11):3804–3814.
Foody, G.M., 2000. Estimation of sub-pixel land cover composition in the presence of untrained classes, Computational Geosciences, 26(4):469–478.
Friedl, M.A., and C.E. Brodley, 1997. Decision tree classification of land cover from remotely sensed data, Remote Sensing of
Environment, 61(3):399–409.
Ghamisi, P., J.A. Benediktsson, and S. Phinn, 2014. Fusion of hyperspectral and LiDAR data in classification of urban areas,
Proceedings of the IEEE Geoscience and Remote Sensing Symposium (IGARSS), pp. 181–184.
Ghamisi, P., J.A. Benediktsson, and J.R. Sveinsson, 2014. Automatic spectral-spatial classification framework based on attribute profiles and supervised feature extraction, IEEE Transactions on
Geoscience and Remote Sensing, 52(9):5771–5782.
Ghamisi, P., M. Dalla Mura, and J.A. Benediktsson, 2015. A Survey on spectral-spatial classification techniques based on attribute profiles, IEEE Transactions on Geoscience and Remote Sensing, 53(5):2335–2353.
Heuchel, T., A. Köstli, C. Lemaire, and D. Wild, 2011. Towards a next level of quality DSM/DTM extraction with Match-T, Proceedings
of Photogrammetric Week ’11, pp. 197–202.
Höhle, J., 2016. From classification results to topographic maps, Proceedings of GEOBIA 2016 : Solutions and Synergies, 14 September 2016 - 16 September 2016, University of Twente Faculty of Geo-Information and Earth Observation (ITC), URL:
http://proceedings.utwente.nl/396/ (last date accessed: 19
January 2017).
Höhle, J., 2015. Assessment of the thematic accuracy of land cover maps, ISPRS Annals of the Photogrammetry, Remote Sensing
and Spatial Information Sciences,Vol II-3/W5, pp. 187–194.
Höhle, J., and M. Höhle, 2013. Generation and assessment of urban land cover maps using high-resolution multispectral aerial cameras, International Journal of Advanced Software, 6(3 & 4):272–282.
Höhle, J., 2013. Generation of land cover maps using
high-resolution multispectral aerial cameras, Proceedings of the Fifth
International Conference on Advanced Geographic Information Systems, Applications, and Services (GEOProcessing 2013),
International Academy, Research and Industry Association, pp. 133–138.
Hsu, C.W., and C.J. Lin, 2002. A comparison of methods of multiclass support vector machines, IEEE Transactions on Neural
Networks, 13(2):415–425.
ISPRS WG III/4, 2014. 2D semantic labelling contest, URL: http:// www2.isprs.org/semantic-labeling.html (last date accessed: 19 January 2017).
Inglada, J., 2007. Automatic recognition of man-made objects in high resolution optical remote sensing images by SVM classification of geometric image features, ISPRS Journal of Photogrammetry
and Remote Sensing, 62(3):236–248.
Khodadadzadeh, M., J. Li, S. Prasad, S., and A. Plaza, 2015. Fusion of hyperspectral and LiDAR remote sensing data using multiple feature learning, IEEE Journal of Selected Topics in Applied
Earth Observations and Remote Sensing 8(6):2971–2983.
Liao, W., M.D. Mura, X. Huang, J.S. Chanussot, S. Gautama, P. Scheunders, and W. Philips, 2016. LiDAR information extraction by attribute filters with partial reconstruction, Proceedings of the
IEEE International Geoscience and Remote Sensing Symposium (IGARSS), pp. 1484–1487.
Melgani, F., and L. Bruzzone, 2004. Classification of hyperspectral remote sensing images with support vector machines, IEEE Transactions on Geosciences and Remote Sensing, 42(8):1778– 1790.
Merciol, F., and S. Lefèvre, 2015. Fast building extraction by multiscale analysis of digital surface models, Proceedings of the
IEEE Geoscience and Remote Sensing Symposium (IGARSS), pp.
553–556.
Pal, M., 2012. Multinomial logistic regression-based feature selection for hyperspectral data, International Journal of Applied Earth
Observation and Geoinformation, 14(1):214–220.
Pal, M., 2005. Random forest classifier for remote sensing classification, International Journal of Remote Sensing, 26(1):217–222.
Pedergnana, M., P.R. Marpu, M.D. Mura, J.A. Benediktsson, and L. Bruzzone, 2012. Classification of remote sensing optical and LiDAR data using extended attribute profiles, IEEE Journal of
Selected Topics in Signal Processing, 6(7):856–865.
Salehi, B., Y. Zhang, M. Zhong, and V. Dey, 2012a. Object-based classification of urban areas using VHR Imagery and height points ancillary data, Remote Sensing, 4(8):2256–2276. Salehi, B., Y. Zhang, M. Zhong, and V. Dey, 2012b. A review of
the effectiveness of spatial information used in urban land cover classification of VHR imagery, International Journal of Geoinformatics, 8(2):35–51.
Sampath, A., and J. Shan, 2007. Building boundary tracing and regularization from airborne LiDAR point clouds,
Photogrammetric Engineering & Remote Sensing, 73(7):805–812.
Thomas, N., C. Hendrix, and R.G. Congalton, 2003. A comparison of urban mapping methods using high-resolution digital imagery,
Photogrammetric Engineering & Remote Sensing 69(9):963–972.
Tokarczyk, P., J.D. Wegner, S. Walk, and K. Schindler, 2015. Features, color spaces, and boosting: New insights on semantic classification of remote sensing images, IEEE Transactions on
Geoscience and Remote Sensing (1):280–295.
Trias-Sanz, R., G. Stamon, and J. Louchet, 2008. Using colour, texture, and hierarchial segmentation for high-resolution remote sensing, ISPRS Journal of Photogrammetry and Remote Sensing, 63(2):156–168.
Zhan, Q., M. Molenaar, K. Tempfli, and W. Shi, 2005. Quality assessment for geo-spatial objects derived from remotely sensed data, International Journal of Remote Sensing, 26(14):2953–2974. Zhang, L., L. Zhang, D. Tao, and X. Huang, 2012. On combining
multiple features for hyperspectral remote sensing image classification, IEEE Transactions on Geoscience and Remote
Sensing, 50(3):879–893.
(Received 23 June 2016; accepted 08 August 2016; final ver-sion 28 November 2016)