HAL Id: hal-01654133
https://hal.archives-ouvertes.fr/hal-01654133
Submitted on 10 Jan 2020
HAL is a multi-disciplinary open access
archive for the deposit and dissemination of
sci-entific research documents, whether they are
pub-lished or not. The documents may come from
teaching and research institutions in France or
abroad, or from public or private research centers.
L’archive ouverte pluridisciplinaire HAL, est
destinée au dépôt et à la diffusion de documents
scientifiques de niveau recherche, publiés ou non,
émanant des établissements d’enseignement et de
recherche français ou étrangers, des laboratoires
publics ou privés.
The relation between MOS and pairwise comparisons
and the importance of cross-content comparisons
Emin Zerman, Vedad Hulusic, Giuseppe Valenzise, Rafal Mantiuk„ Frederic
Dufaux
To cite this version:
Emin Zerman, Vedad Hulusic, Giuseppe Valenzise, Rafal Mantiuk„ Frederic Dufaux. The relation
between MOS and pairwise comparisons and the importance of cross-content comparisons. Human
Vision and Electronic Imaging Conference, IS&T International Symposium on Electronic Imaging (EI
2018), Jan 2018, Burlingame, United States. �hal-01654133�
The Relation Between MOS and Pairwise Comparisons and
the Importance of Cross-Content Comparisons
Emin Zerman, LTCI, T ´el ´ecom ParisTech, Universit ´e Paris-Saclay Vedad Hulusic, LTCI, T ´el ´ecom ParisTech, Universit ´e Paris-Saclay
Giuseppe Valenzise, Laboratoire des Signaux et Syst `emes (L2S, UMR 8506), CNRS - CentraleSup ´elec - Universit ´e Paris-Sud Rafał K. Mantiuk, The Computer Laboratory, University of Cambridge
Fr ´ed ´eric Dufaux, Laboratoire des Signaux et Syst `emes (L2S, UMR 8506), CNRS - CentraleSup ´elec - Universit ´e Paris-Sud
Abstract
Subjective quality assessment is considered a reliable method for quality assessment of distorted stimuli for several mul-timedia applications. The experimental methods can be broadly categorized into those that rate and rank stimuli. Although rank-ing directly provides an order of stimuli rather than a continuous measure of quality, the experimental data can be converted using scaling methods into an interval scale, similar to that provided by rating methods. In this paper, we compare the results collected in a rating (mean opinion scores) experiment to the scaled results of a pairwise comparison experiment, the most common ranking method. We find a strong linear relationship between results of both methods, which, however, differs between content. To im-prove the relationship and unify the scale, we extend the experi-ment to include content comparisons. We find that the cross-content comparisons reduce the confidence intervals for pairwise comparison results, but also improve the relationship with mean opinion scores.
Introduction
Subjective quality assessment is being used by many do-mains including psychology, medical applications, computer graphics, and multimedia. Regardless of the domain, it is regarded as a reliable method of quality assessment and it is often employed to collect “ground-truth” quality scores.
Two of the main methods of subjective quality assessment for multimedia content are direct rating and ranking. Direct rat-ing methods ask the observers to assign scores to observed stim-uli. They may involve displaying a single stimulus (absolute cat-egory rating (ACR), single stimulus continuous quality evalua-tion (SSCQE)), or displaying two stimuli (double stimulus impair-ment scale (DSIS), double stimulus continuous quality evaluation (DSCQE)). Ranking methods ask the observers to compare two or more stimuli and order them according to their quality. The most commonly employed ranking method is pairwise compar-isons (PC). Pairwise comparcompar-isons were argued to be more suitable for collecting quality datasets because of the simplicity of the task and consistency of the results [1, 2]. Those works, however, did not consider an important step in analysis of pairwise compari-son data, which is scaling pairs of comparicompari-sons onto an interval quality scale. In this work we analyze the importance of this step and demonstrate how it enables to yield a unified quality scale between rating and ranking methods.
The vast majority of studies employing the pairwise com-parison method compare only the images depicting the same
con-tent, for example comparing different distortion levels applied to the same original image. This “apple-to-apple” comparison sim-plifies the observers’ task, making results consistent within con-tent. However, it also comes with some limitations. On one hand, assessing and scaling each content independently makes it diffi-cult to obtain scores that correctly capture quality differences be-tween conditions across different contents on a common quality scale. On the other hand, pairwise comparison capture only rel-ative quality relations. Therefore, in order to assign an absolute value to such relative measurements, the experimenter needs to assume a fixed quality for a certain condition which is then used as reference for the scaling. As a result, the scaling error accumu-lates as conditions get perceptually farther from the reference.
In this work we study the effect of adding cross-content com-parisons, showing that this not only does allow to unify the quality scale across content, but it also improves significantly the accu-racy of scaled quality scores. In order to understand the effect of cross-content pairwise comparison, we conduct three different experiments using pairwise comparison and double stimulus im-pairment scale methodologies. There are three major findings of this paper:
• There is a strong linear relation between the mean opinion scores (MOS) obtained by direct rating, and scaled PC re-sults;
• The addition of cross-content comparisons to the traditional PC reduces error accumulation and increases accuracy when scaling PC results;
• Cross-content comparisons align the PC scaling results of different contents to a common quality scale, reducing con-tent dependency.
For this study, we use the high dynamic range (HDR) video qual-ity dataset, presented in our previous work [3]. Detailed informa-tion on scaling, the video quality database used, and the results are presented in the following sections.
Related work
There has been a substantial amount of work comparing different methodologies for the subjective quality assessment. In [4], Pinson and Wolf compared single-stimulus and double-stimulus continuous quality evaluation methods (SSCQE and double-stimulus continuous quality scale (DSCQS)) and found that the quality estimates are comparable to one another. In [5], ACR, DSIS, DSCQS and SAMVIQ were compared. The authors found no significant differences between the compared methods.
The compared methods were also ranked for the assessment times and the ease of evaluation. It was found that from fastest to slow-est, the ranking was ACR, DSIS, SAMVIQ, and DSCQS. The ease of evaluation analysis yielded a similar result with the ex-ception that ACR with 11-point scale was the hardest to evalu-ate whereas ACR with 5-point scale was the easiest. SAMVIQ and ACR were further compared in [6], and SAMVIQ was found to require fewer subjects and longer time compared to ACR. In the study of Mantiuk et al. [7], four different subjective methods were compared: single-stimulus categorical rating (absolute cat-egory rating with hidden reference (ACR-HR)), double-stimulus categorical rating, forced-choice pairwise comparison, and pair-wise similarity judgments. No significant difference was found between double-stimulus and single-stimulus methods, in agree-ment with the previous studies. The forced-choice pairwise com-parison method was found to be the most accurate and requring the least experimental effort amongst the four compared methods. The methodology of a subjective experiment depends on the intent and research problem. Although direct rating meth-ods are able to obtain quality scores directly, ranking methmeth-ods such as pairwise comparison offer additional preference informa-tion. There are several advantages in using pairwise comparison methodology. Since users are expected to choose one of the pairs (or “same” in some cases), PC does not require a quality scale. The users are able to decide faster compared to direct rating meth-ods. Since the task is much more intuitive, the training of the subjects is simpler and less critical than for the rating methods.
JNDs and JODs
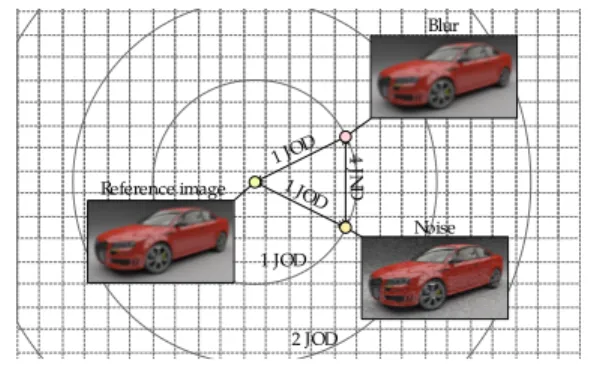
The results of paired comparisons are typically scaled in Just-Noticeable-Difference (JND) units [8, 9]. Two stimuli are 1 JND apart if 75% of observers can see the difference between them. However, we believe that considering measured differences as “noticeable” leads to an incorrect interpretation of the experi-mental results. Let us take as an example the two distorted im-ages shown in Figure 1: one image is distorted by noise, the other by blur. Both images are definitely noticeably different and in-tuitively they should be more than 1 JND apart. However, the question we ask in an image quality experiment is not whether they are different, but rather which one is closer to the perfect quality reference. Note that a reference image does not need to be shown to answer this question as we usually have a mental no-tion of how a high quality image should look like. Therefore, the data we collect does not measure visual differences between im-ages, but rather it measures image quality difference in relation to a perfect quality reference. For that reason, we describe this qual-ity measure as Just-Objectionable-Differences (JODs) [17] rather than JNDs. Note that the measure of JOD is more similar to the quality expressed as a difference mean opinion score (DMOS) rather than to JNDs.
Dataset & Experiment Setup
In this study, a dataset consisting of 60 compressed HDR videos was used. 5 original video sequences were compressed using HEVC Main 10 profile with three different color space con-versions (RGB → Y’CbCr, ITP, and Ypu’v’). These sequences are then compressed using four different bitrates. Each video se-quence was 10 seconds long, composed of two identical 5-second long video segments played twice in succession. The selection of
1 JOD 2 JOD 1 JOD 4 JND Reference image Blur Noise 1 JOD
Figure 1. Illustration of the difference between just-objectionable-differences (JODs) and just-noticeable-just-objectionable-differences (JNDs). The image af-fected by blur and noise may appear to be similarly degraded in comparison to the reference image (the same JOD), but they are noticeably different and therefore several JNDs apart. The mapping between JODs and JNDs can be very complex and the relation shown in this plot is just for illustrative pur-poses.
the sequences was made to ensure a good variety in both image statistics, measured by image key (IK), dynamic range (DR), spa-tial (SI) and temporal (TI) perceptual information measures, and the image content. Readers can refer to our previous work [3] for other details on the compression scheme and the bitrate selection.
Experiment Setup
The experiments were conducted in a quiet and dark room conforming to ITU Recommendations [10, 11]. The ambient il-lumination of the room was set to ∼2 lux. The luminance of the screen when turned off was 0.03 cd/m2. A calibrated HDR SIM2 HDR47ES4MB 47” display with 1920 × 1080 pixel resolution was used in its native HDR mode. The subject’s distance from the screen was fixed to three heights of the display, with the ob-servers’ eyes positioned zero degrees horizontally and vertically from the center of the display [11].
Four different experiments were conducted for this study to understand the effect of cross-content comparison and relation be-tween MOS and JOD values. These experiments share a common set of parameters in addition to those of test room. The stim-uli were presented as pairs with a side-by-side representation. A gray screen was shown before each pair for 2 seconds. The stimuli were presented, and the viewers were asked to vote. The duration of voting was not limited. A training session was conducted be-fore each test, and the duration of the tests was less than 30 min-utes including the training. All of the observers were screened and reported normal or corrected-to-normal visual acuity.
Subjective Experiments
a. Standard pairwise comparisons experiment
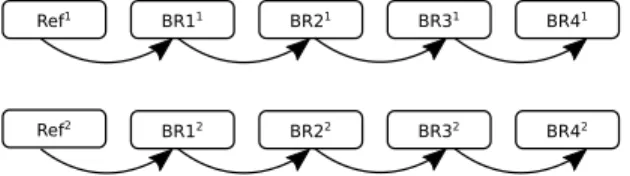
The first experiment conducted was a pairwise comparison experiment with incomplete design. In this experiment, a pair of videos with two consecutive bitrates from the same color space or with the same bitrate from two different color spaces was com-pared, as shown in Figure 2(a). In order to keep the experi-ment short, other pair combinations were not included in this test. These comparisons were made only within the same content.
In total, 65 videos were compared in 240 pairs (including mirrored versions). In order to keep each session under 30 min-utes, the tests were conducted in two sessions. The order of the
Ref1 BR11
Ref2
BR21 BR31 BR41
BR12 BR22 BR32 BR42
(a) Standard Pairwise Comparisons - Incomplete design
Ref1 BR11
Ref2
BR21 BR31 BR41
BR12 BR22 BR32 BR42
(b) Double Stimulus Impairment Scale
Ref1 BR11
Ref2
BR21 BR31 BR41
BR12 BR22 BR32 BR42
(c) Proposed Pairwise Comparisons with the addition of cross-content comparisons - Incomplete design
Figure 2. Comparison of the DSIS and PC experiments, where Refiis the
reference (original) for video content i, BR jiis video content i compressed
with the j-th bitrate ( j = 1 is the highest bitrate). To avoid cluttering, we draw only the comparisons for one color space in the scheme. Only the pairs shown with black arrows were compared in the third experiment, and the results were combined with those indicated with gray arrows (obtained in the first experiment) before processing.
pairs were randomized for each session and the second session comprised of the mirrored versions of the videos of the first ses-sion. The duration of each session of the tests was approximately 30 minutes. There were 18 participants (14 male, 4 female) with an average age of 29.44. Since the other experiments have 15 par-ticipants, in order to keep the number of the participants the same in all of the experiments, opinion scores of 3 random participants were removed from the results of this experiment. Readers can refer to our previous work [3] for more information.
b. Double stimulus impairment scale
In order to analyze the pairwise comparison scaling results and understand whether these scaling results are comparable to the quality scores, a second experiment was conducted following the double stimulus impairment scale (DSIS) methodology. In this second experiment, DSIS Variant I methodology with a side-by-side presentation was used. A continuous scale ([0,100], 100 corresponding to “Imperceptible”) was used instead of a categor-ical one (5 point impairment scale). All of the distorted videos were compared with the non-distorted reference video, as shown in Figure 2(b) with black arrows.
A total of 120 pairs were compared (included mirrored ver-sions). In order not to distract the viewers, left or right side se-lected and original videos were always placed on the sese-lected side for each viewer. To avoid any contextual effects, the original
videos were presented on the left side of the display for half of the viewers and on the right side for the other half of the viewers. The duration of the DSIS tests was approximately 18 minutes. In total, 15 people (8 male, 7 female) with the mean age of 26.87 participated in the test.
c. Pairwise comparisons with cross-content pairs
A third experiment was conducted in order to analyze and understand the effects of cross-content pairwise comparison. We were motivated to run such cross-content comparison experiment after observing that such comparisons are indirectly performed in the DSIS methodology. When viewers rate sequences, they judge the quality in relation to all other sequences they have seen, also the sequences presenting different content. Viewers were intro-duced the compression artifacts in the training part, and they were asked “Which one of the pairs have a better quality in terms of compression artifacts?”. In order to keep the experiment short, we compared videos with different contents at the same bitrate, as shown in Figure 2(c).
In order to conduct the test in one session and within 30 min-utes, only videos encoded using Y’CbCr color space were com-pared, and the test set consisted of a total of 80 pairs (included mirrored versions). The duration of the tests was approximately 20 minutes. 15 people (8 male, 7 female) with an average age of 27.73 took part to the test.
d. Pairwise comparisons with same-content pairs
In order to find the effect of the addition of cross-content pairs on confidence intervals, we conducted a fourth experiment with additional same-content pairs. In this experiment, a pair of videos with two consecutive bitrates (excluding reference) from the same color space was compared. The design was similar to Figure 2(a) except the comparison to reference videos and across-colorspace comparisons. For a fair comparison of confidence in-tervals, we tried to match the number of comparisons for same-content and cross-same-content cases, and 90 pairs (included mirrored versions) were compared by 15 subjects (8 male, 7 female) with an average age of 29.
Scaling Pairwise Comparison Data
The results of a pairwise comparison experiment can be gath-ered in a preference matrix, also known as a comparison matrix. Its elements contain the counts of how many times one condition is voted as better than the other. These preference matrices can be used to find a quality score for each condition using one of several scalingmethods [12, 13, 14, 15].
Commonly, pairwise comparison experiments are described by either of the two models: Bradley-Terry model [12] or Thur-stone’s model [13]. Bradley-Terry model finds the quality, or rat-ing, of each stimulus which satisfies ∑N
i=1πi= 1 and P(i > j) = πi
πi+πj, where N is the total number of stimuli and πiis the quality of stimulus i. It assumes that the difference between the quality of two stimuli i and j, πi− πj, has a logistic distribution.
Thur-stone’s model, on the other hand, assumes that people may have different opinions about each stimulus and the quality, or rating, of each stimulus can be estimated with a Gaussian distribution. Thurstone [13] considers five different cases which have differ-ent properties. The most commonly used case is Case V which assumes that each option has equal variance and equal (or zero) correlations.
Other scaling methods proposed are generally based on these two models. Lee et al. [14] proposed Paired Evaluation via Analy-sis of Reliability (PEAR) which is based on Bradley-Terry model. It computes the quality scores and their confidence intervals using the distribution of winning frequencies and ties. The scores are then found by maximizing the log-likelihood function. Tsukida and Gupta [15] compare several methods based on both Bradley-Terry and Thurstone’s model, such as least-square estimation, maximum likelihood estimation, and maximum a posteriori es-timation.
In this paper, we use pwcmp, an open source software1for
scaling pairwise comparison results. This software estimates the quality scores using a Bayesian method, which employs a maximum-likelihood-estimator to maximize the probability that the collected data explains the quality scores under the Thurstone Case V assumptions. It is robust against the incomplete and un-balanced designs and it can scale the pairs which have a unan-imous agreement. The preference probabilities are converted to quality scores considering that the probability of 0.75 (mid-point between random guess (0.5) and certainty (1)) maps to 1 just objectionable difference (JOD). The software also computes the confidence intervals using bootstrapping. Due to the relative na-ture of the pairwise comparison experiment, JOD values are rela-tive. Therefore, we always fix the undistorted reference image at 0, and the distorted stimuli have negative JOD values. The details on the scaling method can be found in [17].
Is Scaling Necessary?
Scaling methods are not always used to convert a preference matrix into quality and some researchers used alternative meth-ods. In [1] and [2], the quality values are estimated by count-ing the times one stimulus was preferred over another. However, this approach requires a complete experiment design, in which all pairs are compared, or a heuristic that would infer missing com-parisons. In contrast to vote counts, scaling methods introduce an additional step of converting preference probabilities into an interval quality scale. In order to understand the difference be-tween vote counts and the results of scaling, we compare both to the collected MOS values. We convert the results of the first pairwise comparison experiment to vote counts by counting how many times one condition was prefered over another.
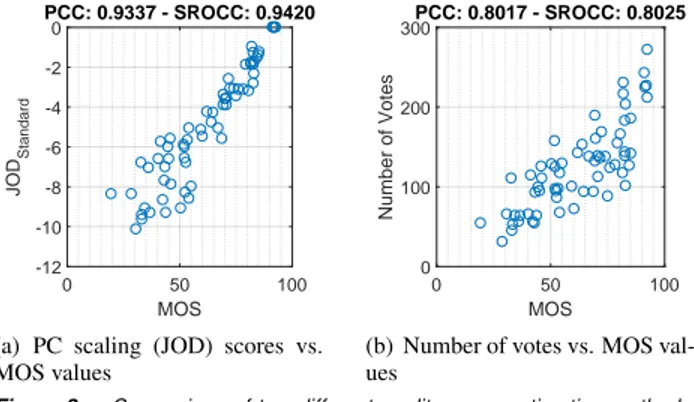
To simulate how it was done in [1, 2], the missing com-parisons are populated by the following operations: V (A,C) = min(V (A, B),V (B,C)) and V (C, A) = min(V (B, A),V (C, B)) where V (x, y) is the number of votes in the preference matrix, provided that comparison of A and C is missing, but they are both compared to B. The resulting scores are presented in Figure 3. The plots show that PC scaling (in this case, JOD) scores are well correlated to MOS values whereas the quality estimates according to the number of votes is not correlated well. Considering this result, it can be claimed that using a scaling method yields results that are better correlated with MOS values.
Comparison of MOS and PC Scaling
Although the mean opinion scores (MOS) are commonly used for the analysis of the subjective quality experiment results, 1pwcmp toolbox for scaling pairwise comparison data https:// github.com/mantiuk/pwcmp 0 50 100 MOS -12 -10 -8 -6 -4 -2 0 JOD Standard PCC: 0.9337 - SROCC: 0.9420
(a) PC scaling (JOD) scores vs. MOS values 0 50 100 MOS 0 100 200 300 Number of Votes PCC: 0.8017 - SROCC: 0.8025
(b) Number of votes vs. MOS val-ues
Figure 3. Comparison of two different quality score estimation methods. The results of the first experiment is used to find the preference matrix. PC scaling done by pwcmp software (a) yields a better correlation to the MOS values than the quality score estimation via counting the number of votes (b).
there are several drawbacks of MOS values. The outcome of the MOS experiment strongly depends on the training procedure used to familiarize participants with the quality scale. Because of the differences in this training phase, measured scores are relative and are different for each session. The MOS values can result in dif-ferent scales according to the instructor who does the training and also according to the experiment design. As it has been noticed in [16], MOS values coming from different datasets may not be comparable with each other. While combining different datasets, an alignment step is often necessary; however, this is usually over-looked.
Pairwise comparison scaling in general, and JOD scaling used in this paper in particular, does not require training and, in principle, should give consistent results for each session. Since pairwise comparison is a much more straightforward procedure, JOD values should be comparable between different datasets.
Results & Discussion
Linear Relationship Between MOS and PC Scaling
The preference matrices of the PC experiments were found and JOD scores were estimated using pwcmp software. These JOD values were found using three different sets of PC data. JODStandard was found using the data acquired in the
within-content PC experiment shown in Figure 2(a). JODSCwas found
using only the “same-content” pairs by combining the standard PC data and the 90 additional same-content pairs. JODCC, on
the other hand, was found using the combined data acquired in both the standard (same-content) and the cross-content PC exper-iments, where CC stands for “cross-content”. This combination for JODCCincludes the pairs connected with black and gray
ar-rows shown in Figure 2(c). For the DSIS experiment, the MOS values were calculated by taking the mean of opinion scores. Con-fidence intervals (CI), on the other hand, were calculated using bootstrapping in order to compare them to the CIs of JOD scores. The JODSCand JODCCare plotted vs. MOS values in Figures 4
and 5. The JODStandardwas not plotted since the r = 0.9967
be-tween JODStandardand JODSC.
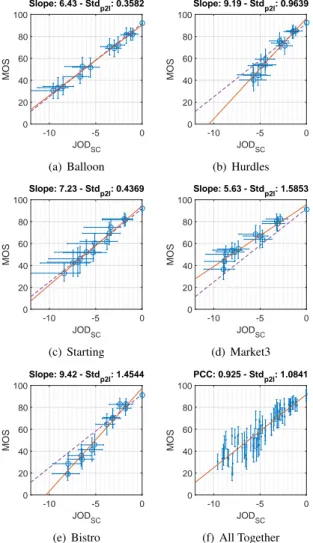
The results show that there is a strong relationship between MOS values and JOD scores. As presented in Figure 4, JOD scores and MOS values show almost linear behavior for all con-tents. Furthermore, the introduction of cross-content pairs
in--10 -5 0 JOD SC 0 20 40 60 80 100 MOS Slope: 6.43 - Stdp2l: 0.3582 (a) Balloon -10 -5 0 JOD SC 0 20 40 60 80 100 MOS Slope: 9.19 - Stdp2l: 0.9639 (b) Hurdles -10 -5 0 JODSC 0 20 40 60 80 100 MOS Slope: 7.23 - Std p2l: 0.4369 (c) Starting -10 -5 0 JODSC 0 20 40 60 80 100 MOS Slope: 5.63 - Std p2l: 1.5853 (d) Market3 -10 -5 0 JODSC 0 20 40 60 80 100 MOS Slope: 9.42 - Std p2l: 1.4544 (e) Bistro -10 -5 0 JODSC 0 20 40 60 80 100 MOS PCC: 0.925 - Std p2l: 1.0841 (f) All Together
Figure 4. JODSCvs. MOS. Solid red line indicates the best linear fit to the
data, and the dashed violet line indicates the best linear fit line of the case ’All Together’.
creases the correlation and linearity of the relationship between JOD and MOS. The JOD scores become more linear after the combination of same-content and cross-content pairs, as can be seen in Figures 4(f) and 5(f).
Reduced Content Dependency
In both Figure 4 and 5, the slopes of the best fitted line are found for each content. In order to find the effect of the ad-dition of cross-content pairs, the variance of these slopes was found. Variance of the slopes in the case of JODSCwas 2.7972
and in the case of JODCC was 0.6445. Another metric, Stdp2l,
was computed for each sub-figure presented. It is calculated as Stdp2l=
p
mean(d(P, l)2) where d(·) is the perpendicular distance
from point P to line l. In the case of sub-figures (a)-(e), Stdp2lwas
computed considering the dashed violet line, i.e., the best linear fit when all the contents are considered together. It is clear that the addition of cross-content pairs decrease the variance of the slopes of the best fitted line for each content and Stdp2las well,
thus bringing JOD scores closer on a common quality scale.
-10 -5 0 JOD CC 0 20 40 60 80 100 MOS Slope: 6.84 - Stdp2l: 0.4018 (a) Balloon -10 -5 0 JOD CC 0 20 40 60 80 100 MOS Slope: 6.66 - Stdp2l: 0.4885 (b) Hurdles -10 -5 0 JODCC 0 20 40 60 80 100 MOS Slope: 6.68 - Std p2l: 0.3649 (c) Starting -10 -5 0 JODCC 0 20 40 60 80 100 MOS Slope: 6.45 - Std p2l: 0.5154 (d) Market -10 -5 0 JODCC 0 20 40 60 80 100 MOS Slope: 8.43 - Std p2l: 0.8499 (e) Bistro -10 -5 0 JODCC 0 20 40 60 80 100 MOS PCC: 0.979 - Std p2l: 0.5516 (f) All Together
Figure 5. JODCCvs. MOS. Instead of only same-content pairs, a
com-bination of same-content and cross-content pairs were used to find JODCC.
Please also refer to the caption of Figure 4.
Reduced Error Accumulation
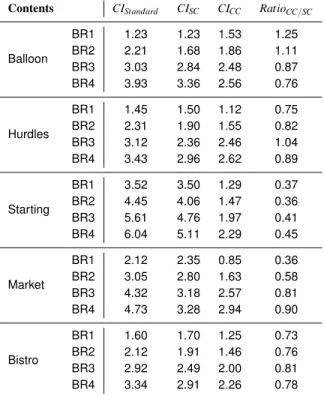
In order to analyze the change in CI, average CI values are reported in Table 1. Since the CI does not change with respect to the color space much, the CI values were averaged for the same bitrate. The last column of Table 1 shows that the CIs are de-creased for almost every case up to 30-60%, especially at higher bitrates where scaling error would instead accumulate in the stan-dard PC. With cross-content comparisons, the CI size becomes more uniform across different levels of quality.
All the results indicate that the scaling of the pairwise com-parison data yields JOD scores that are highly correlated to MOS values acquired in the DSIS experiment. The introduction of cross-content pairs make JOD more uniform, and reduce the con-fidence intervals.
Conclusion
Subjective quality assessment is considered as the most reli-able approach for multimedia quality assessment. Although there are several different methodologies for measuring the subjective quality, pairwise comparison methodology is considered to be one of the simplest, yet most precise, of all the well-known
method-Contents CIStandard CISC CICC RatioCC/SC Balloon BR1 1.23 1.23 1.53 1.25 BR2 2.21 1.68 1.86 1.11 BR3 3.03 2.84 2.48 0.87 BR4 3.93 3.36 2.56 0.76 Hurdles BR1 1.45 1.50 1.12 0.75 BR2 2.31 1.90 1.55 0.82 BR3 3.12 2.36 2.46 1.04 BR4 3.43 2.96 2.62 0.89 Starting BR1 3.52 3.50 1.29 0.37 BR2 4.45 4.06 1.47 0.36 BR3 5.61 4.76 1.97 0.41 BR4 6.04 5.11 2.29 0.45 Market BR1 2.12 2.35 0.85 0.36 BR2 3.05 2.80 1.63 0.58 BR3 4.32 3.18 2.57 0.81 BR4 4.73 3.28 2.94 0.90 Bistro BR1 1.60 1.70 1.25 0.73 BR2 2.12 1.91 1.46 0.76 BR3 2.92 2.49 2.00 0.81 BR4 3.34 2.91 2.26 0.78
Table 1 - Average confidence intervals of the videos with dif-ferent bitrates (BR1 is the highest) for the considered exper-iments. The last column is the ratio of the CI of the com-bined PC data with additional cross-content pairs (CICC, CI of JODCC) to the CI of the combined PC data with additional
same-content pairs (CISC, CI of JODSC). CI of standard PC experiment
(CIStandard, CI of JODStandard) are also reported for completeness.
ologies. The results of pairwise comparison experiments can also be converted to numerical quality scores after a process called scaling.
In this study, we propose to add cross-content comparisons in pairwise comparison methodology to reduce the error accumu-lation that occurs during scaling. We present the results of four different experiments and analyze the effect of the proposed cross-content comparisons. Results show that the scaling performance improves and the confidence intervals reduce when cross-content pairs are introduced.
With the addition of cross-content pairs, pairwise compar-ison methodology can be used effectively for multimedia sub-jective quality assessment instead of direct rating methods which yields MOS values. Pairwise comparison methodology does not suffer from the quality scale difference as does MOS experiments, and JOD score can be used as a more robust representation of sub-jective quality.
Acknowledgments
The work presented in this document was supported by BPIFrance and R´egion ˆIle de France, in the framework of the FUI 18 Plein Phare project. This project has received funding from the European Research Council (ERC) under the European Union’s Horizon 2020 research and innovation programme (grant agreement n◦725253 - EyeCode).
References
[1] N. Ponomarenko, V. Lukin, A. Zelensky, K. Egiazarian, M. Carli, and F. Battisti, TID2008-A Database for Evaluation of Full-Reference Visual Quality Assessment Metrics, Advances of Modern Radioelectronics, 10, 4, pg. 30-45, (2009).
[2] N. Ponomarenko, L. Jin, O. Ieremeiev, V. Lukin, K. Egiazarian, J. Astola, B. Vozel, K. Chehdi, M. Carli, F. Battisti, C.-C.Jay Kuo, Im-age database TID2013: Peculiarities, results and perspectives, Sig-nal Processing: Image Communication, 30, pg. 57-77, (2015). [3] E. Zerman, V. Hulusic, G. Valenzise, R. Mantiuk, and F. Dufaux,
Effect of Color Space on High Dynamic Range Video Compres-sion Performance, 2017 Ninth International Conference on Quality of Multimedia Experience (QoMEX), (2017).
[4] M. H. Pinson, and S. Wolf, Comparing Subjective Video Quality Testing Methodologies, Visual Communications and Image Process-ing, pg. 573-582, (200)3.
[5] T. Tominaga, T. Hayashi, J. Okamoto, and A. Takahashi, Perfor-mance Comparisons of Subjective Quality Assessment Methods for Mobile Video, 2010 Second International Conference on Quality of Multimedia Experience (QoMEX), pg. 82-87, (2010).
[6] D. M. Rouse, R. P´epion, P. Le Callet, and S. S. Hemami, Tradeoffs in Subjective Testing Methods for Image and Video Quality Assess-ment, Human Vision and Electronic Imaging, vol. 7527, (2010). [7] R. K. Mantiuk, A. Tomaszewska, and R. Mantiuk, Comparison of
Four Subjective Methods for Image Quality Assessment, Computer Graphics Forum, 31, 8, pg. 2478-2491, (2012).
[8] P. G. Engeldrum, Psychometric Scaling: A Toolkit for Imaging Sys-tems Development, Imcotek, 2000.
[9] D. A. Silverstein, and J. E. Farrell, Efficient Method for Paired Com-parison, Journal of Electronic Imaging, 10, 2, pg. 394-398, (2001). [10] ITU, ITU-R BT.500-13 Methodology for the Subjective Assessment
of the Quality of Television Pictures, International Telecommunica-tion Union, Technical Report, (2012).
[11] ITU, ITU-R BT.710-4 Subjective Assessment Methods for Image Quality in High-Definition Television, International Telecommuni-cation Union, Technical Report, (1998).
[12] R. A. Bradley, and M. E. Terry, Rank Analysis of Incomplete Block Designs: I. The Method of Paired Comparisons, Biometrika, 39, 3/4, pg. 324-345, (1952).
[13] L. L. Thurstone, A Law of Comparative Judgment, Psychological review, 34, 4, pg. 273, (1927).
[14] J. Lee, F. De Simone, and T. Ebrahimi, Subjective Quality Evalua-tion via Paired Comparison: ApplicaEvalua-tion to Scalable Video Coding, IEEE Transactions on Multimedia, 13, 5, (2011).
[15] K. Tsukida, and M. R. Gupta, How to Analyze Paired Comparison Data, Department of Electrical Engineering, University of Washing-ton, No. UWEETR-2011-0004, Technical Report, (2011). [16] E. Zerman, G. Valenzise, and F. Dufaux, An Extensive Performance
Evaluation of Full-Reference HDR Image Quality Metrics, Quality and User Experience, 2, 1, (2017).
[17] M. Perez-Ortiz and R.K. Mantiuk. A practical guide and software for analysing pairwise comparison experiments. arXiv preprint. arXiv:1712.03686v2 (2017)
Author Biography
Emin Zerman is a PhD student at T´el´ecom ParisTech, France. He received his BSc (2011) and MSc (2013) in electrical and electronics en-gineering from the Middle East Technical University, Turkey. His research interests include High Dynamic Range Imaging, Computer Vision, Video Processing, and Multimedia Quality Assessment.