HAL Id: hal-01950084
https://hal.archives-ouvertes.fr/hal-01950084
Submitted on 13 Dec 2018HAL is a multi-disciplinary open access archive for the deposit and dissemination of sci-entific research documents, whether they are pub-lished or not. The documents may come from teaching and research institutions in France or abroad, or from public or private research centers.
L’archive ouverte pluridisciplinaire HAL, est destinée au dépôt et à la diffusion de documents scientifiques de niveau recherche, publiés ou non, émanant des établissements d’enseignement et de recherche français ou étrangers, des laboratoires publics ou privés.
Revisited model for inward and outward growth of gas
hydrate particles in water-in-oil emulsions
Carlos Lange-Bassani, Ana Cameirão, Herri Jean Michel, Amadeu K. Sum,
Rigoberto E. M. Morales
To cite this version:
Carlos Lange-Bassani, Ana Cameirão, Herri Jean Michel, Amadeu K. Sum, Rigoberto E. M. Morales. Revisited model for inward and outward growth of gas hydrate particles in water-in-oil emulsions. 17th Brazilian Congress of Thermal Sciences and Engineering (ENCIT 2018), FEM-UNICAMP; EESC-USP, Nov 2018, Águas de Lindóia / São Paulo, Brazil. �hal-01950084�
REVISITED MODEL FOR INWARD AND OUTWARD GROWTH OF GAS
HYDRATE PARTICLES IN WATER-IN-OIL EMULSIONS
(as submitted to ENCIT 2018, 17th Brazilian Congress of Thermal Sciences and Engineering, ABCM, November 25th-28th, 2018, Águas de Lindóia, SP, Brazil)
Carlos L. Bassani1,2, Ana Cameirão1*, Jean-Michel Herri1, Amadeu K. Sum3*, Rigoberto E.M. Morales2*
1Mines Saint-Etienne, Univ Lyon, CNRS, UMR 5307 LGF, Centre SPIN, Departement PEG, F - 42023 Saint-Etienne
France
2Multiphase Flow Research Center (NUEM), Federal University of Technology – Paraná (UTFPR), Rua Deputado
Heitor Alencar Furtado, 5000, Bloco N, CEP 81280-340, Curitiba/PR, Brazil
3Hydrates Energy Innovation Laboratory, Chemical and Biological Engineering Department, Colorado School of
Mines, 1500 Illinois St., Golden, CO 80401, USA
*Corresponding authors: cameirao@emse.fr, rmorales@utfpr.edu.br,
Abstract. The correct prediction of the gas hydrate formation rate is important to estimate pipeline blockage
(plugging) in oil and gas production operations. This study presents a revisited model for growth of gas hydrates in water-in-oil emulsions. Literature points out that hydrates form as shells around the water droplets. The water core shrinkage rate (inward growth) is related to gas diffusion through the hydrate shell, while water permeation through the hydrate shell is the limiting phenomenon for outward growth. The models of literature are herein corrected (consideration of gas solubility in the hydrate shell, consideration of gas concentration along the shell coupled with gas consumption in the outer surface, correct coupling between gas absorption by the bulk and gas consumption due to hydrate formation, consideration of the entire particle population for hydrate formation rate, plus minor modeling corrections) and extended for considering the crystal integration process in the outer particle surface and the mass transfer between the particle and the bulk. The model is compared to experimental data and the trend of the gas consumption due to hydrate formation is validated, though model closure is still an open question.
Keywords: flow assurance, gas hydrates, particle growth, mass transfer
1. Introduction
Gas clathrate hydrates are crystals formed by the imprisonment of gas molecules inside cages of water-bonded molecules [1]. Hydrate formation is usually related to high pressure and low temperature conditions, which is often the case of offshore oil and gas production operations. The presence of natural gas and seawater in the pipelines may cause nucleation of those crystals, which may grow and agglomerate causing partial or complete pipeline obstruction, also known as pipe plugging. Plugging due to hydrate formation is considered one of the most challenging flow assurance issues in the oil and gas industry in the last decade [2].
The correct prediction of the hydrate formation rate – with related gas and water consumption rates – is important to assure flow along the pipeline without any partial or complete blockages. Several growth kinetic models have been proposed in literature to estimate the gas hydrate formation rate [see Ribeiro Jr and Lage [3] and Yin et al. [4] for a compilation of kinetic models] whereas fewer of them are predictive models and capable of estimate the particle size evolution in time [5–11]. For gas-oil-water systems, the models are scarce and reduced to growth phenomenon only [7,8]. The kinetic models are said to be apparatus-dependent due to the lack of closure parameters, which are usually micro or meso scale variables of difficult measurement, and therefore all models have a consequent necessity of some sort of curve fitting.
In the present study, the models of Turner et al. [7] and Shi et al. [8] are revisited and extended: (i) the gas solubility in the hydrate shell is considered [12,13]; (ii) the gas concentration distribution along the shell is coupled with the gas consumption in the outer surface, (iii) gas absorption by the bulk is coupled with gas consumption due to hydrate formation [5,6]; (iv) the entire particle population is considered for the hydrate formation rate; (v) and some minor corrections of the literature models are made (use of hydrate properties for growth rates instead of water properties in Gong et al. [9] and Shi et al. [8] and correction of mixed molar and mass basis in Turner et al. [7]).
2. Mathematical model
Water is considered flowing as an emulsion, i.e., small and spherical droplets homogeneously distributed in oil continuous phase [14]. In this kind of system and whenever pressure and temperature conditions are favorable, gas hydrates form as a shell around the water droplets [15], as depicted in Fig. 1(a). The main phenomena associated to growth kinetics of this kind of particle is presented in Fig. 1(b-g). Inner growth is related to gas diffusion through the hydrate shell, which also competes with mass transfer between the particle and the bulk and crystal integration process in the inner surface. The core shrinkage makes water from the core to be expulsed through the hydrate porous shell, thus turning possible crystal integration in the outer surface to happen, with consequent outer growth.
The major assumptions of the model are: (i) the inner and outer surfaces are considered to be at the same temperature as the bulk, although hydrate formation is an exothermic mass change process; (ii) hydrate formation takes place only at the inner and outer surface of the particle, not in the capillaries of the hydrate porous shell; (iii) the hydrate shell is non-deformable; (iv) the particle is spherical; (v) the water expulsion from the water core is due only to core shrinkage, and no capillary-induced flow or head loss in the capillaries are taken into account.
Hydrate is consider to form at a rate proportional to a fugacity (f) driving force relatively to the equilibrium condition (eq.). The local fugacity is transformed to the local concentration by the use of Henry’s constant of the gas in water, defined as HC f [mol/(m3Pa)], where C is the concentration in [mol/m3]. Therefore, the gas consumption
rate due to hydrate formation in [mol/s] comes:
g i i eq i i eq w hyd dn C k A f f k A f dt H (1)where Hw is related to Henry’s constant of the gas inside water, Ai is the interfacial surface of the growing surface and ki
is the constant of proportionality of the crystal integration process (related to the time it takes for the gas and water to form the hydrogen bonds of the hydrate crystalline structure; or yet the time a growth unit takes to be integrated to the already existent crystal structure; Mersmann, 2001). The local concentration C comes from mass transfer modeling.
Gas diffusion along the hydrate shell is modeled by Fick’s Law in spherical coordinates, Eq. (2). The boundary conditions are shown in Eq. (3) and are interpreted as following: (i) the gas diffused through the hydrate shell is consumed by the crystal integration process in the inner surface; and (ii) the gas transferred between the outer surface of the particle and the bulk will be consumed by both inner and outer growth.
2dCh 0 d r dr dr (2) , ,
molar diffusion rate through gas consumption due to crystal the hydrateshell integration in theinner surface
in in h r r h h in i i in i eq w r r C dC D A k A f dr H ; , , , gas consumption molar diffusion rate through gas mass transfer between
due to outer gr the hydrate shell bulk and particle
out out h r r g i h h out i m out i b h r r out C dn dC D A h A C dr S dt owth (3)
where Dh is the gas diffusivity in the hydrate shell, Cb is the gas concentration in the bulk phase, Sh is the gas solubility
inside hydrate in [mol of gas/mol of hydrate for a given pressure], indexes in and out refer to inner and outer surface of the particle and index i refers to one particle only. The gas concentration distribution along the hydrate shell then comes:
Gas
Oil
Water
Hydrate
Gas absoption Mass transfer Water permeability Gas diffusion c r P in dr dt Q K / g h D m h (a) (b) (c) (d) (e) (f) (g)Figure 1. (a) Gas hydrate shell formed around a water droplet in oil continuous phase, which is in contact with the gas free phase. (b) Gas absorption by the bulk competes with gas consumption due to hydrate formation. (c) Gas consumption due to hydrate formation creates a concentration boundary layer around the particle. (d) Gas diffuses through the hydrate shell. (e) Once the gas reaches the inner surface, crystal integration process takes place, causing inner growth. (f) Core-shrinkage makes water to be expulsed through the porous hydrate shell. (g) Once water reaches
the outer surface, crystal integration process happens with consequent outer growth.
2 , 2 2 2 1 1 1 1 4 1 1 1 1 w h g i in in i h h eq h b w eq m out h h w h out in out out m in i H D dn r r r k S C C S C H f h r dt S D H D r r r h r k (4)The gas molar flux through the hydrate shell equals the amount of gas consumed to form hydrates in the inner growth and comes from derivation the concentration distribution, as showed in Eq. (5) (left). Yet knowing that hydrate formation follows the (pseudo)-stoichiometry of 1GH O2
1
Hyd, where is the hydration number and isrelated mainly to the hydrate crystalline structure, then the hydrate formation rate can be related to the gas consumption rate, Eq. (5) (right). The word pseudo-stoichiometry is used because may vary during hydrate growth depending on the occupancy factor of the gas molecules in the water cages, but for simplification purposes is considered constant in this study. Furthermore, the linear growth rate of the inner surface of the particle drin dt is related to the molar
hydrate formation rate, Eq. (6).
, 4 2 in g i h in h r r in dn dC r D dt dr ; h
1
g in in dn dn dt dt (5) , 3 core volume 4 3 h i h in h in dn d r dt M dt , 2 1 4 h i in h h in in dn dr M dt r dt (6)where is the density, M is the molar mass and index h refers to the hydrate phase. It is important to notice that Eq. (6) is corrected from Gong et al. [9] by using the hydrate properties and not the water properties (water properties are mistakenly used when considering that the water core shrinks; while actually it is the hydrate shell that grows inwardly). From Eqs. (5) in (6), the inner growth rate comes:
, 2 2 2 2 1 4 1 1 1 g i h h b w eq m out out in h h in w h in h in out i m out dn S S C H f h r dt dr M dt r H S r D r r k h r (7)This expression is the corrected and extended form of Eq. (3) of Shi et al. [8] considering hydrate properties instead of water, the outer consumption of gas, the mass transfer between the particle and the bulk and the gas solubility inside the hydrate shell. When considering that gas diffusion through the hydrate shell is the limiting factor, that no outer growth happens, that the equilibrium concentration is near zero, Eq. (7) converges to Eq. (12) of Turner et al. [7], where the hydrate molar mass Mh should be used for not mixing molar and mass basis.
Outward growth is limited to water availability in the outer surface, which is in contact with the oil. Shi et al. [8] considered a capillary-induced flow through the hydrate porous shell that drains out water from the core (hydrophilic nature of gas hydrate). However, the consideration of a rigid shell as did by them would imply in not respecting the water mass balance of the water inside the particle core, since the capillary-induced flow is independent on the inward growth. Considering no head loss in the capillaries, the water volumetric flowrate through the hydrate shell is the difference between the core volume shrinkage and the amount of water consumed to form hydrates, which are related to the inner growth rate as:
core w in d d Q dt dt
2 4 1 1 w h in in h w M dr Q r M dt
(8)This expression is only valid if a rigid shell is considered, where capillary-induced flow would quickly stops due to a depressurization of the core and consequent counter-acting force from outside to inside of the core. However, capillary-induced flow may deform the shell and, if a fully deformable shell is considered, then the capillary-induced flow relates to the core volume deformation so as to maintain pressure of inner and outer surfaces. The capillary-induced flow is however dependent on capillary parameters such as radius, tortuosity and density of capillaries, which evolve in time (porous will fill-up with time). Probably the hydrate shell is not fully deformable neither fully rigid and both mechanisms will happen together. To avoid any capillary parameters, the assumption of rigid shell is herein considered.
Once the permeation rate of water through the hydrate shell is known, the gas consumption due to outer growth comes: , min ; 4 2 , g i w out o out i eq w o out dn C Q r k f dt M H (9)
where at the maximum, all the permeated water will be converted into hydrates instantly (assumption of Shi et al., 2010); but if enough water arrives at the particle outer surface, then crystal integration process may limit outer growth. The gas concentration in the outer surface in the oil phase is ,
out
out o hr r h
C C S , and by evaluating Eq. (4) at rrout:
, min ; 4 2 1 1
g i w i i
out out b w eq out w h o eq
w o h o out dn k k Q r k C H f k H S H f dt M H S H (10) 1 2 2 2 1 1 1 1 h in i m out out m w in w h in out i S r k h r k h H r H D r r k (11)
and by considering Eqs. (5) and (6) for the outer radius, the outer growth rate comes:
2
2 1 min ; 4 1 4 out h w i iout out b w eq out w o eq
h w o o out dr M k k Q r k C H f k H H f dt r M H H (12)
Knowing the inner and outer growth rate, Eqs. (7) and (12) (valid for one single particle), the hydrate formation rate of the entire particle population is estimated by Eq. (13). The related gas and water consumption rates comes from the (pseudo)-stoichiometry of hydrate formation and are calculated as shown in Eq. (14).
, , 2 , 2 , , , 4 h i h i out i in i h h out i in i i in out h i dn dn dr dr dn r r dt dt dt M dt dt
(13)
11
g h hyd dn dn dt dt ;
1
w h hyd dn dn dt dt (14)Finally, the gas concentration in the bulk comes from a mass balance between the gas absorbed by the bulk and the gas consumed due to hydrate formation [5,6]:
/ 2 , 2 ,
/ , ,
gas absorption by the bulk gasconsumption due to hydrateformation
1 4 1 g o g o out i in i b h g o b out i in i i o o h k A dr dr dC C C r r dt M dt dt
(15)where kg o is the absorption coefficient of gas by the oil bulk, Ag o/ is the gas-oil interfacial surface, is the volume o of the oil bulk, Cg o/ H fo g is the gas concentration in the gas-oil interface, Ho is Henry’s constant of the gas inside the
oil and fg is the gas fugacity in the gas free phase.
3. Solution method
The model is composed of three ODEs for the inner growth rate (Eq. (7)), the outer growth rate (Eq. (12)) and the bulk concentration (Eq. (15)). This system of ODEs is solved using Runge-Kutta method of 4th order. As initial
conditions, the bulk is considered saturated and the inner and outer radius are considered equal to the droplet radius:
0 , bt t sat o o g C C H f ; 0 0 int t int t droplet r r r (16)
where t is the time step where hydrates nucleated and a hydrate shell of infinitesimal width already contours the t0 water droplet. The water permeation rate, Eq. (8), is evaluated explicitly and is considered zero for the initial value,
0 0 t t
Q . All the particles are considered to be equal and not to agglomerate. Therefore, the sum term of Eq. (15) becomes a multiplication by the number of particles i in the system.
The main difficulty of the presented model is to estimate the closure parameters, which often come from meso or micro scale properties. The interfacial surface between oil and gas Ag o/ can be estimated through gas-liquid flow models (e.g., Taitel and Barnea, 1990). The droplet radius rdroplet can be estimated through liquid-liquid models [14,18].
The equilibrium fugacity of hydrate formation equals the gas fugacity in the equilibrium pressure for the given system temperature,
,eq
eq g T P
f f . The gas fugacity is estimated through an EoS (e.g., Peng-Robinson). The equilibrium pressure for the given pressure is estimated through hydrate equilibrium models [1].
Hydrate properties of common former gases (e.g., methane, ethane) may be found in literature [15,19], but sometimes only an order of magnitude of the parameter exists. Also, hydrate properties may evolve with time due to cage occupancy and hydrate porosity evolution. Gas and water properties are well known in literature. Oil properties may be experimentally measured or estimated through compositional models (e.g., MultiflashTM).
The blocking point are the kinetic parameters. The absorption coefficient of gas by the oil kg o is dependent on the oil composition and the shear rate of the flow, and usually comes from experimentation [5,6,20]. The constant of proportionality of the crystal integration process ki is a micro scale parameter and usually curve fitted from experiments
which are valid when the concentration layers around the particles do not interact among themselves, i.e., the bulk exists – a continuous phase with spatially homogeneous concentration. This is probably the case of dilute flow, and for higher particle fraction in the flow the mass transfer coefficient is expected to decrease.
4. Results and discussions
The model is compared with experimental results from Melchuna et al. [20,21]. They measured the amount of gas consumption due to hydrate formation in a flowloop of 40 m length and 10.2 mm ID. The fluids used were methane, deionized water and Kerdane (a light oil with C11 to C14 composition). The case of 40% water cut and 1.36 m/s of mixture superficial velocity was chosen. The main characteristics of the experiment are shown in Table 1. The values of the closure parameters used for the model evaluation (with the range of magnitude suggested in literature) are presented in Table 2.
Table 1. Characteristics of the experiments of Melchuna et al. [20]. Fluids Methane, deionized water, Kerdane
Water cut 40%
Pressure 80 bar
Temperature 275.5 K
Mixture superficial velocity 1.36 m/s Total liquid volume in the flowloop 10 L
The number of particles i in the system is estimated by the use of the droplet radius and the total volume of water in the system as:
3 3 4 w total droplet droplet WC i r (17)
where WC is the water cut (ratio between volume of water and total volume of the system w total). Factor is
introduced in to represent an efficiency of particles that are actually consuming gas. This efficiency may be related: i. To the amount of droplets that are actually converted to particles.
ii. To the assumption of an average droplet radius (monodisperse) instead of a distribution of droplets with different sizes and therefore different mass transfer resistances (polydisperse).
iii. To the amount of particles that are actually in contact to the bulk, that is, an efficiency due to the impossibility of mass transfer between the particles and the bulk for a dense dispersion and for long distances from the oil-gas surface to the particle.
The presented model converges with the experimental result of Melchuna et al. [20] for an efficiency value of
2.4%
. This low value is probably related to effect iii, since in the experiments of Melchuna et al. [20] the contact surface between oil and gas is restricted to a small region in the top of the riser section (called ‘separator’), whereas the flowloop presents a semi-industrial scale of 40-m length, with a capacity of 10 liters of liquid. This means that probably only the particles inside the liquid volume near the ‘separator’ interacts with the gas-oil interface and grow. Following this idea, only the particles inside the 240 ml of the flowloop near the ‘separator’ are growing, while the rest of the experiment is mostly propagating the slurry flow to capture agglomeration, deposition and plugging tendencies of the oil-water-hydrate flow.
Figure 2 presents the comparison of the proposed model against the experimental data of Melchuna et al. [20] for the evolution in time of the gas consumption due to hydrate formation. The model is capable of representing the experimental results with the order of magnitude of the closure parameters presented in literature (Table 2) and for a curve fitting of 2.4%. Although the model cannot be considered as fully validated (since the curve fitting may mask the omission of important phenomena for hydrate growth or even mistakes during the modeling), the trend of the amount of gas consumption is considered as validated. The trend is composed of an initial faster hydrate formation rate, followed by a decrease in the gas consumption rate and an asymptote trend. This asymptote trend is related to the growth of the hydrate shell and related increase of the diffusion resistance.
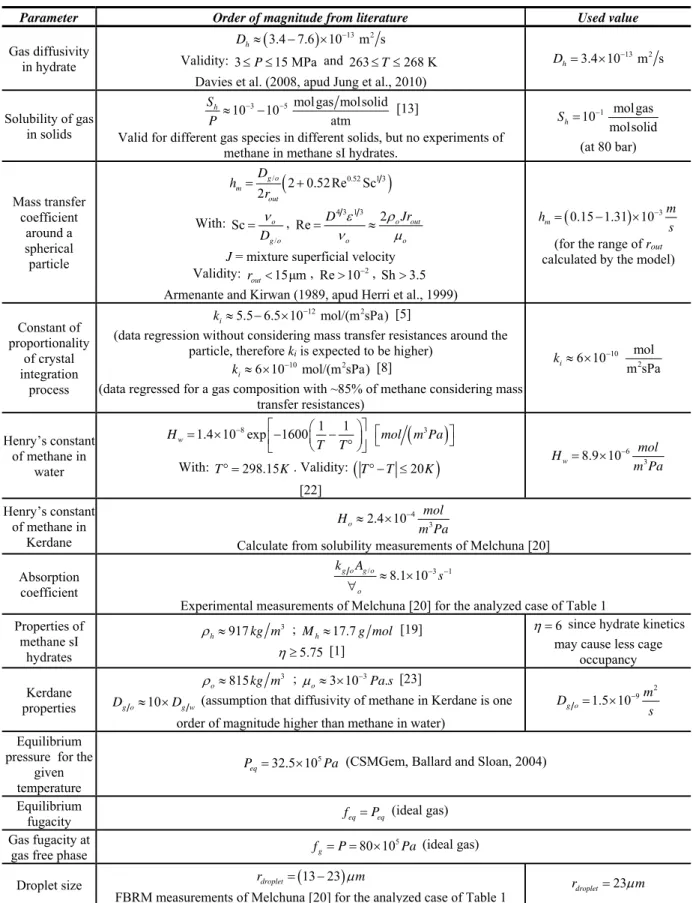
Table 2. Closure parameters used for model evaluation and suggested range of order of magnitude in literature.
Parameter Order of magnitude from literature Used value
Gas diffusivity in hydrate
3.4 7.6 10
13m s2h
D
Validity: 3 P 15 MPa and 263 T 268 K
Davies et al. (2008, apud Jung et al., 2010)
13 2 3.4 10 m s h D Solubility of gas in solids 3 5 molgas molsolid 10 10 atm h S P [13]
Valid for different gas species in different solids, but no experiments of methane in methane sI hydrates.
1 molgas 10 molsolid h S (at 80 bar) Mass transfer coefficient around a spherical particle
/ 2 0.52Re0.52Sc1 3 2 g o m out D h r With: / Sc o g o D , Re 4 3 1 3 2 o out o o D Jr J = mixture superficial velocity
Validity: rout15μm,
2
Re 10 , Sh 3.5
Armenante and Kirwan (1989, apud Herri et al., 1999)
0.15 1.31 10
3 m m h s (for the range of rout calculated by the model)
Constant of proportionality of crystal integration process 12 2 5.5 6.5 10 mol/(m sPa) i k [5]
(data regression without considering mass transfer resistances around the particle, therefore ki is expected to be higher)
10 2
6 10 mol/(m sPa)
i
k [8]
(data regressed for a gas composition with ~85% of methane considering mass transfer resistances) 10 2 mol 6 10 m sPa i k Henry’s constant of methane in water
8 1 1 3 1.4 10 exp 1600 w H mol m Pa T T With: T 298.15K. Validity:
T T 20K
[22] 6 3 8.9 10 w mol H m Pa Henry’s constant of methane in Kerdane 4 3 2.4 10 o mol H m Pa Calculate from solubility measurements of Melchuna [20] Absorption coefficient / 8.1 103 1 g o g o o k A s
Experimental measurements of Melchuna [20] for the analyzed case of Table 1 Properties of methane sI hydrates 3 917 h kg m ; Mh17.7g mol [19] 5.75 [1] 6
since hydrate kinetics may cause less cage
occupancy Kerdane properties 3 815 o kg m ; 3 103 . o Pa s [23] 10 g o g w
D D (assumption that diffusivity of methane in Kerdane is one
order of magnitude higher than methane in water)
2 9 1.5 10 g o m D s Equilibrium pressure for the
given temperature
5
32.5 10
eq
P Pa (CSMGem, Ballard and Sloan, 2004)
Equilibrium
fugacity feqPeq (ideal gas)
Gas fugacity at gas free phase
5
80 10
g
f P Pa (ideal gas)
Droplet size rdroplet
13 23
m0 1000 2000 3000 4000 5000 6000 Time [s] 0 0.1 0.2 0.3 0.4 0.5 0.6 0.7 0.8 0.9 1 A m ount of ga s con su m ed [m ol ]
Experimental data (Melchuna, 2016) Numerical results
Figure 2. Comparison of model results against experimental data of Melchuna et al. [20] for the amount of gas consumed over time due to hydrate formation.
5. Further improvements
The inward and outward growth model of hydrate particles based on gas diffusion through solid is capable of predicting the time scale of hydrate formation only if a high solubility of gas in the hydrate structure is adopted. The value adopted in Table 2 is however optimist, coming from compatible gases inside metal alloys or ceramics at high temperature (e.g., helium in Pyrex at 200oC). This is however not probably the case of methane (a much larger molecule
than helium) inside the hydrate crystalline structure at a temperature where hydrates would form (~ 4oC). Furthermore,
the use of 101
h
S implies in a negative sign for the second term inside the minimum function of Eq. (12), which is not Physically acceptable. This is an indication that the closure parameters are ill-posed. The results of the last section were generated considering the water permeation rate as the limiting step and neglecting the outer crystal integration due to this ill-posed closure.
Literature often mention an effective diffusion of the gas through the solid hydrate structure and through the liquid trapped in the capillaries. However, if ever water is continuously being expulsed through the particle, then the capillaries are filled-up with water. In this case, gas consumption would happen in the capillary walls and inner growth would probably not happen unless: (i) diffusion through the capillaries is much faster than crystallization; or (ii) the shell width is very small, which happens at the beginning of the hydrate formation. If the capillaries are filled-up with oil, then inner growth may happen, but outer growth will not happen.
6. Conclusions
The present article revisited and extended the predictive models for hydrate growth in gas-oil-water systems in literature. The model was compared with experimental data and the trend of gas consumption over time was validated, though closure parameters are still scarce in literature for model implementation in other scenarios then the herein chosen. The model captures the fast initial growth rate of the hydrates, with an asymptotic trend as the hydrate shell imposes higher mass transfer resistances. The mass transfer resistances are associated with gas diffusion and water permeation trough the hydrate shell, which are related to the shell width and therefore increase in time as the shell becomes thicker.
The analysis did in this work further highlights the omission in the use of the gas solubility inside the hydrate solid structure, which may imply in much smaller time scales of hydrate formation than the ones experimentally observed. Furthermore, diffusion through the liquid trapped in the capillaries would imply in either a non-existing shrinking core (if the liquid trapped is water, with consequent crystallization in the capillary walls) or a non-existing outer growth (if the liquid trapped is oil, and therefore water never reaches the outer surface). Although the inward and outward growth model explains the asymptotic trend of hydrate formation due to mass transfer limitation, future work shall analyze the mass transfer and crystallization inside of the capillaries of the hydrate porous structure.
Acknowledgements
The authors acknowledge the financial support of Région AURA Auvergne Rhône-Alpes through the project COOPERA FluEnergy and TE/CENPES/PETROBRAS.
References
[1] E.D. Sloan, C.A. Koh, Clathrate hydrates of natural gases, 3rd ed., Taylor & Francis Group, Boca Raton, USA, 2008.
[2] C.A.B.R. Cardoso, M.A.L. Gonçalves, R.M.T. Camargo, Design options for avoiding hydrates in deep offshore production, J. Chem. Eng. Data. 60 (2015) 330–335. doi:dx.doi.org/10.1021/je500601f.
[3] C.P. Ribeiro Jr, P.L.C. Lage, Modelling of hydrate formation kinetics: State-of-the-art and future directions, Chem. Eng. Sci. 63 (2008) 2007–2034. doi:10.1016/j.ces.2008.01.014.
[4] Z. Yin, Z.R. Chong, H.K. Tan, P. Linga, Review of gas hydrate dissociation kinetic models for energy recovery, J. Nat. Gas Sci. Eng. 35 (2016) 1362–1387. doi:10.1016/j.jngse.2016.04.050.
[5] P. Englezos, N. Kalogerakis, P.D.D. Dholabhai, P.R.R. Bishnoi, Kinetics of formation of methane and ethane gas hydrates, Chem. Eng. Sci. 42 (1987) 2647–2658. doi:10.1016/0009-2509(87)87015-X.
[6] J.M. Herri, J.S. Pic, F. Gruy, M. Cournil, Methane hydrate crystallization mechanism from in-situ particle sizing, AIChE J. 45 (1999) 590–602.
[7] D.J. Turner, K.T. Miller, E. Dendy Sloan, Methane hydrate formation and an inward growing shell model in water-in-oil dispersions, Chem. Eng. Sci. 64 (2009) 3996–4004. doi:10.1016/j.ces.2009.05.051.
[8] B.H. Shi, J. Gong, C.Y. Sun, J.K. Zhao, Y. Ding, G.J. Chen, An inward and outward natural gas hydrates growth shell model considering intrinsic kinetics, mass and heat transfer, Chem. Eng. J. 171 (2011) 1308–1316.
doi:10.1016/j.cej.2011.05.029.
[9] J. Gong, B. Shi, J. Zhao, Natural gas hydrate shell model in gas-slurry pipeline flow, J. Nat. Gas Chem. 19 (2010) 261–266. doi:10.1016/S1003-9953(09)60062-1.
[10] B. V. Balakin, S. Lo, P. Kosinski, A.C. Hoffmann, Modelling agglomeration and deposition of gas hydrates in industrial pipelines with combined CFD-PBM technique, Chem. Eng. Sci. 153 (2016) 45–57.
[11] T.P. Sampaio, F.W. Tavares, P.L.C. Lage, Non-isothermal population balance model of the formation and dissociation of gas hydrates, Chem. Eng. Sci. 163 (2017) 234–254. doi:10.1016/j.ces.2016.12.012. [12] R.B. Bird, W.E. Stewart, E.N. Lightfoot, Transport Phenomena, 2nd ed., John Wiley & Sons, 2002.
[13] R.M. Barrer, Diffusion in and through solids, 1st ed., The Cambridge Series of Physical Chemistry, Cambridge, 1941.
[14] N. Brauner, The prediction of dispersed flows boundaries in liquid-liquid and gas-liquid systems, Int. J. Multiph. Flow. 27 (2001) 885–910.
[15] D. Sloan, C. Koh, A.K. Sum, Natural gas hydrates in flow assurance, 1st ed., Elsevier Inc., Burlington, USA, 2011.
[16] A. Mersmann, Crystallization Technology Handbook - Second Edition Revised and Expanded, 2nd ed., Marcel Dekker Inc., New York, 2001.
[17] Y. Taitel, D. Barnea, A consistent approach for calculating pressure drop in inclined slug flow, Chem. Eng. Sci. 45 (1990) 1199–1206. doi:10.1016/0009-2509(90)87113-7.
[18] D.J. Turner, K.T. Miller, E.D. Sloan, Direct conversion of water droplets to methane hydrate in crude oil, Chem. Eng. Sci. 64 (2009) 5066–5072. doi:10.1016/j.ces.2009.08.013.
[19] J.W. Jung, D.N. Espinoza, J.C. Santamarina, Properties and phenomena relevant to CH4-CO2 replacement in hydrate-bearing sediments, J. Geophys. Res. Solid Earth. 115 (2010) B10102. doi:10.1029/2009JB000812. [20] A.M. Melchuna, Experimental study and modeling of methane hydrates crystallization under flow from emulsions
with variable fraction of water and anti-agglomerant, École Nationale Supérieure des Mines de Saint Étienne, 2016.
[21] A. Melchuna, A. Cameirao, J.M. Herri, P. Glenat, Topological modeling of methane hydrate crystallization from low to high water cut emulsion systems, Fluid Phase Equilib. 413 (2016) 158–169.
doi:10.1016/j.fluid.2015.11.023.
[22] R. Sander, Compilation of Henry’s law constants for inorganic and organic species of potential importance in environmental chemistry, Mainz, Germany, 1999.
[23] Total, Kerdane D 75: Safety Data Sheet, 2015.
[24] A.L. Ballard, E.D. Sloan, The next generation of hydrate prediction IV: A comparison of available hydrate prediction programs, Fluid Phase Equilib. 216 (2004) 257–270. doi:10.1016/j.fluid.2003.11.004.

![Table 1. Characteristics of the experiments of Melchuna et al. [20].](https://thumb-eu.123doks.com/thumbv2/123doknet/12178325.314208/7.892.219.672.405.520/table-characteristics-experiments-melchuna-et-al.webp)
![Figure 2. Comparison of model results against experimental data of Melchuna et al. [20] for the amount of gas consumed over time due to hydrate formation](https://thumb-eu.123doks.com/thumbv2/123doknet/12178325.314208/9.892.244.650.126.433/figure-comparison-results-experimental-melchuna-consumed-hydrate-formation.webp)
