People's Democratic Republic of Algeria Higher Education Ministry And Scientific Research University of El-Chahid Hamma Lakhdar- El-Oued
Faculty of Natural Sciences and Life Department of Cellular and Molecular Biology
Master's Memory
In order to obtain a diploma of an Academic Master In Biological Sciences
Specialty: Applied Biochemistry
Theme
Presented by:
CHIHANI Basma
DJABALLAH Chaima
June 20th, 2019
President: Dr.LAICHE Omar Touhami M.C.B. EL-Oued University Supervisor: Dr. DEROUICHE Samir M.C.A. EL-Oued University Examiner: Mm.BOUKHARI Dalel M.A.A. EL-Oued University
2018/2019
Study of risk factors and some biochemical, hematological,
hormonal and oxidative stress markers to predict and follow up of
Dédicace
Á la lumière de mes jours, la source de mes efforts, la
flamme de mon cœur, ma vie et mon bonheur, Maman que
j'adore.
Á mon exemple éternel, ma source de joie et de bonheur,
celui qui s'est sacrifié pour me voir réussir, à toi mon père.
Á ce que j'aime beaucoup et qui m'ont encouragé tout au long
de mon travail, mes soueurs Maroua et Safa, et mes chers frères
Houssam et Ziad.
Á tous les membres de ma famille, petits et grands.
Á touts mes enseignants et enseignantes de l’école primaire
jusqu’à l’université.
Á mon professeur, mon encadreur Dr.Derouiche Samir.
Aucune dédicace ne saurait exprimer l’estime, le dévouement et
le respect que j’ai toujours eu pour vous. Je ne peux trouver les
mots justes et sincères pour vous. Sans ton aide, tes conseils et
tes encouragements ce travail n'aurait vu le jour.
ءاذٌلإا
شٍظلا ذىس لىإ.... يمأ ناىلحا عبو لىإ
للها امكظفح...يبأ
للها مكاعس.. ناُضسَ يرشب ّيُخأ لىإ..ِششبَ ءافش، ّيتخأ لىإ
للها ًحمس يولايلجا يخأ، اٍبس ساُج لىإ اىتقساف تبيط حَس لىإ
يرسم شيَسد يراتسأ، ذِج
ُ
لما، هقتلما، صلخلما لىإ
اشكش ثاملكلا كيفُت هل..
..يئاقذصأ لك لىإ
تىح ّيلع لضفلا ًل ناك هم لك لىإ
تظظللا يزهذ ي ُصَ
تعضاُتلما ةشكزلما يزٌ أشقي هم لك لىإ
ءاميش
Acknowledgment
The first thanks to ALLAH Almighty for giving us strength, patience and conciliation in order to finish our thesis.
We would like to express our special appreciation and very big thanks to our supervisor Dr. DEROUICHE Samir, for all the support and encouragement he gave us during these months. His friendly guidance and expert advice has been invaluable throughout all stages of the work. We have been extremely lucky to have a supervisor who cared so much about our work, and who responded to our questions at any time.We also express our gratitude for his moral support.
We would like to thank our thesis committee: Dr.LAICHE Omar Touhami, who has given us the honor to accept the presidency of this thesis, respectful tribute, and Mm. BOUKHARI Dalel, for having agreed to examine our thesis and the honor for her presence, permit us to express to her our deep respect. We feel proud and honored that you have accepted to be on our committee.
We would like to thank Miss GOUBI Sana, responsible of laboratory, Madame REZZAG MOHCEN Bouchra, Laboratory Technicians for helping us and providing us with everything we need and all the necessary facilities for our research.
We also thank the members of the BEN OMAR DJAILANI Hospital, Hospital of 8 MAY, 19 MARCH hospital and BACHIR BEN NASSER Hospital in El-Oued, and hugely appreciative to AMMARI Noureddine Director of Elbeyene Labo for medical analysis and blood diseases, and FARTOUL N's clinic and its members and Labo for fine analysis in Tunisia for their services and facilities for our work.
Our very special thanks go to our dearest and best friends: Aouatef and Achouak, for our encouragement and assistance to us throughout our work, also big thanks to Mm. BELLABACI Djaouida, Mr. DJABALLAH Abdelkader and CHIHANI Said, and special thanks to our friends Zaineb.
Finally, we would like to thank everyone who helps us to complete this thesis, we really appreciate that.
Abstract:
Gestational Diabetes Mellitus (GDM) is one of the most common pregnancy complications, has increased by more than 30 (%) within one or two decades in a number of countries forming an emerging worldwide, the aim of our work is to evaluate some risk factors and biological markers and stress oxidative status for determining some predictive factors of GDM in patients of El Oued region. Our socioeconomic risk factors study was conducted on 140voluntary women divided into70 healthy women, mean age
760.0 ±
546.82 years and 70 GDM patients mean age .86..4±760.. years. For biological study, we have selected 15 healthy control mean age 27.67±1.77years and 15 women GDM patients mean age 34.64.± 1.03 years. Some biochemical, hematological, trace elements, hormonal and oxidative stress markers were analyzed in our study.
The results of risk factors study illustrate the high relationship between some socioeconomic comportments such as passive smoking, social problems and clinical factors such as obesity, contraceptive pills and gestational diabetes, but family history and chronic disease are the most dangerous risk factors, (OR =58.10, OR =33.22) respectively, for GDM. While sports and daily activity are important protective factors against this disease. For biological study, our results reveal a significant change (P<0.05) of hematological, biochemical, hormonal, oxidative stress and some minerals markers in GDM patients as compared to control, with a significant (P 0.05) relationship between the changes of both thyroid hormones (T3 and TSH) and the oxidative stress markers ( MDA , CAT and ORAC) on the one hand and the changes in levels of serum zinc and serum copper and the level of oxidative stress in both GDM with and without pregnancy on the other6From this study we found that some of oxidative stress markers have a high sensitivity, specificity and AUC values which qualify them to be important markers for diagnosing and predicting Gestational diabetes disease in women.
Finally, we conclude that there are a most socioeconomic and clinical risk factors and predictive factors for GDM disease. Also a change in the serum level of thyroid hormones and the level of mineral elements in relation with oxidative stress of women with gestational diabetes contributes to the development or complication of the disease after pregnancy.
:صخلملا
ٌ ءاد ربتع يركس نم ربكأ ةبسنب داز دقف، اعوٍش لمحلا تافعاعم رثكأ لمحلا .7 نٌدوقع عأ دوقع ووعغ ًف % ل نم ددع لاوعلا ًوف ةةوشانلا ادلبلا 6 نف وٍلعع اونلمع نوم دوهلا ااوه ، رو ،لا لوماوع طوعب ٍوٍقق ووه طوعب روٍغق رٌٍاعملا ع ةٍجولوٍبلا رٌٍاعم لماوع طعب دٌدحتل يدسكأتلا داهجلإا ا ااه ؤبنق ىظرمل ءادل نم 6يداولا ةق نم ةوووساةد اووونٌرجأ دوووٌدحق ىووولع رووو ،لا لوووماوع .87 أروووما ىووول نموووسن ةوووعو تم 07 ػوووسوتم طدهاووووهكو ةمٍلوووس نهرومع 546.82 ± 760.0 ةنوس ع 07 أروما نهرومع ػوسوتم لومحلا يركوس ءادوب ةباوصم .86..4 ± 760.. ةنووس ع ا تاروٍغق ةساةدل او رترا ةوٍجولوٍبلا تاروشؤمل .2 أروما تمب دهاوش رومع ػوسو 1.77±27.67 نوس ة ع .2 أروما رمع ػسوتمب ضرملا ااهب ةباصم ±34.64 .67. ةنس 6 ، ةوٍنةدلا دوغلا تاو ومره، ،دولا تاو وكمل لٍلاحق ءارج ق يدسكأتلا داهجلإا لماوعع داعم ضرملا ٍٍقتل ةٍجولوٍب رٌٍاعمك لمعلا ااه ًف 6 ًبلووسلا نٍردووتلا لووثم ةٌداووصتنةاع ةووٍعامتجةا لووماوعلا نٍووب اووٌون اووغابقةا روو ،لا لووماوع ةووساةد اراووت نووظوق لووماوعلاع ةووٍعامتجةا لكاووهملاع ةٌرٌرووسلا ، ةنمووسلا لووثم عاوونق ةوومعادم لوومحلا حوونم موووبح نٍووبع ةباووصلإا ووب ءاد نوووووووكل، لووووووومحلا يركوووووووس ل ضروووووووعتلا ع ةووووووونمسملا ضاروووووووملأ ً اةوووووووولا لوووووووماعلا ه اوووووووم رووووووو رلأا ةووووووومٍقب و OR=58.10;OR=33.22 ط أ نٍووح ًووف6 ًلاوووتلا ىوولع ةووسةامم ةووظاٌرلا ةووٍكرح ع اووس لإا ووٍموٍلا ة ماووع ضرملا ااه نم ةٌامحلل امهم اراتنلا بسح امراد 6 ةساةدل ةبسنلاب رٌٍاعملا ةٍجولوٍبلا لمحلا يركس ىظرم دنع تاو وكم ًوف روٍبك روٍغق غعدوح ىول اونجرات رٍهق، ووعملا، ،دوولا ةووٍ ومرهلا، ةووٍراٍمٍكوٍبلا رٌٍا ع يدووسكأتلا داووهجلإا تارووشؤم ةٍووساسلأا داووعملا طووعب ضوتووسم ًووفع حوم دهاووهلاب ةو ةاقم لمحلا يركس ءاد ىظرمل دووجع ىول ةاوشلإا غاوبقةا و يوونعم P˂0.05 نٍوب ةون علا ًوفط مار وظا ةوٍنةدلا دوغلا تاو ومره ( T3, TSH ط ةووهظع يدوسكأتلا داوهجلإا وMDA, CAT, ORAC نوم ط ،ةووٍحا نٍووب اووعٌأع رووٍغق رووصنع تاٌوتووسم ًووف يدووسكأتلا داووهجلإا ضوتووسمع لووصملا ًووف شاووحنلاع ووو سلا دوونع ا تاباصمل ضرملاب لماوحلا نهنوم 6ضرورأ ةوٍحا نوم لوماوحلا روٍغع ًوف ةوساةدلا اوه أ اونظحة اوعٌ أ طوعب ةٍووصوصرع ةووٍلاع ةٍووساسح اووهل يدووسكأتلا داووهجلإا لووماوع رووٍبك ع لهؤق ًووتلا وووكتل اووه رٌٍاووعم ا ٍ،ووهتل ةوومهم ركس ضرم ي 6 ب ؤبنتلاع لمحلا ر ،لا لماوع نم دٌدعلا دجوٌ ،ةٌاهنلا ًف كولوسلاب اوساسأ ةقلعتملا ٍ لوماوحلا ءاوسنلا اوٍح ةوقٌرغع ةوٍعامتجةا تا ىلع ا دكأ امك رٌٍاوعملا طوعب ةعد زارب تاو ومرهلا ًوف روٍغتلا اوعٌأ، لومحلا يركوس ءادول ةوٌؤبنتلا وصانعلا ع ر ةٍ دعملا ىظرملا ءاسنلل يدسكأتلا داهجلإاب ةن ع ل ًتلاع عأ ءادولا ااوه ةو تل يدؤق ةووهظ قافعاوعم أ ءاون أ ع 6 لمحلا دعب ةيحاتفملا تاملكلا : ءاد ،يدسكأق داهج ،ر ر لماوع، لمحلا يركس و ز، ةٍنةدلا دغلا تا ومره , شاح 6
Summary
Dedicace Acknowledgment Abstract Summary Figures list Tables list Abbreviation list Introduction First part: Theory partI. Diabetes mellitus 04
I.1. Definition 04
I.2. Classification 04
I.2.1. Diabetes mellitus type 1 04
I.2.1.1. Definition 04
I.2.1.2. Pathophysiology 04
I.2.2. Diabetes mellitus type 2 04
I.2.2.1. Definition 04
I.2.2.2. Pathophysiology 05
I.3. Other types of diabetes 05
I.4. Diabetes treatment 06
I.5. Prevention 06
II. Pregnancy and Gestational diabetes 06
II.1. Pregnancy 06
II.1.1. Definition 06
II.1.2. Placenta 06
II.1.3. Physiological changes during pregnancy 06
II.1. 4. Pregnancy and hematological markers 07
II.1.5. Hormonal changes during pregnancy 07
II.1.6. Trace elements change during pregnancy 08
II.1.8. Complications during pregnancy 10
II.2. Gestational diabetes (GDM) 10
II.2.1. Definition 10
II.2.2. Symptoms 11
II.2.3. Diagnostic 11
II.2.4. Pathophysiology of GDM 12
II.2.5. Complications 12
II.2.5.1. For mother 12
II.2.5.2. For baby 12
II.2.6. GDM and hormonal system 13
II.2.6.1.GDM and thyroid hormones 13
II.2.6.2. Insulin resistance in normal pregnancy and with GDM.
13 II.2.6.3. Relationship between β-cell dysfunction, insulin
resistance and GDM
15
II.2.7. Treatment 16
II.2.8. Prevention 16
II.2.9. Development of Gestational Diabetes 16
III. Oxidative stress 16
III.1. Definition 16
III.2. Free radicals 17
III.3. Sources of free radicals 17
III.3.1.Endogenous sources of ROS 17
III.3.2.Exogenous sources of ROS 17
III.4. Antioxidants 18
III.5. Oxidative stress and pregnancy 19
III.6. Oxidative stress and GDM 20
Second part: Experimental part Meterials & Methods
I.1. Patients and reagents 24
I .1.1. Study period 24
I.1.2. Risk factors study 24
I.1.4. Reagents 24
I.2. Methods 25
I.2.1. Collection of data 25
I.2.1.1. Sample collection 25
I.2.2. Biochemical parameters assay 25
I.2.3. Hormonal parameters assay 25
I.2.4. Method of hematological analysis 25
I.2.5. Method of estimating oxidative stress parameters 25 I.2.5.1. Preparation of erythrocyte homogenate 25
I.2.5.2. Leukocyte separation 26
I.2.5.3. Collect saliva 26
I.2.5.4. Determination of leukocyte protein concentration 26
I.2.5.5. Determination of catalase activity 26
I.2.5.6. Determination of Reduced glutathione (GSH) level 27 I.2.5.7. Measuring of total antioxidant capacities (ORAC) 28
I.2.5.8. Malondialdehyde (MDA) assay 29
I.3. Statistical analysis 29
Results & Discussion
I. Results 31
I.1. Study of risk factors of gestational diabetes 31
I.1.1. Description of study population 31
I.1.2. Study of socioeconomic and clinic factors 32 I.2. Study of biological markers and predictive factors 35
I.2.1 Hematological markers 35
I.2.2. Biochemical markers 35
I.2.3.Trace elements level 36
I.2.4. Hormonal markers 37
I.2.5. Oxidative stress markers 37
I.2.6. Correlation between biological markers 38
I.2.7. Predictive factors study 40
II. Discussion 42
References Annexes
Figures list
N° Figure title Page
01 Difference between diabetes type I and II 05
02 Mechanism of insulin resistance in GDM 14
03 Relationship between β-cell dysfunction, insulin resistance, and GDM
15 04 Endogenous and exogenous sources of free radicals 18
05 Classification of antioxidants 19
06 ROC Curve for oxidative stress markers in not pregnant women(A) and in pregnant women (B)
Tables list
N° Table title Page
01 Thyroid function in pregnancy 08
02 Calories, calcium , folate and iron recommendations for pregnant women
10
03 The results of diagnostic diabetes 11
04 Main oxygen reactive species and its performances 17
05 Description of study population 31
06 Comparison of the socioeconomic features of gestational diabetes patients and control (N=140)
32 07 Comparison of the clinic pathological of gestational diabetes
patients and controls ( N=140)
33 08 Hematological parameters in control women and women
with gestational diabetes
35
09 Biochemical parameters in control and women with gestational diabetes
36
10 Trace elements in serum of control and women with GDM 36 11 Hormonal thyroid markers of control women and women
with gestational diabetes
37 12 Oxidative stress parameters in blood of control women and
women with gestational diabetes
37 13 Oxidative stress parameters in saliva of control women and
women with gestational diabetes
38 14 Correlation between biological markers for not pregnant
women
39 15 Correlation between biological markers for pregnant women 40 16 Sensitivity, specificity and AUC values of some oxidative
stress markers in no pregnant women
41 17 Sensitivity, specificity and AUC values of some oxidative
stress markers in pregnant women
ALP: Alkaline phosphatase. AUC: Area under curve.
BHT: Butylated hydroxytoluene. BMI: Body mass index .
CAT: Catalase.
CuSO 4: Copper sulphate.
CuZn SOD: Copper-zinc super oxide dismutase. DNA: Deoxyribonucleic acid6
DTNB: 5,5′-Dithiobis(2-nitrobenzoic acid) . EDTA: Ethylene diamine tetraacetic acid. ERS: Endoplasmic reticulum stress FFA: Free fatty acid.
FHD: Family history of diabetes mellitus FNS: Hematological analysis6
GDM: Gestational diabetes mellitus. GLUT4:Glucose transporter type 4 GSH: Reduced Glutathion.
GSH-Px: Glutathione peroxidase H 3 PO 4:Phosphoric acid.
H2O2: Hydrogen peroxide
H2SO4: Sulfuric acid
Hcg: Human chorionic gonadotropin. HCl: Hydrochloric acid.
Hct: Hematocrit.
HDL: High density lipoprotein. Hgb: Hemoglobin.
HNF4A: Hnuclear factor 4 alpha
HNO 3: Nitric acid.
ID: Iron deficiency.
IDA: Iron deficiency anemia. IGF-1: Insulin-like growth factor 1. JNK: c-Jun N-terminal kinase. KH₂PO 4: Phosphate-buffered6
LDL:Low density lipoprotein. LYM: Lymphocytes.
MDA: Malondialdehyde. NaCl: Sodium Chloride. NO: Nitric oxide.
OGTT: Oral glucose tolerance test. OR: Odd Ratio.
ORAC: Oxygen radical absorbance capacity. OS: Oxidative stress.
P-IRE-1α: Phosphorylation of inositol-requiring enzyme 1α. PLT: Platets.
P-Ser-IRS-1:Insulin receptor substrate 1 at serine307. RBC: Red blood cell.
ROS: Reactive oxygen species. SHS: Second-hand smoke. T3: Triiodothyronine.
T4: Thyroxine.
TBA: Thiobarbituric acid. TBG: Thyroid binding globulin. TCA: Trichloroacetic acid. TG: Triglyceride.
TH: Thyroid hormone.
TNF: Tumour necrosis factor. TSH: Thyroid stimulating hormone. VLDL: Very low density lipoprotein. WHO: World Health Organization. Zn (O 2 CCH 3 ):Zinc nitrat .
Introduction
Pregnancy is a period of rapid growth and cell differentiation for both the mother and fetus( Al-Jameil et al., 2014), the pregnant woman presents a diagnostic challenge as physiological ; anatomical and biochemical changes of pregnancy may mask symptoms and signs, as well as the pregnancy itself being the source of the problem (Graham et al., 2015). Acute complications of pregnancy can appear in all trimesters, their diagnosis and management are great challenges factors affecting pregnancy outcome are socioeconomic status, smoking status and other health related conditions and behaviors (Khaskheli et al., 2010). Pregnancy induces changes in maternal glucose metabolism and insulin sensitivity, pregnant women are able to meet the increased insulin demand, but in some cases these needs are not met resulting in poor glycemic control and consequently GDM (Shelley et al., 2014).
Gestational Diabetes Mellitus (GDM) is a non-communicable disease affecting pregnant women (Ferrara, 2007). Globally the median estimates of GDM range from 6 to 13% (Zhu & Zhang, 2016).In Algeria, statistics 2015 show that 6 % of pregnant women have gestational diabetes, with national data showing that of 100 pregnant women, 6 are diagnosed with gestational diabetes, which requires early diagnosis and accurate medical follow-up to avoid complications. Until now , there is not any directly cause of GDM but several risk factors are introduced as causative factors of developing gestational diabetes mellitus such as advanced age (≥35 yrs.), overweight or obesity, family history of diabetes (Larrabure et al., 2018),excessive gestational weight gain, excessive central body fat deposition, short stature (<1.50 m), excessive fetal growth, hypertension or preeclampsia in the current pregnancy, and polycystic ovary syndrome (Renata et al., 2015). GDM is a substantial and growing health concern in many parts of the world has serious, long-term consequences for both baby and mother (Reece et al., 2009),including increased risk of miscarriage, stillbirth, preterm delivery, congenital malformations, fetal macrosomia, neonatal hypoglycemia, obesity and insulin resistance in women and childhood, followed by impaired glucose tolerance and type 2 diabetes later in life (Byrn & Penckofer, 2013; Rasmussen & Harlow , 2010).
Many studies have suggested that the cause of progression GDM is the oxidative stress (Sudharshana et al., 2018) that reported increased free radical production and antioxidant depletion in gestational diabetes to be a causative factor in increasing the risk of
congenital anomalies and some investigators have reported increased lipid peroxidation and significant depletion in antioxidant capacity during the development of gestational diabetes (Vida& Zamzam, 2017).
In light of these data, the aim of our work is based on the realization of two following complementary aspects:
The first part: is to study the risk factors associated with gestational diabetes that several types of factors are studied in this context: socioeconomic, environmental and clinical factors.
The second part: is an biological study concerns the determination of the variation and specificity of some biochemical, hematological and oxidative stress markers in the prediction and diagnosis following up on gestational diabetes and finally to study the relationship of mineral and hormonal metabolism dysfunction with gestational diabetes as an agent of initiation or progression of this disease in women of El-Oued population.
First part
3 I. Diabetes mellitus:
I.1. Definition:
Diabetes mellitus is a group of metabolic diseases characterized by chronic hyperglycemia , resulting from a deficiency in secretion or the action of insulin or both related (Drouin et al., 1999;Anuradha et al.,2015). Insulin which is produced in β-cells is a critical regulator of metabolism ( Zhuo et al., 2014). The chronic hyperglycemia of diabetes is associated with longterm damage dysfunction, and failure of different organs, especially the eyes, kidneys, nerves, heart, and blood vessels (ADA ,2009).
I.2.Classification:
I.2.1. Diabetes mellitus type 1: I.2.1.1.Definition:
Type 1 diabetes (T1DM, formerly insulin-dependent diabetes) an autoimmune disease that destroys beta cells in the islets of Langerhans in the pancreas (Lepercq 2007).Resulting an insulin deficiency, which causes the symptoms of hyperglycemia as thirst, weight loss involuntary and fatigue abdominal pain (Rachel,2019). T1D is one of the endocrine and metabolic conditions occurring in childhood (Anastasia et al., 2017). About 10% to 15% of people with diabetes have type 1 diabetes (AMA, 2015).
I.2.1.2. Pathophysiology:
There are several risk factors of type 1 diabetes, but the main of its include:
Family history: Parent or sibling with type 1 diabetes increases the risk of a person having the same type, and the risk is even higher when both parents have type 1 diabetes.
Genetics: Specific genes may increase the risk of type 1 diabetes.
Viral infections: Certain viruses may trigger the development of type 1 diabetes by causing the immune system to turn against the body such as decoxavirus.
Race/ethnicity: Certain ethnicities have a higher rate of type 1 diabetes.
Geography: The people who live in northern climates are at a higher risk for developing type 1 diabetes (Daphne & Pharm , 2015 ;Stavroula et al., 2018).
I .2.2.Diabetes mellitus type 2: I .2.2.1.Definition:
Type 2 diabetes (T2DM, non-insulin-dependent diabetes) is the consequence of insulin resistance poorly compensated by abnormal insulin secretion (Lepercq, 2007).
4
Insulin secretion due to a deficiency in β cells of the pancreas and a decrease in the effect of intestinal hormones stimulating postprandial secretion of insulin whose pathophysiological elements include increased resistance of peripheral tissues (liver, muscles, adipose tissue) to the action of insulin (Tripathy &Chavez, 2010). It represents 85% to 90% of all cases of diabetes (AMA, 2015), concerned mostly individuals over the age of 45 years (Jennifer,2019).
I.2.2.2. Pathophysiology:
Type 2 diabetes is a common chronic disease resulting from a complex inheritance-environment interaction along with other risk factors (Yanling et al.,2014) as age, high blood pressure, a low level of HDL (good) cholesterol, or a high level of triglycerides (Hannele, 2011), overweight or obese , a family history has been linked with increased risk for type 2 diabetes mellitus, and physical inactivity identify those individuals at highest risk (Fletcher et al., 2014). T2DM is a silent epidemic of increasing proportions (Moshe et
al., 2015).
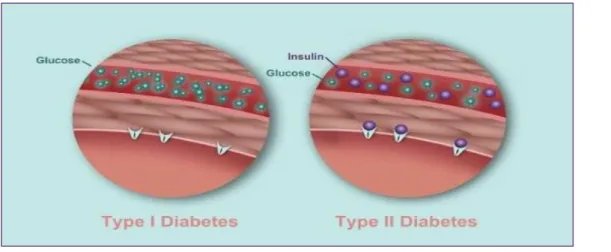
Figure 01 : Difference between diabetes type I and II (Chris , 2017).
I.3. Other types of diabetes:
There are other specific diabetes types as :genetic defects of insulin action, diseases of the exocrine pancreas (e.g. pancreatitis, cystic fibrosis), endocrinopathies (e.g. acromegaly , pheochromocytoma), drug induced (e.g.glucocorticoids, neuroleptics ),genetic defects of the β-cell function (e.g. MODY forms) and gestational diabetes that glucose tolerance impairments when first appear or are first diagnosed during pregnancy (Kerner & Brückel, 2014).
5 I.4. Diabetes treatment:
The major goal in treating diabetes is to control blood sugar (glucose) levels within the normal range, with minimal excursions to low or high levels. Diabetes is treated with: Diabetes medications (oral) or injected insulin, weight reduction by diet and sport exercises (Robert, 2018).
I.5. Prevention:
Eat healthy foods: more vegetables and fruits, less carbohydrates, fats, sugars and salts; exercise regularly: At least 30 minutes of brisk walking every day will do you good ;take the stairs, not the lift; don’t board a vehicle (Hanaire & Picard,2003);encourage children to have daily physical exercises; avoid smoking and alcohol, It’s good to know you are healthy; visit your nearest health facility for checkups for diabetes. Early diagnosis and proper treatment prevent complications of diabetes ( William et al., 2012).
II. Pregnancy and gestational diabetes:
II
.1.Pregnancy:II
.1.1.Definition:Pregnancy also known as gestation or gravidity is an event inducing many physiological changes in the mother, in which an embryo(s) implants into maternal uterus and subsequently develops into a fetus (David et al., 2018). Pregnancy starts at conception, when an ovum is fertilized by a spermatozoon to form a zygote, and ends in childbirth, abortion or miscarriage (Azab et al., 2017 ; Eledo et al., 2015). Normal pregnancy last 40 weeks from last menstruation or 38 weeks from conception date (Melissa,2019). These modifications in the mother as well as the intrauterine development of the fetus, require a lot of energy and these needs increase with the progress of the pregnancy (Marey , 2017).
II
.1.2.Placenta:The placenta is a complex organ situated at the interface between mother and foetus that separates maternal from foetal blood. The placental surfaces exposed to the two bloodstreams are different trophoblasts and endothelial cells are in contact with the maternal and foetal circulation respectively (Hiden et al., 2006).
II.1.3. Physiological changes during pregnancy:
Two studies, Hytten and Leitch (1971) established that 12.5 kg as the physiological norm for average weight gain for a full-term pregnancy of 40 weeks, increases in maternal tissues and become progressively insensitive to insulin including the uterus and mammary glands, adipose tissue (fat), maternal blood volume and extracellular fluid. (Williamson, 2006). Skeletal muscle and adipose tissue are the main whole-body glucose disposable
6
sites. In normal pregnancy, insulin-mediated whole-body glucose disposal decreases 50% and in order to maintain a glycemic state, the woman must increase her insulin secretion by 200%-250% (Kampmann et al., 2015). The size of the thyroid gland remains unchanged and therefore the presence of goiter should always be investigated. The thyroid gland is 25% larger in patients who are iodine deficient (Kate et al., 2016).
II.1. 4. Pregnancy and hematological markers:
During pregnancy, about erythrocyte RBC, the total blood volume increases by about 1.5L, mainly to supply the needs of the new vascular bed. Almost 1 liter of blood is contained within the uterus and maternal blood spaces of the placenta. Expansion of plasma volume by 25%–80% is one of the most marked changes (Ramsay, 2010).In pregnancy, the normal Hgb reference range is 11-12 g/dL. The critical values for Hgb include: Hgb<5 g/dL and Hgb>20 g/dl. Hgb level begins to decline from the 16th week of gestation as a result of increased plasma volume. Similar trends are seen in RBC count and hematocrit (Hct) (David et al., 2018).Large cross sectional studies done in pregnancy of healthy women showed that the platelet count does decrease during pregnancy, particularly in the third trimester (Surabhi et al., 2012). The neutrophil count begins to increase in the second month of pregnancy and decrease in the second or third trimester, at which time the total white blood cell counts ranges from 9000 to 15,000 cells/µL( Michael et al., 2010).
II.1.5. Hormonal changes during pregnancy:
In pregnancy , the effects of increased levels of oestrogen and progesterone, peripheral vasodilatation and resultant decrease in systemic vascular resistance (SVR) begin to occur by 8th week of gestation (Pradeep & Swati ,2018). Estrogen increases the hepatic production of certain proteins, there is greater protein binding of corticosteroids, sex steroids and thyroid hormones (Kate et al.,2016). Progesterone is largely produced by the corpus luteum until about 10 weeks of pregnancy (Pratap & Navneet , 2012).
Pregnancy is associated with a relative iodine deficiency ,the causes for this are active transport of iodine from the mother to the foeto-placental unit and increased iodine excretion in the urine (Caron et al., 1997). In pregnancy the alterations in total TH levels are the direct consequence of the marked increase in serum binding globulin TBG total T4 and T3 levels increase significantly during the first half of gestation. Levels of serum T4 rise sharply between 6 and 12 weeks, progress more slowly thereafter, and stabilize around mid gestation , for serum T3 the rise is more progressive (Glinoer ,1997) .Serum
7
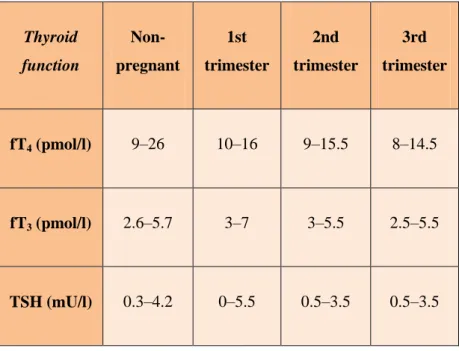
concentrations of TSH are decreased slightly in the first trimester in response to the thyrotropic effects of increased levels of human chorionic gonadotropin , levels of TSH increase again at the end of the first trimester (Priya et al., 2016).The table (01) show the thyroid function in pregnancy :
Table 01 :Thyroid function in pregnancy (Priya et al., 2016).
II.1.6.Trace elements change during pregnancy:
Iron deficiency (ID) is the most common pathologic cause of anemia in pregnancy, (Graham et al., 2015), ID and related anaemia (IDA) during pregnancy are highly prevalent worldwide in both developed and developing nations although the causes are often different, this is due to increased demands of the fetus, growing uterus, placenta, and poor nutritional habits (Abdul-Aziz et al., 2014), IDA will arise during pregnancy depends on two factors: the woman's iron stores at the time of conception and the amount of iron absorbed during gestation. The fact that anemia frequently does arise indicates both that pre-existing stores are often inadequate and that physiological adaptations are insufficient to meet the increased requirements (Lawrence, 2010). During pregnancy, fetal growth causes an increase in the total number of rapidly dividing cells, which leads to increased requirements for folate. Inadequate folate intake leads to a decrease in serum folate concentration, resulting in a decrease in erythrocyte folate concentration, a rise in homocysteine concentration Lynn et al.,2015). Folate deficiency during this period has
Thyroid function Non-pregnant 1st trimester 2nd trimester 3rd trimester fT4 (pmol/l) 9–26 10–16 9–15.5 8–14.5 fT3 (pmol/l) 2.6–5.7 3–7 3–5.5 2.5–5.5 TSH (mU/l) 0.3–4.2 0–5.5 0.5–3.5 0.5–3.5
8
been associated with a number of complications such as preeclampsia, miscarriage, stillbirth, low birth weight, and neural tube malformations (Erika et al., 2017).
In addition, the prevalence of calcium deficiency during pregnancy is common in pregnant women (Benali & Demmouche , 2014). During pregnancy increased intestinal absorption of calcium from the gut mainly due to higher generation of calcitriol (1,25 dihydroxy vitamin D) helps in maintaining maternal calcium levels (Shriraam et al., 2012). Zinc (Zn) is an essential micronutrient which is prone to maternal depletion during pregnancy (Ejezie & Nwagha, 2011) ,a structural constituent that is essential for cell growth, development and differentiation. Several earlier reports demonstrate that maternal zinc deficiency during pregnancy is linked with adverse pregnant outcomes including abortion, preterm delivery, stillbirth and fetal neural tube defects ( Hua et al., 2015) and risk of spontaneous abortion, gravidic toxemia, treatment-resistant anemia, abnormally prolonged gestation and difficult delivery for the mother (Favier & Favier ,1990).
Copper (Cu) is an essential micronutrient which has an important role in the human body. The serum copper increases during pregnancy and is doubled at full term. Lower levels of serum copper in pregnancy are connected with some pathological conditions (Vukelić et al., 2012).In pregnancy, excess copper levels can be associated with intrauterine growth restriction, preeclampsia and neurological disease (Walker et al., 2011).
II.1.7.Nutrition recommendations in pregnancy:
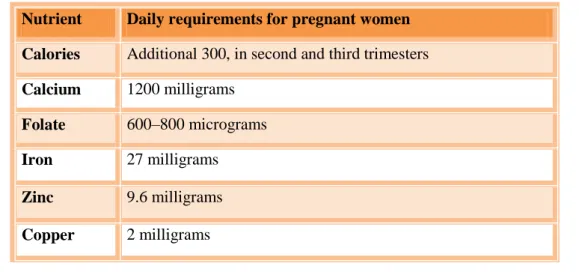
The body has increased nutritional needs during pregnancy require more micronutrients and macronutrients. Micronutrients are dietary components, such as vitamins and minerals, that are only required in small amounts. Macronutrients are nutrients that provide calories, or energy. These include carbohydrates, proteins, and fats (Moghissi, 1978). Folate and vitamin B12 for the prevention of neural tube defects, folic acid supplementation has no clear effect on cleft palate/lip or congenital cardiovascular defects, therefore all women are advised to take 400 mcg/day folic acid prior to conception until the 13th week of pregnancy with higher doses in certain circumstance to ensure fetal and placental growth due to its critical role in DNA synthesis and cell replication (Alison etal., 2016). The body needs more vitamins during pregnancy, especially vitamin A, vitamin B6 , vitamin C, vitamin D and vitamin K (Kiran,2017). Therefore, it is important to evaluate and make changes to improve maternal nutrition both before and during pregnancy (Oladapo,2000).
01
Table 02 :Calories and trace elements recommendations for pregnant women (Moghissi, 1978 ;Darnton-Hill ,2013;Rama , 1990)
Nutrient Daily requirements for pregnant women Calories Additional 300, in second and third trimesters
Calcium 1200 milligrams
Folate 600–800 micrograms
Iron 27 milligrams
Zinc 9.6 milligrams
Copper 2 milligrams
II.1.8. Complications during pregnancy:
During pregnancy there are many complications as having pre-eclampsia in one pregnancy is a poor predictor of subsequent pregnancy , but a strong predictor for recurrence of pre-eclampsia in future gestations (Hernández et al., 2009), hypertension, occurs when arteries carrying blood from the heart to the body organs are narrowed, this causes pressure to increase in the arteries, in pregnancy this can make it hard for blood to reach the placenta (Andrea et al ., 2013),which provides nutrients and oxygen to the fetus (Gude et al.,2004), diabetes in the mother and risk of fetal chromosomal abnormalities increase with the mother's age, women aged 35 and older are at increased risk of problems such as high blood pressure, gestational diabetes and complications during labor (Reeta et
al., 2009).
II.2. Gestational diabetes mellitus (GDM): II.2.1.Definition:
GDM is defined by the World Health Organization (WHO) as an anomaly of carbohydrate homeostasis leading to hyperglycemia of variable severity (Vanderijst et al., 2012; Debjyoti & Jai ,2010), beginner or diagnosed for the first time during pregnancy of the third trimester and responsible for feto-maternal complications (Sophie et al.,2017) glucose intolerance was not present or recognized prior to pregnancy.GDM affect 7% of pregnancies each year (Bonaventura et al., 2015). After birth many pregnant women with previously undiagnosed type 2 diabetes are often mistakenly diagnosed as having gestational diabetes (Reece et al., 2009).
00 II.2.2.Symptoms:
Feeling thirsty, that want to drink a lot more than you usually do, feel thirsty even when eaten something salty, run around on a hot day, or done something else that would make you want an extra glass of water ,being tired, feel fatigued even early in the day ,having a dry mouth, frequent urination and blurred vision (Lisa,2017).
II.2.3. Diagnostic of gestational diabetes:
Fifty years ago, screening for GDM was done by taking patients' history alone. In 1973, Mahan and O'Sullivan proposed using the 1- hour 50- g oral glucose tolerance test (OGTT) for screening. As stated previously, women with a positive 50-g OGTT need further diagnostic testing with either the 75 or the 100-g OGTT. There is a debate in the literature over which test is a better diagnostic tool. Both tests are administered after an overnight fast of at least 8 hours, but not more than 14 hours and after at least 3 days of unrestricted diet including > 150 g of carbohydrate per day.
Patients need to remain seated and should not smoke throughout the test if using the 100-g OGTT, the cutoff values should be fasting < 95 mg/dl, 1-hour _> 180 mg/dl, 2-hour _> 155 mg/dl and 3-hour > 140 mg/dl . Two or more abnormal values must be measured for the test to be considered a positive diagnostic test. When using the 2-hour 75-g OGTT, the cut-offs are the same at 1 and 2 hours. Again, two or more abnormal values are needed for a positive diagnosis. However, studies have shown that mothers with only one abnormal value are at increased risk for macrosomic infants and other morbidities.(Vambergue,2010; Sophie et al., 2017), the table (03)shows the results of diagnostic diabetes and GDM :
01 II.2.4.Pathophysiology of GDM:
Maternal age is an established risk factor for gestational diabetes mellitus (GDM) (Kalok et
al., 2018), in clinical practice maternal age of ≥25 years should be adopted instead of ≥35 years
or 40 years as a risk factor for the development of GDM (Terence et al., 2006). Maternal obesity in early pregnancy is an important risk factor for GDM .The relationship between maternal body mass index (BMI) and hyperglycemia is poorly characterized because mass index (BMI) has not been calculated accurately in early pregnancy (Farren et al., 2015),glucose intolerance and obesity may play a role in the development GDM, a strong family history of diabetes mellitus (FHD) has emerged as a risk factor for GDM (Nuriye, 2015), exactly as the results of Moosazadeh's (2016) study found that the odd odds ratio (OR) of gestational diabetes appears to be primarily associated with family history of diabetes, which is to be a powerful diagnostic and predictive factor of this disease which contribute also to mainly improve the health care measures of the pregnant woman (Moosazadeh et al., 2016).Polycystic ovary syndrome, a history of delivering big baby, history of recurrent abortions, and hypertension, or pregnancy-related hypertension are other risk factors for GDM and taking some types of anti-psychotic or steroid medications (NDSS,2016), unhealthy diet and race (Brenda , 2019).
II.2.5.Complications: II.2.5.1. For mother:
Women with gestational diabetes mellitus have a higher risk of pre-eclampsia caractized by elevation of blood pressure and presence of protein in the urine (Sanjay& Girija, 2014), shoulder dystocia, caesarean section increase the risk of developing type 2 diabetes in the future for the mother. Preterm delivery neonatal , hypoglycemia and admission to the neonatal intensive care unit was shown to be associated with maternal hyperglycemia (Howard et al., 2016).
II.2.5.2. For baby:
Risks for the baby above average weight, which can make birth more difficult. Hypoglycemia (abnormal glucose drop) at birth because their own insulin production is high, severe episodes of hypoglycemia may provoke seizures in the baby. An increased risk of type 2 diabetes in adulthood (Stewart& Malhotra, 2015),excessive birth weight, extra glucose in bloodstream crosses the placenta, which triggers the baby's pancreas to make extra insulin (Radmin,2018). This can be the cause for baby to grow too large (macrosomia) and preterm delivery. The aforementioned increase in placental transport of
02
glucose, amino acids, and fatty acids stimulate the fetus’s endogenous production of insulin and insulin-like growth factor 1 (IGF-1) (Jasmine et al., 2018).
II .2.6 GDM and hormonal system: II.2.6.1GDM and thyroid hormones:
Thyroid hormones are chemical substances made by the thyroid gland. They help regulate growth and the rate of chemical reactions (metabolism) ( Rashmi et al .,2014), and are involved in the circadian rhythms, among other essential functions. The two most important thyroid hormones are thyroxine (T4) and triiodothyronine (T3) (Bridget,2019). Thyroid stimulating hormone (TSH), which is produced by the pituitary gland acts to stimulate hormone production by the thyroid gland. The pituitary gland is stimulated to make TSH by the hypothalamus gland in the brain (William, 2018). The relationship between thyroid disorders and diabetes mellitus is characterized by a complex interdependent interaction (Hage et al., 2011).Women in early pregnancy who have high levels of a certain thyroid hormone may be at greater risk for gestational diabetes, compared to women who have normal levels of the hormone (Rawal, 2018).There is a correlation between thyroid disease and GDM , blood glucose levels during pregnancy is influenced by various physiological hormones such as estrogen, thyroid-binding globulin (TBG), human chorionic gonadotropin (hCG), and placental insulin enzyme, all of which are affected by maternal thyroid function (Shuai et al., 2016).
II.2.6.2 Insulin resistance in normal pregnancy and with GDM:
Pregnancy is associated with alterations in the regulation of glucose metabolism caused by the actions of human placental growth hormone, prolactin, cortisol, and progesterone; these hormones antagonize the action of insulin, particularly during the 2nd and 3rd trimesters. In early pregnancy, insulin secretion increases (Amit et al., 2014) while insulin sensitivity is unchanged , decreased , or may even increase and in late gestation, maternal adipose tissue depots decline, while postprandial free fatty acid (FFA) levels increase and insulin-mediated glucose disposal worsens (Barbour et al., 2007). Insulin resistance develops in the second trimester and continues until birth, but is believed to be related to the production of hormones, cytokines, or adipokines by the placenta. Insulin secretion also increases, resulting in normal glucose concentrations (Karen et al., 2016). Insulin resistance involves impaired activities of the glucose transport system in insulin
03
target tissues by GLUT4 glucose transporter protein in adipose tissues from the pregnant women (Okuno et al., 1995). Hormones secreted by the placenta starting with the second trimester reduce the effectiveness of insulin, which leads to increased transplacentar nutrient transport as the fetus develops and promotes its growth ( Elvira et al., 2016).
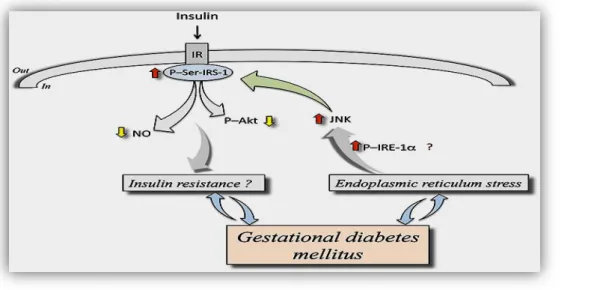
About gestational diabetes is a metabolic abnormalities occurring during pregnancy associated with carbohydrate metabolism (Butte, 2000). Decreased maternal pregravid insulin sensitivity (insulin resistance) coupled with an inadequate insulin response are the pathophysiological mechanisms underlying the development of gestational diabetes (Catalano et al 2003). Caractised by altering of levels and function of insulin receptors , control of insulin-dependent processes in the human placenta will change from mother to foetus throughout gestation particular interest in conditions associated with altered maternal or foetal insulin levels (Hiden et al., 2006).Gestational diabetes mellitus is a disease that associates with endoplasmic reticulum stress (ERS) (Hong et al., 2016),it plays a role in the pathogenesis of diabetes, contributing to pancreatic beta-cell loss and insulin resistance (Eizirik et al., 2008). Increased phosphorylation of inositol-requiring enzyme 1α (P-IRE-1α) resulting in higher c-Jun N-terminal kinase (JNK) activity causes phosphorylation of insulin receptor substrate 1 at serine307(P-Ser-IRS-1) ending in lower insulin receptor (IR)-associated cell signaling in response to insulin , thus inhibiting insulin signaling pathway, a condition that turns into a stage of insulin resistance due to defective downstream signaling, including reduced protein kinase P/Akt activation and NO synthesis (Sobrevia et al., 2016).
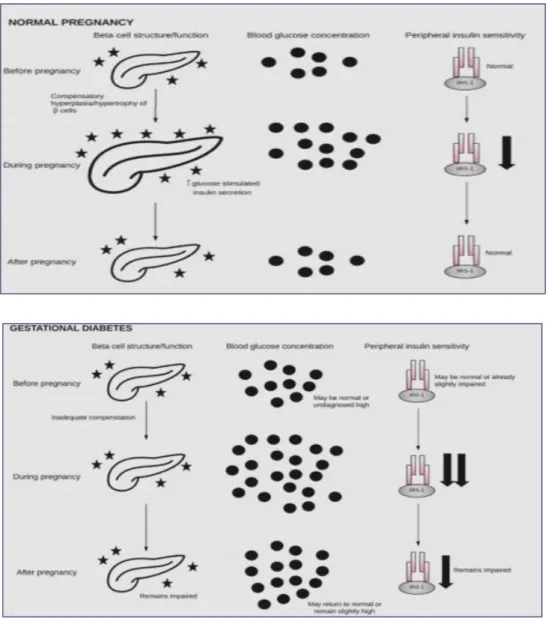
04
II.2.6.3 Relationship between β-cell dysfunction, insulin resistance, and GDM: During normal pregnancy, β-cells undergo hyperplasia and hypertrophy in order to meet the metabolic demands of pregnancy. Blood glucose rises as insulin sensitivity falls. During gestational diabetes, β-cells fail to compensate for the demands of pregnancy when combined with reduced insulin sensitivity, this results in hyperglycemia (Hongjie,2010). Following pregnancy, β-cells, blood glucose, and insulin sensitivity may return to normal or may remain impaired on a pathway toward GDM in future pregnancy or T2DM. Pancreas image obtained from The Noun Project under the terms and conditions of the Creative Commons Attribution (CC BY) licens represented in figure (03) (Jasmine et al., 2018).
Figure 03: Relationship between β-cell dysfunction, insulin resistance, and GDM (Jasmine et al., 2018).
05 II.2.7. Treatment:
Treatment of gestational diabetes dietetics, glycemic self-monitoring, insulin therapy if necessary, that reduces severe perinatal complications, fetal macrosomia and preeclampsia (Jacqueminet & Jannot, 2010).Treatment strategy with glibenclamide (known in the as glyburide) requiring progression to insulin in around 4% of casesaction of glyburide is to increase insulin secretion, decreasing hepatic glucose production with resultant reversal of hyperglycemia and indirect improvement of insulin sensitivity (Silva et
al ., 2006; Langer et al., 1989), and metformin are effective treatments for gestational
diabetes. Metformin resulted in similar outcomes to initial insulin treatment in gestational diabetes (Lindsay et al., 2011).
II.2.8. Prevention:
Which might include controlling excessive gestational weight gain or glycemic control. Physical activity during pregnancy, exercise is believed to play a role in reducing the risk of complications such as preterm birth and pre‐eclampsia, and may help prevent excess pregnancy weight gain and postpartum weight retention (Emily et al., 2017). Should have a reasonable diet, replenish trace elements, therefore reducing the occurrence of adverse pregnancy outcomes (Shen et al., 2015).
II.2.9. Development of gestational diabetes:
Most likely, gestational diabetes should go away about six weeks after delivery. However, because women had gestational diabetes, she is at a higher risk (a 33-50% increased risk) for having it again in another pregnancy. She is also at a higher risk for developing type 2 diabetes (Grazia,2019) is related to the continuum between the level of maternal hyperglycemia and the occurrence of perinatal complications (Lepercq, 2007).
III.Oxidative stress: III.1. Definition:
Oxidative stress can be defined as a state of disrupted balance between reactive oxygen species and the mechanisms of detoxification and repair. Reactive oxygen species (ROS) are formed in every living cell during the physiological process of breathing, a molecule of ROS contains an atom of oxygen with an unpaired electron (Anna& Krzysztof, 2013). Its enhanced state has been associated with many of the chronic diseases such as cancer, diabetes, neurodegenerative and cardiovascular diseases (Pollyanna et al.,2014).
06 III.2. Free radicals:
A free radical is defined as any molecular species capable of independent existence that contains an unpaired electron in an atomic orbital (Lobo et al., 2010).
Reactive oxygen species is a collective term that includes all reactive forms of oxygen, including both radical and non radical species that participate in the initiation and/or propagation of chain reaction (Alugoju,2015).Table (04) shows the main (ROS):
Table 04: Main oxygen reactive species and its performance (Monique & João, 2010)
III.3.Sources of free radicals:
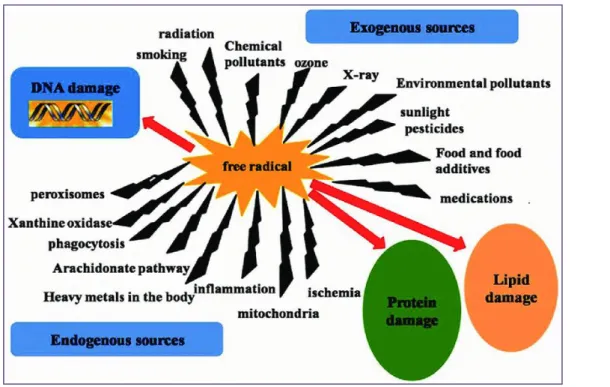
The human body is continuously exposed to potentially harmful oxidative stresses during the course of life time, these may arise from exogenous as well as endogenous sources (Ray et al., 2001), figure (04) shows the sources of free radicals.
III.3.1.Endogenous sources of ROS:
The main source of ROS in vivo is aerobic respiration. ROS are also produced by peroxisomal β-oxidation of fatty acids, microsomal cytochrome P450 metabolism of xenobiotic compounds, stimulation of phagocytosis by pathogens or lipopolysaccharides, arginine metabolism and tissue specific enzymes (Nicholls , 2000).
III.3.2.Exogenous sources of ROS:
Excessive levels of free radicals are produced from pollution exposure; toxin exposure, including exotoxins such as heavy metals like mercury, lead and cadmium. Other exotoxins include anticancer drugs, anesthetics and analgesics (Egbuna & Ifemeje, 2017).
07
Toxin exposure also includes endotoxins such as those produced from bacteria, yeast, viruses and parasites; trauma; radiation; electromagnetic fields; alcohol; cigarette smoke; medications; stress; allergens; cold; excessive exercise; dietary factors such as excess sugar, saturated fat and fried oils; malnutrition and various disease states (Cadenas & Davies, 2000).
Figure 04: Endogenous and exogenous sources of free radicals (Saheem et al., 2017)
III.4. Antioxidants:
Antioxidants are a class of chemical substances naturally, which can prevent or reduce the oxidative stress of the physiological system being fantastic free radical scavengers help in preventing and repairing the cell damage caused by these radicals (Mamta et al., 2014). Antioxidants are found in many foods, including fruits and vegetables. Although oxidation reactions are crucial for life, they can also be damaging; plants and animals maintain complex systems of multiple types of antioxidants (Anuj et
al., 2016).
The classification of antioxidant enzymatic and no enzymatic , the enzymatic antioxidant defense systems is copper-zinc super oxide dismutase (CuZn SOD) that converts super oxide radicals to hydrogen peroxide (H2O2), glutathione peroxidase (GSH-Px) and catalase (CAT) will then convert H2O2 to a water molecule. Cu-Zn SOD, GSH-Px, and CAT together provide the primary antioxidant defense mechanism ( Moharram&
08
Mohammed ,2014). The non-enzymatic antioxidant defense system includes ascorbic acid (vitamin C), α- tocopherol (vitamin E), glutathione (GSH), β-Carotene, and vitamin A. There is a balance between both the activities and intracellular levels of these antioxidants that are essential for the survival of organisms and their health. Such as glutathione, vitamin C, vitamin A, and vitamin E as well as enzymes such as catalase, superoxide dismutase and various peroxides (Vaisi et al., 2007). Figure(06) shows the classification of antioxidants:
Figure 05: Classification of antioxidants (Iryna , 2018)
III.5.Oxidative stress and pregnancy:
Pregnancy is physiological conditions in which women are prone to oxidative stress due to imbalance between pro-oxidant and antioxidant factors that increased mitochondria in placenta and increased partial pressure of oxygen in pregnant women (Saikumar et al., 2013). Oxidative stress is implicated in the pathophysiology of many reproductive complications including infertility, miscarriage, pre-eclampsia, fetal growth restriction and preterm labour (Kate et al., 2016). It plays a pivotal role in the development of placental related diseases ,the mechanisms involved in the alterations of oxygen (O2) homeostasis and evaluated the consequences for human pregnancy (Eric et al., 2006).
11
During a normal pregnancy, oxidative stress enhances antioxidant mechanisms that are capable of reacting by way of enzyme activity and non-enzyme free radical deactivators, which this adaptation and balance (Anna & Krzystof, 2013), oxidative stress plays important roles in embryo development, implantation, placental development and function, fetal development, and labor antioxidant enzymes include glutathione peroxidase and superoxide dismutase (Kate et al., 2016).
The placenta, a hormone-rich tissue, is an important source of pro-oxidizing agents and of antioxidant enzymes that maintaining lipid peroxidation under control which increases during normal pregnancy (Sainz et al., 2000). The serum MDA levels in the second trimester are significantly higher than the first trimester (Saikumar et al., 2013) because during pregnancy is based on the products of lipid peroxidation produced in the placenta could pass into maternal blood and act as agents triggering damage in other tissues, which are secreted mainly on the maternal side of the placenta and remain in the maternal circulation for some time (Npso et al., 2018). Increased lipid peroxidation markers are observed during normal pregnancy, disturbances in the maternal compartment can affect the placental gene methylation state and increase placental oxidative stress, resulting in changes in placental function (Jayasri et al., 2015). The increase in lipid peroxidation and the significant decrease in GSH and total antioxidant power ORAC in the serum and erythrocytes of pregnant women during the third trimester of pregnancy clearly show the evolution of the state of stress oxidative therapy associated with pregnancy in pregnant women (Derouiche et al., 2018). An oxidative burst occurs during pregnancy due to the large consumption of oxygen in the tissues and an increase in metabolic demands in response to maternal physiological changes and fetal growth (Luccaet al., 2016).
III.6. Oxidative stress and GDM:
Pathologic pregnancies including gestational diabetes mellitus (GDM), are associated with a heightened level of oxidative stress, owing to both over production of free radicals and/or a defect in the antioxidant defenses. The relative immaturity of the antioxidant system facilitates the exposure of embryos and fetuses to the damaging effects of oxidative stress (Martha et al., 2011),the increase secretion of tumor necrosis factor- (TNF-) from the placenta and adipose tissue from women with GDM under conditions of high glucose and propose that an altered oxidative homeostasis in women with GDM may be involved (Coughlan et al., 2003). Limited data in gestational diabetes mellitus (GDM) suggest that
10
products of lipid peroxidation maybe increased and antioxidant enzyme activities decreased. As in type 2 diabetes mellitus, glycemic levels in patients with GDM correlate with concentrations of lipid peroxides (Xinhua & Theresa , 2005). Radical phenomena plays an important role in the reproduction, the nesting of the fertilized egg and the development of the embryo, but an imbalance between their production, intense during gestation, and their elimination can generate oxidative stress and iron supplementation during pregnancy contributes to the increase of oxidative stress in pregnant women who take it, in particular an increase in maternal and placental plasma MDA (Devrim et
al.,2006). Increased oxidative stress is a widely accepted participant in the development
and progression of diabetic tissue damage and induced changes in the activities of antioxidant enzymes in various tissues (Derouiche et al .,2018).
Second part
Materials
&
13 I.1. Patients and reagents:
I .1.1. Study period:
Our study was organized over a period of 7 months (from the beginning of September 2018 to the end March 2019) to Faculty of Natural Sciences and Life at the University of Echahid Hamma Lakhdar El-Oued.
I.1.2.Risk factors study:
In our study, we used the questionnaires (Annex 01) and asked for 140 volunteers divided into 70 healthy women as a control and 70 women gestational diabetes patients they are the origin of El Oued region.
I.1.3. Biological study:
For biological study, our study was applied to 30 volunteers women of age between 16-45 years were divided into two groups; a group of 15 healthy control women with mean age 27.67± 1.77year, and the other group of 15 women has diabetes with mean age 34.64±1.03 year.
Inclusion criteria:
Voluntary women live in the El Oued region.
Control women in good health, does not have any pathology.
Women suffering from gestational diabetes during or after pregnancy period.
Exclusion criteria:
Women are suffering from other acute or chronic pathology. I.1.4.Reagents:
Ethylene diamine tetraacetic acid (EDTA), Hydrogen Peroxyde (H2O2), Hydrochloricacid (HCl) , Thiobarbituric acid (TBA) , Salicylic acid , Methanol, Tris Trichloroacetic acid (TCA) , Copper sulfate (CuSO 4) , Nitric acid (HNO 3) , Ascorbic acid, DTNB (5,5′-Dithiobis(2-nitrobenzoic acid )), Phosphoric acid (H 3 PO 4) , Sodium chloride (NaCl) , Zinc nitrat (Zn (O 2 CCH 3 )), Butylated hydroxytoluene (BHT ), Phosphate-buffered (KH₂PO 4,K₂HPO 4), Coomassie Blue.
14 I.2. Methods:
I.2.1. Collection of data:
Each volunteer submitted the questionnaire including social and clinical data that can give us different factors associated with the pathology.
I.2.1.1. Sample collection:
Performed blood sampling for both groups is done morning fasting. It is performed in the vein of the end of the elbow. After the blood sampling, the blood is collected in two tubes. Dry tubes are centrifuged at 3000 rpm for 10 minutes, then recover the serum to achieve the dosage of biochemistry parameter: Glucose, urea, creatinine ,cholesterol, triglyceride, amylase activity, alkaline phosphatase activity, calcium,copper, zinc, iron,T3, T4, TSH and total antioxidant ORAC.
The anticoagulant tube (EDTA) is mixed well and then assays the hematological and oxidative stress (MDA, GSH and CAT activity) parameters.
I.2.2. Biochemical parameters assay:
Serum glucose, urea, creatinine, calcium, iron, triglyceride and cholesterol Were determined by Auto analysis (BIOLIS24j) use commercial kits from Spinreact, (Spainref: glucose-20121, urea-20141, creatinine-20151,calcium: 20051, iron-20061, cholesterol-20111, triglyceride-20131,) and enzyme marker were also measured using commercial kits (Spinreact, ref: phosphates-20015,amylase -20031).
I.2.3. Hormonal parameters assay:
T3, T4 and TSH level are measured by Enzyme Linked Fluorescent Assay (ELFA) andPLC used:Vidas PC, biomerieux.
I.2.4. Method of Hematological analysis:
Hematological analysis (FNS) is performed by the hematology Auto analyzer. I.2.5. Method of estimating oxidative stress parameters:
I.2.5.1. Preparation of erythrocyte homogenate:
Blood EDTA tubes contents are centrifuged at 2000 rpm for 10 min and removed the plasma. The cap of EDTA tube was lysis with 50 ml of TBS buffer (EDTA 2.92M;tris 1.21M; pH=7) and incubated 30 min in freezer. After incubation centrifuged at 2500 rpm for 10 min and the obtained supernatant (erythrocyte homogenate) was used for the determination of antioxidant activity (Miller et al., 1988).(Annex02).
15 I.2.5.2. Leukocyte separation:
After removing the plasma and separation of erythrocyte, the rest of EDTA tube contents centrifuge at 2000 rpm for 10 min. Wash pellet with lysis buffer and shake incubate in freezer for 30 min. After incubation centrifuged at 2500 rpm for 10 min. followed this step by washing with lysis buffer until the Leukocyte pairing and then recovered to make the dosage of stress tests (Miller et al., 1988). (Annex 03)
I.2.5.3. Collect saliva:
Saliva collected in a dry tube was fasting in the morning. Centrifuge at 3000 rpm for 10 minutes. And then used for oxidative stress assay (GSH ,CAT and MDA).
I.2.5.4. Determination of Leukocyte Protein concentration: Principle:
Protein concentration was measured according to the method of Bradford M.M., 1976 that uses Comassie blue as reagent. The latter reacts with the amino groups (-NH) of the proteins to form a blue complex (The appearance of the blue color reflects the degree of ionization of the medium and the intensity corresponds to the concentration of the proteins).
Operating mode:
- Take 40µl of erythrocyte. - Add 1 ml of Coomassie Blue.
- Shake and let stand for 5 min for color stabilization. - Read the optical density at 595 nm, against the control.
The obtained optical density is reported on a calibration curve previously drawn. The concentration of the proteins is determined by comparison with a standard range of bovine serum albumin (1 mg / ml) previously carried out under the same conditions.(Annex03).
I.2.5.5. Determination of catalase activity:
The catalase activity consists in measuring the catalase-induced H2O2 disappearance contained in the sample by measuring the absorbance of H2O2 at 560 nm using a UV / visible spectrophotometer. Briefly in test tubes, mix 1 ml of phosphate buffer (0.1 mHg, 0.1M, pH7.2), 0.975 ml of freshly prepared H2O2 (0.091M) and 0.025 ml of the enzyme source (homogenate). Absorption read at 560 nm every minute for 2 minutes (Aebi, 1984)
16 - A1:Absorbance at the first minute. - A2:Absorbance at the second minute. - T: Time interval in minutes.
I.2.5.6. Determination of Reduced glutathione (GSH) level:
The determination of the reduced glutathione concentration by measuring the optical density results from the formation of 2-nitro-5-mercocapturic acid from the reduction of dithio-bis-2-nitrobenzoic acid, which is called reagent of Ellman with SH groupings exist in GSH briefly, 800 μL of homogenate are added to 200 μL of salicylic acid (0.25%) and centrifuge at 1000 rpm for 5 minutes. 500 ml of supernatant are then mixed with 1000 μl of tris buffer (tris 0.4 mol, 0.02 molNaCl pH = 8.9) and 25 µL of DTNB (0.01 mol.L-1). After 5 minutes of incubation, the absorbance is read at 412 nm (Weakbeker& Cory, 1988).
- 13133: Absorption constant of SH groups at 412 nm. - OD:The absorbance reader by the spectrophotometer. - 1.525 ml:Total volume of blend.
- 0.5 ml:Volume of solution float. - 1:Volume of protein mixture.
- 0.8ml:Volume of homogeneous solution without protein exists in 1ml. - GSH: Concentration of glutathione.