LOW-IMPACT OPERATING SYSTEM TRACING
MATHIEU DESNOYERS
D´EPARTEMENT DE G´ENIE INFORMATIQUE ET G´ENIE LOGICIEL ´
ECOLE POLYTECHNIQUE DE MONTR´EAL
TH`ESE PR´ESENT´EE EN VUE DE L’OBTENTION DU DIPL ˆOME DE PHILOSOPHIÆ DOCTOR (Ph.D.)
(G´ENIE INFORMATIQUE) D´ECEMBRE 2009
c
´
ECOLE POLYTECHNIQUE DE MONTR´EAL
Cette th`ese intitul´ee :
LOW-IMPACT OPERATING SYSTEM TRACING
pr´esent´ee par : DESNOYERS Mathieu
en vue de l’obtention du diplˆome de : Philosophiæ Doctor a ´et´e dˆument accept´ee par le jury constitu´e de :
Mme. BOUCHENEB Hanifa, Doctorat, pr´esidente
M. DAGENAIS Michel, Ph.D., membre et directeur de recherche M. BOYER Fran¸cois-Raymond, Ph.D., membre
I dedicate this thesis to my family, to my friends, who help me keeping balance between the joy of sharing my work, my quest for knowledge and life.
Je d´edie cette th`ese `a ma famille, `a mes amis, qui m’aident `a conserver l’´equilibre entre la joie de partager mon travail, ma quˆete de connaissance et la vie.
Acknowledgements
I would like to thank Michel Dagenais, my advisor, for believing in my poten-tial and letting me explore the field of operating systems since the beginning of my undergraduate studies.
I would also like to thank my mentors, Robert Wisniewski from IBM Research and Martin Bligh, from Google, who have been guiding me through the internships I have done in the industry. I keep a good memory of these experiences and am honored to have worked with them.
A special thanks to Paul E. McKenney, who I found has an insatiable curiosity and never-ending will to teach, discuss and learn. I really enjoyed working with him on the user-space RCU implementations.
Thanks to my family, Normand, H´el`ene and Alexandre for their support through the duration of this research. A special thanks to my friend Etienne Bergeron, who helped me making this thesis better with his thorough reviews and relevant criticism. Thanks to everyone who reviewed this thesis: Nicolas Gorse and Matthew Khouzam. Thanks to the students with whom I shared the laboratory for the discussions, always useful to explore the many faces of a problem. Thanks to the Montr´eal Art Caf´e staff for feeding the writing of this thesis with their joviality and excellent Caf´e Moka.
Thanks to Google, IBM Research, Ericsson, Autodesk, Natural Sciences and Engi-neering Research Council of Canada and Defence Research and Development Canada for funding this research.
Thanks to the countless industry collaborators at Fujitsu, Wind River, Nokia, Siemens, Novell and Monta Vista. Thanks to the SystemTAP team for their collab-oration, especially to Frank Ch. Eigler.
Finally, I would like to thank the Linux kernel developers community for their constructive criticism and their input. Special thanks to Ingo Molnar, Steven Rostedt, Andrew Morton, Linus Torvalds, Christoph Hellwig, Christoph Lameter, H. Peter Anvin, Rusty Russell, Andi Kleen, Tim Bird, Kosaki Motohiro, Lai Jiangshan, Peter Zijlstra and James Bottomley. I would not have developed such a thorough knowledge of operating systems without all these heated discussions on the Linux Kernel Mailing list.
Abstract
Computer systems, both at the hardware and software-levels, are becoming in-creasingly complex. In the case of Linux, used in a large range of applications, from small embedded devices to high-end servers, the size of the operating system kernels increases, libraries are added, and major software redesign is required to benefit from multi-core architectures, which are found everywhere. As a result, the software de-velopment industry and individual developers are facing problems which resolution requires to understand the interaction between applications and all components of an operating system.
In this thesis, we propose the LTTng (Linux Trace Toolkit next generation) tracer as an answer to the industry and open source community tracing needs. The low-intrusiveness of the tracer is a key aspect to its usefulness, because we need to be able to reproduce, under tracing, problems occurring in normal conditions. In some cases, users leave tracers active at all times in production, which makes the tracer overhead definitely critical. Our approach involves the design of synchronization primitives that meet the low-impact requirements. The linearly scalable and wait-free RCU(Read-Copy Update) synchronization mechanism used by the LTTng tracer fulfills these requirements with respect to data read. A custom-made buffer synchronization scheme is proposed to extract tracing data while preserving linear scalability and wait-free characteristics.
By measuring the LTTng impact, we demonstrate that it is possible to create a tracer that satisfy all the following characteristics: low latency, deterministic real-time impact (wait-free), small impact on operating system throughput and linear scalability with the number of cores. Experiments on various architectures show that this tracer is portable.
We propose a general model for superscalar multi-core systems with weakly-ordered memory accesses to perform formal verification of the RCU correctness and wait-free guarantees by model-checking. The LTTng buffering scheme is also for-mally verified for safety and progress. Formal verification demonstrates that these algorithms allow reentrancy from multiple execution contexts, ranging from standard thread to non-maskable interrupts handlers, allowing a wide instrumentation coverage
R´
esum´
e
Les syst`emes informatiques, tant au niveau mat´eriel que logiciel, deviennent de plus en plus complexes. En ce qui concerne Linux, syst`eme d’exploitation utilis´e dans une vaste cat´egorie d’applications, des petits syst`emes embarqu´es aux serveurs de haut-niveau, la taille des noyaux de syst`emes d’exploitations augmente, des li-brairies sont ajout´ees et une r´eing´enierie logicielle est requise pour b´en´eficier des architectures multi-cœurs, lesquelles sont omnipr´esentes. Par cons´equent, l’industrie du d´eveloppement logiciel et les d´eveloppeurs individuels font face `a des probl`emes dont la r´esolution n´ecessite de comprendre l’interaction entre les applications et tous les composants d’un syst`eme d’exploitation.
Dans cette th`ese, nous proposons le traceur LTTng (Linux Trace Toolkit next
generation) comme r´eponse aux besoins de tra¸cage de l’industrie et de la
commu-naut´e du logiciel libre. La faible intrusivit´e du traceur est un aspect cl´e menant `a son utilisabilit´e, puisqu’il est n´ecessaire de reproduire, sous tra¸cage, des probl`emes observ´es sous des conditions d’ex´ecution normales. Dans certains cas, les usagers souhaitent laisser des traceurs actifs en tout temps sur des syst`emes en production, ce qui rend l’impact en performance d´efinitivement critique. Notre approche implique l’´elaboration de primitives de synchronisation qui rencontrent les requis de faible im-pact. Le m´ecanisme de synchronisation permettant la mise `a l’´echelle et sans attente RCU(Read-Copy Update) utilis´e par le traceur LTTng remplit ces requis en ce qui con-cerne la lecture de donn´ees. Nous proposons un m´ecanisme de synchronisation pour extraire les donn´ees de tra¸cage en pr´eservant les caract´eristiques de mise `a l’´echelle lin´eaire et de non-attente.
En mesurant l’impact du traceur LTTng, nous d´emontrons qu’il est possible de cr´eer un traceur qui satisfait toutes les caract´eristiques suivantes : faible latence, comportement temps-r´eel d´eterministe (sans attente), faible impact sur le d´ebit du syst`eme d’exploitation et une mise `a l’´echelle lin´eaire par rapport au nombre de processeurs. Une exp´erimentation sur plusieurs architectures permet d’observer la portabilit´e du traceur.
Nous proposons un mod`ele g´en´eral pour les syst`emes superscalaires multi-cœurs avec acc`es m´emoire faiblement ordonn´es pour permettre la v´erification formelle des
garanties quant `a l’exactitude de l’ex´ecution et l’ex´ecution sans attente `a l’aide de la v´erification de mod`ele. Le m´ecanisme de tampon de LTTng est ´egalement v´erifi´e formellement quant `a son exactitude et son ex´ecution sans attente. La v´erification formelle permet ´egalement de d´emontrer que ces algorithmes permettent la r´eentrance de plusieurs contextes d’ex´ecution, du fil d’ex´ecution standard aux gestionnaires d’in-terruptions non-masquables, permettant une large couverture d’instrumentation du syst`eme d’exploitation.
Condens´
e en fran¸
cais
La croissance en complexit´e des syst`emes informatiques actuels rend les tˆaches de d´everminage et l’analyse de performance de plus en plus difficiles. Le besoin en outils d’analyse qui tiennent compte de l’ensemble du syst`eme se fait sentir, mais leur impact en performance est g´en´eralement un obstacle `a leur adoption.
Le tra¸cage est une technique ´eprouv´ee pour permettre l’´etude des interactions entre composants d’un syst`eme informatique, mais son impact en performance le rend inutilisable sous plusieurs charges de calcul. Cette recherche tente de rendre le tra¸cage largement utilisable par une vaste cat´egorie d’applications.
Il importe ´egalement pour un traceur de modifier le comportement du syst`eme observ´e de fa¸con minimale afin de permettre la reproductibilit´e des probl`emes observ´es sans tra¸cage. Il est ´egalement important que le traceur n’utilise qu’une fraction des ressources du syst`eme et ne modifie son comportement que de fa¸con d´eterministe afin de permettre une activation du tra¸cage sur des syst`emes en production.
Le probl`eme ´etudi´e dans ce travail est l’extraction d’information de tra¸cage d’un syst`eme d’exploitation, ce qui implique la collecte d’information `a partir de l’ex´ecution de ce syst`eme d’exploitation et le transfert de cette information hors du noyau. Les aspects de ce probl`eme qui rendent cette ´etude int´eressante sont l’impact du traceur sur le fonctionnement du syst`eme et la couverture d’instrumentation : quelles parties du syst`eme peuvent ˆetres instrument´ees.
L’hypoth`ese servant de point de d´epart `a cette ´etude est qu’il est possible de tracer un syst`eme d’exploitation qui ex´ecute une charge de travail ´elev´ee sur des ordinateurs multiprocesseurs, en n’utilisant qu’une petite fraction des ressources syst`emes, tout en permettant l’instrumentation de n’importe quel site noyau ou usager, rendant ainsi possible la mod´elisation du comportement original du syst`eme. Ceci implique l’utili-sation d’une fraction du d´ebit du syst`eme ainsi qu’un ajout d’une faible quantit´e `a sa latence moyenne. La conservation des propri´et´es suivantes du syst`eme d’exploitation est recherch´ee : mise `a l’´echelle, r´eponse temps-r´eel, portabilit´e et r´eentrance.
Le but de cette ´etude est la cr´eation d’un traceur `a faible impact, hautement r´eentrant et permettant la mise `a l’´echelle, pour le noyau d’un syst`eme d’exploitation largement utilis´e : Linux. Cette infrastructure doit ˆetre capable de g´erer un d´ebit de
tra¸cage g´en´er´e par des charges de travail ´elev´ees sur des syst`emes multiprocesseurs. Celui-ci doit pr´eserver, ou modifier dans une faible proportion, les caract´eristiques du noyau Linux.
Les objectifs de recherche sont les suivants :
– rencontrer les requis de tra¸cage de l’industrie et de la communaut´e du logiciel libre,
– mettre au point de nouveaux algorithmes pour solutionner les probl`emes de l’industrie identifi´es,
– implanter un traceur pour Linux, un syst`eme d’exploitation largement utilis´e, – d´evelopper chaque composant du traceur afin que leur combinaison conserve les
propri´et´es de mise `a l’´echelle et ait un faible impact sur le d´ebit et la latence moyenne du syst`eme d’exploitation,
– garantir un impact temp-r´eel d´eterministe du tra¸cage,
– obtenir des m´ecanismes de tra¸cage ayant une portabilit´e et r´eentrance accrues. La contribution scientifique principale de cette recherche est la cr´eation de m´eca-nismes de synchronisation adapt´es au tra¸cage, incluant : un algorithme de synchro-nisation de tampons sans attente, pouvant ˆetre mis `a l’´echelle de mani`ere lin´eaire et supportant les NMIs (interruptions non-masquables), l’application de techniques d’auto-modification de code pour g´erer l’activation d’instrumentation statique de mani`ere efficace, l’am´elioration des m´ecanismes de synchronisation RCU en espace us-ager et la cr´eation d’un mod`ele d’architecture g´en´erique pour la v´erification formelle d’algorithmes parall`eles, mod´elisant les acc`es m´emoire et l’ordonnancement d’instruc-tions faiblement ordonn´es. Ces contribud’instruc-tions permettent l’atteinte des objectifs de recherche identifi´es.
La m´ethodologie utilis´ee pour r´epondre `a ces objectifs se d´etaille comme suit. Une interaction avec l’industrie et la communaut´e du logiciel libre permet initialement d’obtenir plus d’information sur le contexte d’utilisation typique et les besoins per¸cus en entreprise. Des stages chez IBM Research, Google, ainsi qu’une collaboration avec Autodesk et Ericsson, ont permis de mieux comprendre ces besoins. En parall`ele avec cette ´etude de terrain, des prototypes du traceur sont r´ealis´es et propos´es aux communaut´es LTT et du noyau Linux afin de b´en´eficier de leurs commentaires. `A travers les phases de son d´eveloppement, LTTng est test´e avec des charges de travail extrˆemes, et l’utilisation de bancs d’essais en performance permettent de s’assurer que l’impact du traceur se situe dans des limites acceptables. La v´erification de mod`ele est
utilis´ee afin de v´erifier formellement les algorithmes de synchronisation de tampons quant `a leur exactitude ainsi que d’assurer l’absence de famine.
Tˆot dans le d´eveloppement, j’ai identifi´e le besoin de d´ecoupler l’instrumenta-tion du traceur, dans le but de permettre `a des contributeurs externes et experts de proc´eder `a l’instrumentation de chaque sous-syst`eme du noyau. C’est pourquoi j’ai cr´e´e les Kernel Markers et Tracepoints afin de permettre de g´erer cette instrumen-tation et aider `a l’ajout d’instrumeninstrumen-tation dans le noyau Linux. Ces infrastructures sont maintenant int´egr´ees dans le noyau Linux et utilis´ees largement par la commu-naut´e de d´eveloppeurs Linux.
Plusieurs prototypes de traceur pour l’espace usager ont ´egalement ´et´e r´ealis´es au cours de ce projet. Le projet UST (User-Space Tracer) pr´esentement en cours b´en´eficie de l’exp´erience acquise via l’implantation de ces prototypes, r´eutilisant l’algorithme de synchronisation de tampons de LTTng ainsi que les m´ecanismes de Kernel Markers et
Tracepoints. Un aspect cl´e de la conception du traceur LTTng pour permettre la mise `a
l’´echelle et un faible impact sur les performances est l’utilisation de RCU (Read-Copy Update) pour la synchronisation de l’acc`es en lecture aux donn´ees de contrˆole du tra¸cage. Cependant, puisque ce m´ecanisme ´etait inexistant en espace usager, nous avons con¸cu de nouveaux algorithmes permettant `a RCU d’ˆetre utilis´e dans ce contexte plus contraint. Ce travail a ´et´e effectu´e en collaboration avec Paul E. McKenney, Alan Stern et Jonathan Walpole. J’ai proc´ed´e `a la mise en application de ces algorithmes en les implantant dans une librairie de synchronisation RCU offrant des services similaires `a ceux de l’implantation du noyau Linux.
Vu la complexit´e des algorithmes de RCU et de synchronisation de tampon de LTTng, proc´eder `a leur v´erification formelle est souhaitable afin d’augmenter le niveau de confiance dans leur implantation. J’ai donc entrepris la tˆache de cr´eer un mod`ele de processeurs avec acc`es m´emoire et ex´ecution faiblement ordonn´es, afin d’assurer l’exactitude et le progr`es au plus bas niveau, tout en restant assez g´en´eral pour assurer la portabilit´e de l’implantation des algorithmes.
Afin de s’assurer que le traceur respecte l’ensemble de ces propri´et´es, il faut s’at-tarder `a chaque m´ecanisme qui le composent, tant au niveau du support `a l’instru-mentation, de la lecture de temps, du contrˆole du tra¸cage que de la synchronisation des tampons. Ces m´ecanismes sont coordonn´es par l’ex´ecution de la sonde (probe). Le sch´ema fonctionnel de celle-ci se retrouve `a la Figure 0.1.
Kernel Markers. Ceux-ci d´ependent du m´ecanisme de synchronisation RCU de mani`ere
extensive pour assurer la coh´erence des donn´ees pointant vers les fonctions de rappels. L’ex´ecution de ces primitives implique donc l’utilisation d’un verrou en lecture RCU, lequel est sans attente et pouvant ˆetre mis `a l’´echelle lin´eairement.
Afin de minimiser l’impact sur l’ex´ecution du noyau Linux lorsque l’instrumen-tation est d´esactiv´ee, j’ai cr´e´e le m´ecanisme Immediate Values, lequel permet l’acti-vation de branchements en proc´edant `a la modification dynamique d’instructions `a l’ex´ecution. Celui-ci se base sur une technique de d´etournement de l’ex´ecution par
breakpoint combin´e avec une synchronisation des processeurs par interruption
inter-processeurs, ce qui permet de conserver la caract´eristique de r´eentrance.
La source de temps utilis´ee est une lecture directe du compteur de cycles lorsque celui-ci est disponible. Cependant, lorsqu’il est n´ecessaire de compl´eter l’information de temps lue du mat´eriel par de l’information compl´ementaire dans une structure de donn´ees en m´emoire, il faut ´egalement proc´eder `a une synchronisation des acc`es `a cette structure. J’ai donc cr´e´e un m´ecanisme de gestion d’horloge de tra¸cage permettant l’ extension d’un compteur de cycles limit´e `a 32 bits vers un compteur 64-bit complet en utilisant une technique bas´ee sur les RCU. Ceci permet donc d’acc´eder `a une base de temps sans toutefois perdre les propri´et´es recherch´ees, puisqu’un simple verrou en lecture RCU est requis.
Les acc`es aux structures de donn´ees de contrˆole du tra¸cage sont ´egalement synchro-nis´es par le m´ecanisme de RCU, ce qui permet d’alt´erer le comportement du tra¸cage alors que celui-ci est en cours d’ex´ecution tout en conservant l’ensemble des propri´et´es recherch´ees.
Finalement, un composant d’importance majeure, duquel LTTng est form´e, est le m´ecanisme de synchronisation de tampons. Celui-ci g`ere l’´ecriture de donn´ees dans un tampon partag´e entre contextes d’ex´ecution. Il est donc impossible d’utiliser un verrou en lecture RCU pour cette synchronisation, puisqu’il s’agit ici de synchroniser des ´ecritures.
En s’assurant que chaque composant du traceur respecte les propri´et´es recherch´ees, on d´emontre, par construction, que le traceur dans son ensemble les respecte ´egalement.
L’exp´erimentation r´ealis´ee afin de s’assurer du respect des propri´et´es d’impact sur la mise `a l’´echelle, le d´ebit, la latence moyenne, la r´eentrance et le comportement temps-r´eel est appliqu´ees au m´ecanisme RCU ainsi qu’`a la synchronisation de tam-pons. Ceci permet de s’assurer du respect des propri´et´es pour chaque composant.
Cette exp´erimentation utilise deux approches : les bancs d’essai, pour les mesures de performances, et la v´erification formelle par model-checking, pour proc´eder `a la v´erification des propri´et´es de r´eentrance et de comportement temps-r´eel.
Les bancs d’essais r´ealis´es visent `a mesurer l’impact sur la mise `a l’´echelle, le d´ebit et la latence moyenne du syst`eme d’exploitation.
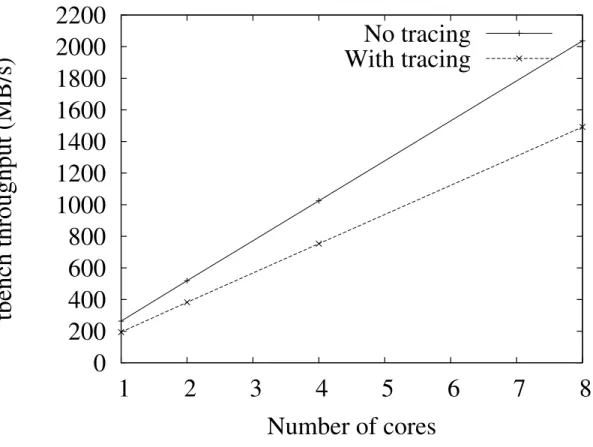
Un premier banc d’essai mesure la diff´erence de d´ebit d’une charge de travail offrant initialement de bonnes caract´eristiques de mise `a l’´echelle avec et sans tra¸cage. Les r´esultats obtenus sont que le d´ebit augmente de mani`ere lin´eaire avec et sans tra¸cage de 1 `a 8 nœuds, ce qui d´emontre la pr´eservation de la caract´eristique de mise `a l’´echelle de l’ensemble des m´ecanismes utilis´es par le traceur. Des bancs d’essais sp´ecialis´es ont ´egalement permis de v´erifier la mise `a l’´echelle lin´eaire des primitives de synchronisation en lecture RCU sur des configurations variant de 1 `a 64 nœuds.
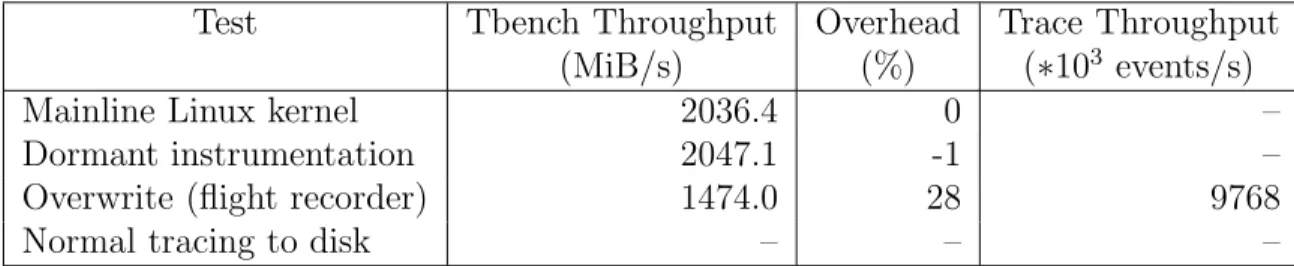
Un deuxi`eme ensemble de bancs d’essais vise `a d´eterminer l’impact sur le d´ebit pouvant ˆetre soutenu par le syst`eme d’exploitation. L’ex´ecution de charges de travail r´eseau, disque et de calcul mesurant le d´ebit du syst`eme d’exploitation ou le temps requis pour effectuer une mˆeme tˆache permet de caract´eriser ce d´ebit. La compara-ison des mesures avec et sans tra¸cage permet de connaˆıtre l’impact du traceur sur ce d´ebit. Dans des conditions d’ex´ecution typique `a haute fr´equence d’´ev´enements, le ralentissement du d´ebit syst`eme est, au plus, de 6%. Dans des cas extrˆemes, le ralentissement peut atteindre 35%.
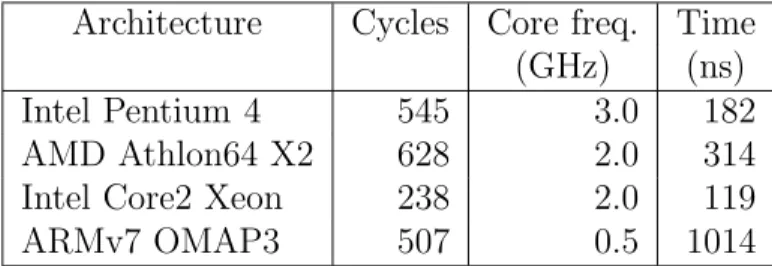
Une troisi`eme s´erie de bancs d’essais a pour but de mesurer l’impact du tra¸cage d’un ´ev´enement sur la latence moyenne du syst`eme d’exploitation. Cette s´erie de bancs d’essais se subdivise en deux sous-parties : l’´etude de la latence li´ee au traceur lorsque celui-ci est pr´esent en ant´em´emoire, ainsi que l’´etude comparative de latence en fonctionnement normal avec une charge de travail en bruit de fond. Ceci a pour objectif de tenir compte des effets de cache dans l’analyse de l’impact en latence. Sur une architecture Intel Xeon dot´e d’une fr´equence d’horloge de 2.0 GHz, on obtient comme r´esultats que le traceur a un impact sur la latence de 119 ns par ´ev´enement lorsque le traceur est pr´esent en ant´em´emoire et de 333 ns par ´ev´enement pour tracer une charge de travail standard.
Le second plan d’exp´erimentation est la v´erification formelle d’une mod´elisation des algorithmes RCU et de synchronisation des tampons LTTng. Ce volet a pour objectif la v´erification du bon fonctionnement de ces algorithmes (absence de corruption) ainsi que la v´erification du progr`es (absence de famine).
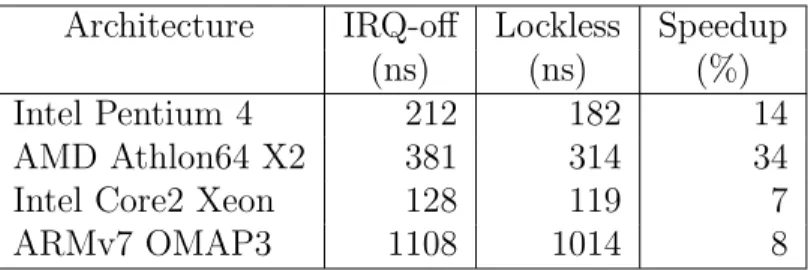
L’impact d’algorithmes sur le comportement temp-r´eel peut se classer selon qu’ils soient bloquants ou non-bloquants. Dans la classe des algorithmes non-bloquants, on retrouve, en ordre croissant de garanties temps-r´eel, les algorithmes sans obstruction, sans verrou et sans attente. Les cat´egories d’int´erˆet dans notre cas sont les algorithmes sans verrou et sans attente. Un algorithme sans verrou assure un progr`es global du syst`eme, alors qu’un algorithme sans attente assure le progr`es de chaque processus consid´er´e dans le syst`eme.
La v´erification de mod`eles de synchronisation de tampons LTTng impliquant plusieurs ´ecrivains, ainsi que la pr´esence d’´ecrivains et de lecteurs, permet de confirmer que l’al-gorithme de synchronisation de LTTng est sans attente pour les ´ecrivains. C’est-`a-dire que ni un lecteur, ni un autre ´ecrivain concurrent ne peut causer la famine d’un ´ecrivain. Cette propri´et´e s’applique aux implantations noyau, puisqu’il est possible de d´esactiver l’ordonnanceur. Il est ´egalement d´emontr´e que l’impossibilit´e de d´esactiver l’ordonnanceur en espace usager ´elimine la garantie de type “sans attente”, rendant une telle implantation seulement “sans verrou”, puisqu’il devient possible pour un ´ecrivain concurrent de causer la famine d’un autre ´ecrivain.
La v´erification d’un mod`ele adapt´e aux primitives de synchronisation RCU permet de s’assurer qu’un lecteur RCU est ´egalement sans attente.
L’impact sur la r´eentrance du traceur est v´erifi´e `a l’aide des mod`eles d’ex´ecution de processus concurrents utilis´es pour v´erifier le comportement correct et l’absence d’interblocage lors de l’ex´ecution de paires de processus. Ceux-ci couvrent les cas d’ex´ecution de multiples interruptions entre deux ´etapes atomiques, ce qui permet d’assurer l’absence d’interblocage dans tous les cas. Ces mˆemes mod`eles sont utilis´es pour v´erifier l’absence de corruption caus´ee par des acc`es concurrents des tampons en ´ecriture et lecture.
Des mod`eles similaires sont utilis´es pour v´erifier les propri´et´es des m´ecanismes de synchronisation RCU. Les r´esultats d´emontrent que tant RCU que le m´ecanisme de syn-chronisation d’acc`es aux tampons de LTTng supportent la r´eentrance de gestionnaires d’interruptions NMI.
Afin d’augmenter la pr´ecision du mod`ele RCU quant `a la repr´esentation des effets d’acc`es m´emoire et d’ex´ecution faiblement ordonn´es des architectures modernes, nous avons cr´e´e deux mod`eles d’architectures : OoOmem et OoOisched. Ceci permet de v´erifier que les barri`eres m´emoires ainsi que les barri`eres restreignant les optimisations du compilateur sont ad´equates en v´erifiant toutes les traces possibles d’ex´ecution
respectant les contraintes exprim´ees dans le mod`ele.
Le d´eploiement et l’exp´erimentation sur les architectures Intel 32/64-bit, Pow-erPC 32/64-bit, ARM, MIPS, Sparc64 ainsi que les contributions externes pour SH, S/390 ainsi que S/390x permettent de confirmer la portabilit´e de LTTng. Les proto-types de tra¸cage rapide en espace usager et pour l’hyperviseur Xen que j’ai r´ealis´es d´emontrent ´egalement la portabilit´e et la r´eutilisabilit´e des algorithmes cr´e´es dans des environnements d’ex´ecution vari´es.
Puisque chacune des composantes satisfait les propri´et´es recherch´ees, que ce soit en utilisant RCU pour la synchronisation ou bien le m´ecanisme de synchronisation de tampons pour l’´ecriture, nous pouvons affirmer, par construction, que le traceur respecte toutes les propri´et´es recherch´ees.
La satisfaction de ces propri´et´es ouvre des champs d’utilisations diversifi´es. La discussion qui suit fait le lien entre chacune des propri´et´es et les champs d’applica-tions cibl´es. Les propri´et´es de faible impact sur les performances (latence, d´ebit et mise `a l’´echelle lin´eaire) ciblent les serveurs commerciaux qui n´ecessitent une surveil-lance constante du bon fonctionnement des syst`emes en production utilisant Linux. Ceci permet `a des compagnies comme Google d’identifier plus ais´ement la cause de probl`emes de fonctionnement et de performance. Cependant, pour laisser un traceur actif en tout temps sur ces serveurs op´erationnels en production, il faut avoir un impact minimal sur leurs performances. Des besoins similaires sont ´evoqu´es dans les applications `a contraintes de temps douces chez Autodesk, lequels utilisent actuelle-ment LTTng. Ericsson collaborent pour rendre LTTng utilisable dans leurs syst`emes de t´el´ecommunication. Les d´eveloppeurs de Siemens d´ependent ´egalement, de leur cˆot´e, de LTTng pour certains de leurs produits sous Linux.
Les garanties r´eel permettent ´egalement au domaine des syst`emes temps-r´eel d’utiliser le traceur LTTng pour des fins de d´everminage et d’analyse des syst`emes comportant des contraintes de temps. C’est ce que font actuellement les distributions Linux de Wind River, Monta Vista et STLinux en int´egrant LTTng comme outil de tra¸cage `a leur distribution visant le march´e temps-r´eel. Ils permettent ainsi `a leurs utilisateurs d’obtenir une information sur le comportement du syst`eme d’exploita-tion similaire `a ceux retrouv´es dans les autres syst`emes d’exploitad’exploita-tion temps-r´eels usuels. La portabilit´e du traceur LTTng permet son int´egration dans la plate-forme de d´eveloppement Maemo pour les t´el´ephones cellulaires et tablettes Internet de Nokia. La r´eentrance accrue du traceur b´en´eficie `a la communaut´e de d´eveloppeurs Linux,
leur permettant d’ajouter des points d’instrumentation sans se soucier de l’interaction du traceur avec le site instrument´e. Ceci b´en´eficie ´egalement aux utilisateurs Linux, les assurant que leur noyau ne cessera pas de fonctionner lors qu’ils activent le traceur. Ceci leur permet d’avoir une infrastructure de tra¸cage en laquelle ils peuvent avoir confiance.
Toutes ces applications de LTTng d´emontrent qu’il remplit un besoin de tra¸cage noyau `a faible impact dans plusieurs champs d’application de l’industrie. Une cons´e-quence de cette recherche est donc d’am´eliorer les infrastructures de d´everminage pour les syst`emes multi-cœurs, rendant disponible un outil qui permet de trouver les goulots d’´etranglement de performance. Ceci permet une acc´el´eration des applications en trouvant toutes sortes d’utilisations inefficaces des ressources, ce qui aide `a am´eliorer le temps de r´eponse, la r´eponse temps-r´eel, le d´ebit syst`eme ainsi que l’efficacit´e ´energ´etique des syst`emes.
Cette recherche a eu des impacts autres que ceux directement reli´es au traceur LTTng. Les Local Atomic Operations, Kernel Markers et Tracepoints ont chacun con-tribu´e `a d’autres champs d’application et d’autres projets. Le tra¸cage de l’espace usager, bien que p´eriph´erique `a la cible principale de cette recherche, a ´et´e un champs dans lequel nous avons ´egalement innov´e. Au niveau de la contribution scientifique, 5 articles provenant d’auteurs externes ayant utilis´e LTTng dans leur exp´erimentation ont ´et´e r´epertori´es `a ce jour. Dans ces articles, LTTng a ´et´e utilis´e `a des fins vari´ees, en permettant l’analyse de la consommation de puissance de pilotes, l’analyse des habitudes des utilisateurs et l’analyse de la pr´ecision des sources de temps.
La principale r´ealisation de cette recherche est la cr´eation d’algorithmes de syn-chronization novateurs rendant possible l’implantation du traceur LTTng pour le syst`eme d’exploitation Linux. Ce traceur satisfait les propri´et´es de faible impact sur la mise `a l’´echelle, le d´ebit et la latence moyenne du syst`eme d’exploitation, d’impact d´eterministe sur la r´eponse temps-r´eel, de portabilit´e vers des architectures vari´ees et un haut niveau de r´eentrance. Des bancs d’essais en performance et la v´erification formelle ont d´emontr´e que chaque composant du traceur satisfait ces propri´et´es. Ainsi, le traceur LTTng r´epond `a des requis auxquels ses pr´ed´ecesseurs ne r´epondaient que partiellement, ce qui rend possible le tra¸cage du syst`eme d’exploitation Linux, dont la flexibilit´e permet son utilisation dans un large spectre de champs d’application.
Il a ´et´e possible d’atteindre ces objectifs en proc´edant `a un choix parcimonieux, `a l’´elaboration et `a l’implantation de m´ecanismes de synchronisation : RCU pour la
syn-chronisation en lecture et le m´ecanisme de synsyn-chronisation de tampons de LTTng pour l’´ecriture. Les algorithmes utilis´es dans ces deux m´ecanismes garantissent une mise `a l’´echelle lin´eaire et la non-attente, caract´eristiques utiles pour le tra¸cage de syst`emes multi-cœurs ainsi que pour assurer un comportement temps-r´eel d´eterministe et une r´eentrance compl`ete.
La r´eponse appropri´ee aux requis de tra¸cage de l’industrie et de la communaut´e du logiciel libre est d´emontr´ee par le fait que divers composants de tra¸cages que nous avons cr´e´e, les Tracepoints et Linux Kernel Markers, sont int´egr´es au noyau Linux et que le traceur LTTng b´en´eficie d’une large communaut´e d’utilisateurs et contribu-teurs, en particulier Google, IBM, Ericsson, Autodesk, Wind River, Fujitsu, Monta Vista, STMicroelectronics, C2 Microsystems, Sony, Siemens, Nokia et Recherche et d´eveloppement pour la d´efense Canada.
En conclusion de cette recherche, nous pouvons affirmer que le tra¸cage de charges de travail importantes sur un syst`eme d’exploitation `a usage g´en´eral s’ex´ecutant sur des architectures multi-cœurs peut ˆetre accompli en n’utilisant qu’une fraction du d´ebit et en n’augmentant la latence du syst`eme que faiblement, tout en conservant compl`etement la mise `a l’´echelle, la r´eponse temps-r´eel, la portabilit´e et la r´eentrance du syst`eme d’exploitation. L’implantation r´ealis´ee permet une couverture d’instru-mentation du noyau dans son ensemble, incluant les gestionnaires d’interruptions non-masquables (NMIs).
L’analyse de traces du syst`eme dans son ensemble implique la collecte de traces `a partir tant du noyau que de l’espace usager. Suite aux r´esultats prometteurs des prototypes de tra¸cage usager r´ealis´es, il est maintenant temps de stabiliser une telle infrastructure afin de permettre un tra¸cage usager d’un niveau utilisable en production sous Linux.
Les charges de travail qui peuvent maintenant ˆetres trac´ees sur des syst`emes en production permet la collecte d’information menant `a l’analyse et la r´esolution de probl`emes en comportement et en performance dans les syst`emes complexes actuels. It sera int´eressant d’explorer les analyses rendues possibles par une mod´elisation du syst`eme d’exploitation orient´ee par les donn´ees extraites par LTTng.
Vu son utilit´e dans le cadre de l’observation de syst`emes, de l’identification de goulots d’´etranglement en performance et en d´everminage, la d´ecision d’activer un traceur en tout temps sur des syst`emes en production devient naturelle pour les d´eveloppeurs syst`eme si la p´enalit´e en performance est assez faible. Cette recherche
d´emontre clairement que l’impact du traceur LTTng, lorsqu’activ´e, est assez faible pour permettre son utilisation sur des syst`emes en production faisant face `a des charges de travail ´elev´ees, sans pour autant diminuer les performances de mani`ere prohibitive.
Contents
Dedication . . . iii Acknowledgements . . . iv Abstract . . . v R´esum´e . . . vii Condens´e en fran¸cais . . . ix Contents . . . xx List of Tables . . . xxvList of Figures . . . xxvii
List of Algorithms . . . xxix
List of Signs and Abbreviations . . . xxx
Chapter 1 Introduction . . . 1
1.1 Theoretical Framework . . . 1
1.2 Problem . . . 3
1.3 Hypothesis . . . 4
1.4 Objectives . . . 4
1.5 Claim for Originality . . . 4
1.6 Outline . . . 5
Chapter 2 State of the Art . . . 7
2.1 Computer Architecture . . . 7
2.1.1 Parallelism . . . 7
2.1.2 Memory Access . . . 8
2.1.3 Software-Level Support for Multiprocessing . . . 9
2.3 Distributed Systems . . . 11
2.4 Commercial Servers . . . 12
Chapter 3 Methodology . . . 13
3.1 Interaction with the community . . . 14
3.1.1 Tracing in the Industry . . . 15
3.1.2 Tracing in the Open-Source Community . . . 16
3.1.3 Authored publications . . . 16 3.1.4 Co-authored publications . . . 17 3.2 Tracer Architecture . . . 17 3.2.1 Overview . . . 17 3.2.2 Instrumentation . . . 19 3.2.3 Synchronization Primitives . . . 21 3.2.4 Buffering . . . 21 3.2.5 Read-Copy Update . . . 22 3.3 Experimentation . . . 23 3.3.1 Benchmarks . . . 23 3.3.2 Formal Verification . . . 24
Chapter 4 Paper 1: Synchronization for Fast and Reentrant Operating System Kernel Tracing . . . 25
4.1 Abstract . . . 25
4.2 Introduction . . . 25
4.3 Introduction to Tracing . . . 27
4.4 State of the Art . . . 28
4.5 Linux Trace Toolkit Next Generation . . . 34
4.6 Tracing Synchronization . . . 35
4.6.1 Atomic Primitives . . . 35
4.6.2 Recursion with the Operating System Kernel . . . 38
4.6.3 Timekeeping . . . 39
4.7 Benchmarks . . . 46
4.8 Least Priviledged Execution Contexts . . . 50
Chapter 5 Paper 2: Lockless Multi-Core High-Throughput Buffering Scheme for Kernel Tracing . . . 57 5.1 Introduction . . . 58 5.2 State of the art . . . 59 5.3 Design of LTTng . . . 62 5.3.1 Components overview . . . 63 5.3.2 Channels . . . 65 5.3.3 Control . . . 66 5.3.4 Probe Data Flow . . . 67 5.4 Atomic Buffering Scheme . . . 69 5.4.1 Atomic data structures . . . 70 5.4.2 Equations . . . 72 5.4.3 Algorithms . . . 75 5.4.4 Memory Barriers . . . 83 5.4.5 Buffer allocation . . . 85 5.5 Experimental results . . . 86 5.5.1 Methodology . . . 86 5.5.2 Probe CPU-cycles overhead . . . 87 5.5.3 tbench . . . 88 5.5.4 Scalability . . . 89 5.5.5 dbench . . . 89 5.5.6 lmbench . . . 91 5.5.7 gcc . . . 92 5.5.8 Comparison . . . 93 5.6 Conclusion . . . 95 Chapter 6 Paper 3: User-Level Implementations of Read-Copy Update . . . 97 6.1 Introduction . . . 97 6.2 Brief Overview of RCU . . . 99 6.2.1 Conceptual View of RCU Algorithms . . . 99 6.2.2 User-Space RCU Desiderata . . . 101 6.2.3 RCU Deletion From a Linked List . . . 102 6.2.4 Overview of RCU Semantics . . . 104 6.3 User-Space RCU Usage Scenarios . . . 106
6.4 Classes of RCU Implementations . . . 107 6.4.1 Notation . . . 107 6.4.2 Quiescent-State-Based Reclamation RCU . . . 109 6.4.3 General-Purpose RCU . . . 112 6.4.4 Low-Overhead RCU Via Signal Handling . . . 117 6.4.5 Wait-Free RCU Updates . . . 123 6.5 Experimental Results . . . 124 6.5.1 Scalability . . . 125 6.5.2 Read-Side Critical Section Length . . . 126 6.5.3 RCU Grace-Period Batch Calibration . . . 128 6.5.4 Update Overhead . . . 129 6.6 Conclusions . . . 132 Acknowledgement . . . 134 Legal Statement . . . 134 Chapter 7 Paper 4: Multi-Core Systems Modeling for Formal Verification of
Parallel Algorithms . . . 135 7.1 Introduction . . . 135 7.2 Modeling Challenges . . . 136 7.3 Modeling and Model-Checking . . . 137 7.3.1 LTL Model-Checking . . . 137 7.3.2 Introduction to Parallel Algorithm Modeling . . . 139 7.4 Weakly-Ordered Memory Framework . . . 142 7.4.1 Architecture . . . 142 7.4.2 Testing . . . 145 7.5 Out-of-Order Instruction Scheduling Framework . . . 146 7.5.1 Architecture . . . 146 7.5.2 Testing . . . 149 7.6 Read-Copy Update Algorithm Modeling . . . 155 7.6.1 State-Space Compression . . . 160 7.6.2 RCU Model-Checking Results . . . 161 7.6.3 RCU Verification Discussion . . . 166 7.7 Framework Discussion . . . 167 7.8 Conclusion . . . 168
Acknowledgement . . . 169 Legal Statement . . . 169 Chapter 8 Complementary Results . . . 170 8.1 Kernel Markers . . . 170 8.2 Tracepoints . . . 171 8.3 Immediate Values . . . 172 8.4 Analysis of LTTng Latency Impact . . . 173 8.5 Analysis of LTTng Real-Time Impact . . . 175 8.6 Formal verification of LTTng . . . 177 8.6.1 Modeling . . . 178 8.6.2 Correctness . . . 179 8.6.3 Real-Time Impact . . . 180 8.7 Reentrancy . . . 182 Chapter 9 General Discussion . . . 184 9.1 Tracer Properties . . . 184 9.2 Tracer Application Domains . . . 185 9.3 Contributions . . . 187 9.3.1 Local Atomic Operations . . . 187 9.3.2 Kernel Markers . . . 188 9.3.3 Tracepoints . . . 188 9.3.4 Fast User-space Tracing . . . 189 9.4 Scientific Studies Using LTTng . . . 190 Chapter 10 Conclusion and Recommendations . . . 191 List of References . . . 193
List of Tables
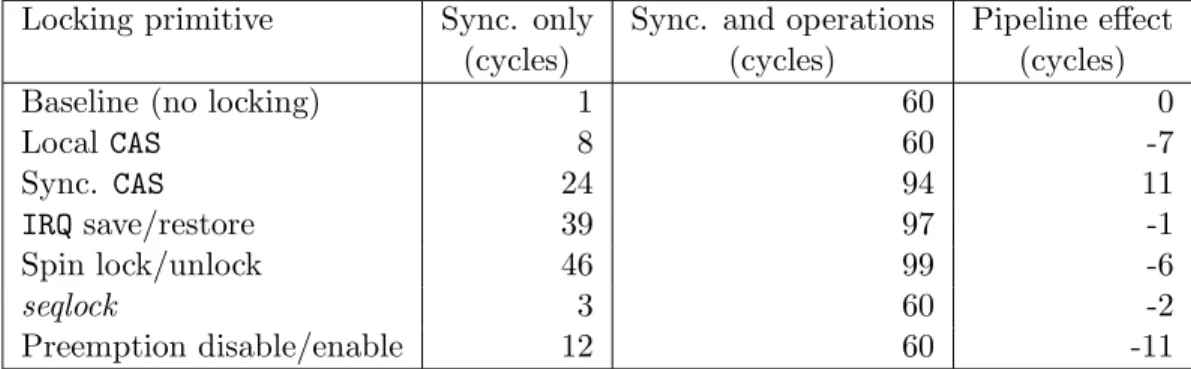
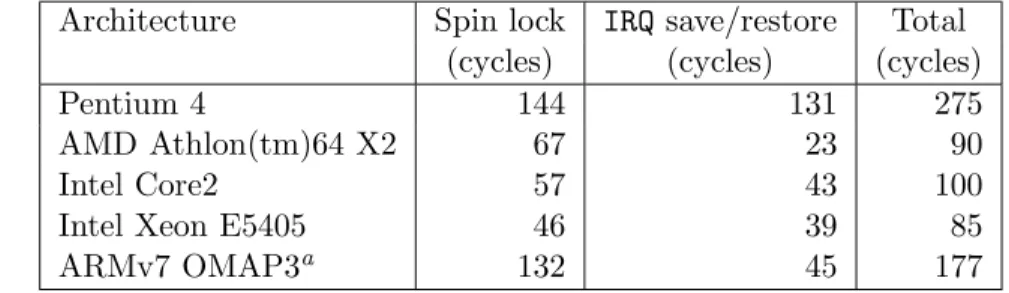
Table 4.1 Benchmark comparison between locking primitives and added inner operations, on Intel Xeon E5405 . . . 52 Table 4.2 Cycles taken to execute CAS compared to interrupt disabling . 53 Table 4.3 Breakdown of cycles taken for spin lock disabling interrupts . 54 Table 4.4 Breakdown of cycles taken for using a read seqlock and using a
synchronized CAS . . . 55 Table 4.5 Breakdown of cycles taken for disabling preemption and using
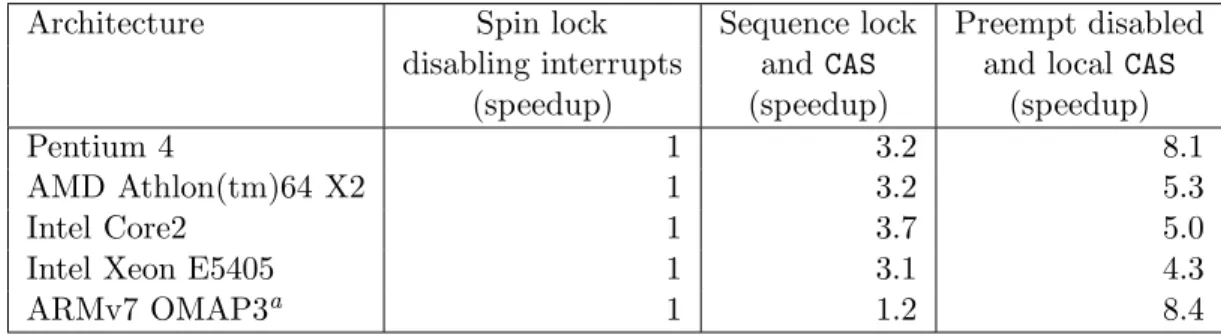
a local CAS . . . 56 Table 4.6 Speedup of tracing synchronization primitives compared to
dis-abling interrupts and spin lock . . . 56 Table 5.1 Cycles taken to execute a LTTng 0.140 probe, Linux 2.6.30 . . 87 Table 5.2 tbench client network throughput tracing overhead . . . 88 Table 5.3 tbench localhost client/server throughput tracing overhead . . 89 Table 5.4 dbench disk write throughput tracing overhead . . . 90 Table 5.5 Linux kernel compilation tracing overhead . . . 93 Table 5.6 Comparison of lockless and interrupt disabling LTTng probe
ex-ecution time overhead, Linux 2.6.30 . . . 94 Table 7.1 General-purpose RCU verification results for the Alpha
architec-ture . . . 162 Table 7.2 General-purpose RCU verification results for the Intel/PowerPC
architectures . . . 163 Table 7.3 Signal-based RCU verification results for the Alpha architecture 163 Table 7.4 Signal-based RCU verification results for the Intel/PowerPC
ar-chitectures . . . 164 Table 7.5 General-purpose RCU signal-handler reader nested over reader
verification (no instruction scheduling) . . . 165 Table 7.6 General-purpose RCU signal-handler reader nested over updater
verification (no instruction scheduling) . . . 165 Table 8.1 Tracer latency overhead for a ping round-trip. Local host,
Table 8.2 Tracer latency overhead for a ping round-trip. 100 Mb/s net-work, tracing receiver host only, Linux 2.6.30.9, 100,000 re-quests sample, at 2 ms interval . . . 175
List of Figures
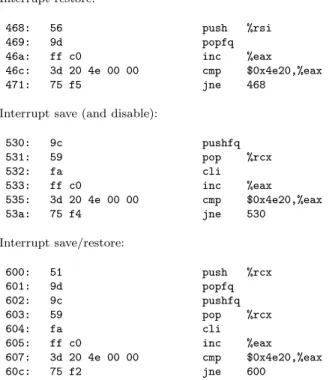
Figure 0.1 Sch´ema fonctionnel de la sonde LTTng . . . xii Figure 3.1 Tracer architecture diagram . . . 18 Figure 4.1 Trace clock read (no 32nd bit overflow) . . . . 42 Figure 4.2 Trace clock read (32nd bit overflow) . . . . 42 Figure 4.3 Trace clock update (1, 3, 4) interrupted by a read (2) . . . 42 Figure 4.4 Synthetic clock read-side . . . 43 Figure 4.5 Synthetic clock periodic update . . . 45 Figure 4.6 Assembly listings for Intel Xeon benchmarks (CAS loop content) 52 Figure 4.7 Assembly listings for Intel Xeon benchmarks (interrupt
save/res-tore loop content) . . . 53 Figure 4.8 Assembly listings for Intel Xeon benchmarks (spin lock loop
content) . . . 54 Figure 4.9 Assembly listings for Intel Xeon benchmarks (sequence lock and
preemption disabling loop content) . . . 55 Figure 5.1 Tracer components overview . . . 64 Figure 5.2 Channel components . . . 66 Figure 5.3 Probe data flow . . . 68 Figure 5.4 Producer-consumer synchronization . . . 71 Figure 5.5 Write and read counter masks . . . 74 Figure 5.6 Commit counter masks . . . 75 Figure 5.7 Impact of tracing overhead on localhost tbench workload
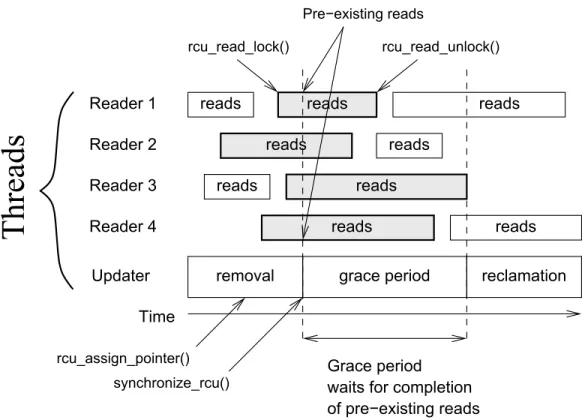
scal-ability . . . 90 Figure 6.1 Linux-kernel usage of RCU . . . 99 Figure 6.2 Schematic of RCU grace period and read-side critical sections 100 Figure 6.3 RCU linked-list deletion . . . 103 Figure 6.4 RCU read side using quiescent states . . . 108 Figure 6.5 RCU update side using quiescent states . . . 110 Figure 6.6 RCU read side using memory barriers . . . 113 Figure 6.7 RCU update side using memory barriers . . . 114 Figure 6.8 RCU read side using signals . . . 118
Figure 6.9 RCU signal handling . . . 119 Figure 6.10 RCU update side using signals . . . 121 Figure 6.11 Avoiding update-side blocking by RCU . . . 123 Figure 6.12 Read-side scalability of various synchronization primitives,
64-core POWER5+ . . . 125 Figure 6.13 Read-side scalability of mutex and reader-writer lock, 64-core
POWER5+ . . . 126 Figure 6.14 Impact of read-side critical section length, 8-core Intel Xeon,
logarithmic scale . . . 127 Figure 6.15 Impact of read-side critical section length, 8 reader threads on
POWER5+, logarithmic scale . . . 128 Figure 6.16 Impact of read-side critical section length, 64 reader threads on
POWER5+, logarithmic scale . . . 129 Figure 6.17 Impact of grace-period batch-size on number of update
opera-tions, 8-core Intel Xeon, logarithmic scale . . . 130 Figure 6.18 Impact of grace-period batch-size on number of update
opera-tions, 64-core POWER5+, logarithmic scale . . . 130 Figure 6.19 Update overhead, 8-core Intel Xeon, logarithmic scale . . . 131 Figure 6.20 Impact of pointer exchange on update overhead, 8-core Intel
Xeon, logarithmic scale . . . 132 Figure 6.21 Update overhead, 64-core POWER5+, logarithmic scale . . . 133 Figure 6.22 Impact of pointer exchange on update overhead, 64-core
POW-ER5+, logarithmic scale . . . 134 Figure 7.1 Promela model for PowerPC spinlock . . . 140 Figure 7.2 Diagram representation of PowerPC spinlock model . . . 141 Figure 7.3 Diagram representation of Intel ticket spinlock model . . . 143 Figure 7.4 Out-of-order instruction scheduling and memory frameworks
promela test code, Processor A . . . 151 Figure 7.5 Instruction dependencies of out-of-order instruction scheduling
and memory framework test . . . 152 Figure 7.6 Instruction dependencies of out-of-order instruction scheduling
and memory framework test (error injection) . . . 153 Figure 7.7 Schematic of RCU grace period and read side critical sections 157
List of Algorithms
Algorithm 5.1 TryReserveSlot(payload size) . . . . 77 Algorithm 5.2 ReserveSlot(payload size) . . . . 78 Algorithm 5.3 CommitSlot(slot size, slot offset) . . . . 78 Algorithm 5.4 ForceSwitch() . . . 80 Algorithm 5.5 ReadPoll() . . . 81 Algorithm 5.6 ReadGetSubbuf() . . . 82 Algorithm 5.7 ReadPutSubbuf(arg read count) . . . . 82 Algorithm 5.8 AsyncWakeupReadersTimer() . . . 84
List of Signs and Abbreviations
API Application Programming Interface BIOS Basic Input/Output System
BDD Binary Decision Diagram CAS Compare-And-Swap
CISC Complex Instruction Set Computer CPU Central Processing Unit
DFA Deterministic Finite Automaton GNU GNU’s Not Unix
GPL GNU General Public License GPS Global Positioning System HTM Hardware Transactional Memory IBM International Business Machines IRQ Interrupt Request
IPI Interprocessor Interrupt I/O Input/Output
KVM Kernel-based Virtual Machine LGPL GNU Lesser General Public License LTL Linear Temporal Logic
LTTng Linux Trace Toolkit Next Generation LTTV Linux Trace Toolkit Viewer
Mutex Mutual exclusion
MPI Message Passing Interface NAND Not AND
NMI Non-Maskable Interrupt
NOR Not OR
NUMA Non-Uniform Memory Access OS Operating System
POSIX Portable Operating System Interface for Unix QSBR Quiescent-State Based Reclamation
RCU Read-Copy Update
RT Real-Time
RTAI Real-Time Application Interface RISC Reduced Instruction Set Computer RP Relativistic Programming
RPC Remote Procedure Call SMP Symmetric Multiprocessing SPE Synergistic Processing Element STM Software Transactional Memory TLS Thread-Local Storage
Chapter 1
Introduction
Growth in hardware and software complexity that industry of software develop-ment must cope with now turns debugging and performance monitoring into increas-ingly challenging tasks. The need for global system-wide problem diagnosis facilities emerges, but their associated high performance impact is usually frowned upon. This compromises their deployment on production systems, where processor time and in-put/output bandwidth must be fully utilized by the workload.
This increase in complexity and size has been a steady trend in computers since their appearance. At the hardware-level, multiprocessor systems become increas-ingly large and interconnection buses become more complex. At the software-level, operating system (OS), library, virtual machine and application layers contribute to this complexity. As a result, the effective complexity that software developers have to deal with, represented by the number of interactions between components, grows even faster.
1.1
Theoretical Framework
Debugging and performance monitoring tools are needed to provide insight into component interactions, to help diagnosing issues in those large complex systems. Tracing provides insight into interactions within system components. This technique can diagnose the most difficult performance problems and bugs in software develop-ment. It can provide both high-level and detailed views of the operating system (OS) as a whole and of each of its individual subsystems. It consists in collecting event records associated with time stamps, allowing to reconstruct the trace (a sequence of events) in the order events occurred. The major drawback of this technique is its heavy use of computer resources. It provides detailed system activity information, at the expense of system resources required to extract large amounts of data. As an observer, the challenge for a tracer is to minimally alter the original system behavior,
hence permitting its reproducibility when the observer is active. This technique is therefore inherently limited by the portion of system resources required to perform tracing. Using faster computers does not solve the problem: newer architectures will be expected to execute workloads faster and will create new timing conditions by allowing execution of larger workloads. As a result, faster hardware does not im-prove tracer’s ability to trace workloads, because the workload grows to fully use the available resources, mostly due to the evolution of application complexity. When supplementary computational resources are available, they will be allocated to the system’s primary purpose rather than tracing.
This research is conducted within the GNU/Linux open-source operating system, which becomes increasingly popular in the industry. It is used on a wide variety of computer systems, from small embedded devices to large multiprocessor servers. Sup-porting a broad hardware diversity makes it subject to subtle compatibility breakages with specific hardware combinations. In order to deal with the complexity of software development, the operating system is the fruit of interaction of many individuals and companies part of an active developer community. Due to the increasing complexity of the operating system, the people who understand it globally are very rare. Even kernel developers specialize in areas (e.g. memory management, thread scheduling, block device layer, ...). Solving complex subsystem interaction problems therefore becomes a hard problem not only for the Linux users, but also for its own developer community.
This research addresses the need for system-wide problem diagnosis tools, grown from the increased hardware and software complexity. It focuses on the Linux oper-ating system, a candidate already heavily used by the industry and presenting the complexity characteristics requiring such tools. The software development industry currently lacks the appropriate tools to diagnose problems requiring system-wide ob-servability of the system. Tracing fills this need due to some of its unique features. It permits diagnosing performance problems and bugs introduced by the interactions between execution layers and different subsystems. Furthermore, a post-processing analysis approach, where all collected information is made available for a posteriori analysis, is elected to permit diagnosing bugs occurring rarely, which are amongst the hardest to identify.
1.2
Problem
Tracing the Linux operating system brings many challenges, which define the major problems inherent to tracing. These challenges are caused by the need for a system observer that minimally impact the system behavior.
As an initial point, tracer CPU usage must be kept low, so the majority of the CPU time can still be available for the traced workload. Also, exporting data outside of its producing execution context involves consuming bandwidth at many levels: various levels of caches, memory, and optionally disk and network input/output. This bandwidth consumption must also be kept within fractions of the amount of bandwidth used by the operating system traced.
Characteristics met by the operating system, such as support for real-time (in-creasingly supported by Linux Preempt-RT tree) and scalability to large number of processors (4096) must also be supported by a tracer aiming to meet the requirements faced by this operating system.
At the processor level, reentrancy of tracer operations with respect with concur-rent execution contexts is required to ensure coheconcur-rent data is collected. Moreover, data gathered from multiple processors must be synchronized to keep event ordering information for a posteriori analysis.
Instrumented parts of the operating system are used as calling sites to execute tracer code. This means that instrumentation coverage is directly limited by reen-trancy of the tracer code. For example, instrumentation of kernel code executed from non-maskable interrupt (NMI) context require the tracer to be reentrant with respect to these interrupts.
Given that the kernel code executed, and thus the tracer usage, directly depends on the type of workload, it makes sense to principally consider the tracer impact on workloads representing various typical heavy system usage.
The problem studied in this work is the extraction of tracing data from an op-erating system, which involves collecting data from the opop-erating system execution and streaming this information outside of the kernel. The aspects of the problem making its study worthwhile are the impacts of tracing (workload disruption) and the instrumentation coverage: which parts of the system can be instrumented.
1.3
Hypothesis
The hypothesis serving as starting point for this research is that it is possible to trace an operating system, which runs intensive workloads on large multiprocessor machines, using a small fraction of the resources, allowing to instrument any kernel and user-space code location and permitting to model the original workload behav-ior. This involves using a fraction of the operating system throughput and adding a constant small amount to its average latency, as well as preserving the following properties: scalability, real-time response, portability and reentrancy.
1.4
Objectives
The purpose of this study is to create a low-overhead, highly-reentrant and scal-able tracer for Linux, a widely used operating system. It must be scal-able to handle trace throughput generated by heavy workloads on multiprocessor systems. It must preserve, or modify within a small proportion, the Linux kernel characteristics.
The research objectives are detailed as follow:
– meet the industry and open source community tracing requirements, – create new algorithms to solve the problems identified in industry, – implement a tracer for Linux, an existent mainstream operating system, – develop each tracer component so the tracer meets properties of preserving
scalability and having a low-impact on the operating system throughput and average latency,
– guarantee a deterministic impact of tracing on real-time response, – provide high portability and reentrancy of tracer mechanisms.
1.5
Claim for Originality
The main scientific contribution of this research is the creation of original syn-chronization algorithms suitable for tracing. The new algorithms created and the application of these algorithms to tracing is detailed as follows:
– creation of a wait-free, linearly scalable, and NMI-safe kernel buffering scheme, – creation of an RCU-based trace clock permitting to atomically update current
reader execution contexts, thus offering a wait-free, linearly scalable and NMI-safe time-source,
– design of a complete kernel tracer based on wait-free, linearly scalable and NMI-safe algorithms,
– application of self-modifying code techniques to dynamically enable and disable static instrumentation, with non-measurable overhead when disabled and low overhead when enabled, allowing NMI context instrumentation (presented in Section 8.3),
– improvements to the RCU (Read-Copy Update) synchronization mechanisms for efficient execution in user-space context, specifically proposing:
1. using signal-handlers to execute memory barriers only when waiting for a grace period, allowing fast read-side,
2. using TLS (Thread-Local Storage) to perform local RCU state access effi-ciently for reader threads.
3. chaining TLS data within a doubly linked-list to create a reader thread registry, allowing to detect quiescent state with O(1) thread registration and unregistration,
– creation of a generic architecture model for formal verification of parallel algo-rithms, modeling weakly-ordered memory accesses and instruction scheduling, The careful design of synchronization primitives enables the creation of the LTTng tracer and of its components.
1.6
Outline
The state of the art is presented in Chapter 2, which focuses on the high-level aspects of tracing. The state of the art refers to each article’s state-of-the-art section for in-depth per-subject literature review. Each contains a detailed review for its specific topic.
The methodology organizing this research is presented in Chapter 3. It explains how the tracing requirements were first identified by collaborating with the indus-try. It presents the tracer architecture developed to fulfill these requirements. The instrumentation requirements are then detailed, referring to Chapter 8 for the de-tailed presentation of this work not part of the four main articles. It then depicts an
overview of the four articles.
The core of this thesis consists in four articles. Synchronization primitive choices for the kernel tracer are presented in the article “Synchronization for Fast and Reen-trant Operating System Kernel Tracing” [1], in Chapters 4. This article is currently re-submitted after revision to Software – Practice and Experience. The reviewers recommended its publication, although acceptation depends on approval of modifica-tions performed in the re-submitted version. The presentation of a lock-less buffering scheme using the results of the first article follows in the article “Lockless Multi-Core High-Throughput Buffering Scheme for Kernel Tracing” [2] in Chapter 5. It is currently submitted to ACM Transactions on Computer Systems (TOCS). Then, our implementations of the RCU (Read-Copy Update) synchronization mechanism for user-space are presented in the article “User-Level Implementations of Read-Copy Update” [3], in Chapter 6. This article is currently submitted to IEEE Transactions on Parallel and Distributed Systems (TPDS). An architecture-level model for formal parallel algorithm verification is presented in “Multi-Core Systems Modeling for For-mal Verification of Parallel Algorithms” [4], in Chapter 7. This last article is also currently submitted to IEEE TPDS.
Chapter 8 presents additional results and discusses impacts of this research which are not presented in the four main articles. This includes conference publications, contributions to open source projects and external work based on the research results. Chapter 9 discusses the results obtained from a high-level perspective. It shows links between the main results obtained in the individual articles.
Finally, the conclusion recall the progress realized, the principal research contri-butions and ends by proposing future work leveraging this research.
Chapter 2
State of the Art
This chapter first presents the major computer architecture aspects which impact the current research. Aiming at portability to different architectures implies taking into account multiprocessor system effects. Then, the main tracing systems avail-able today will be classified in categories related to their target systems: parallel, distributed or real-time systems.
The actual usage of these systems is less strictly compartmented. Parallel and dis-tributed systems have been traditionally used for scientific and engineering purposes. However, commercial uses have surpassed these fields in terms of market volume [5]. Real-time systems, on the other hand, have evolved somewhat separately from high-performance systems, filling the embedded system market. This trend is however changing, as these same tools become increasingly useful to observe high-throughput, low-latency systems, which are now required for applications such as stock exchange and search engines, which must deal with high volume of transactions having low-latency requirements. This forms the fourth category: commercial servers.
2.1
Computer Architecture
At one point, there was a large dissimilarity between general-purpose hardware and high-end multiprocessor computers. However, as commodity computers become increasingly multi-core and multi-processor, the scalability concerns become perva-sive.
2.1.1
Parallelism
Between 1990 and 2009, the parallelism level of general-purpose processors has in-creased significantly. From 1990 to 2000, instruction-level parallelism (pipelined and superscalar architectures [6]) increased the instruction execution throughput while still allowing a sequential programming paradigm, by allowing instruction execution
to complete in an order different from which they were issued as long as data depen-dencies are met.
During this phase, the complexity of operating systems grew to allow multiple tasks to share resources. Amongst them: the processor, memory, devices and shared libraries [7].
Before 2000, multiprocessor systems were less common in general-purpose com-puters. They were mostly used for servers and mainframes, which ran specialized applications. Given the important market represented by these high-end comput-ers, most operating systems were designed to support multiple processors. Then, the 2000-2009 period showed an increasing availability of multiprocessor systems in commodity hardware and an increasing use of such hardware in distributed systems, principally due to commercial applications [5, 8, 9, 10].
Hence, in 2009, an application must be multiprocessor-aware to fully use the computing power of today’s commodity hardware present in both general-purpose computers and distributed systems. The same applies to newer multi-core embedded systems such as the ARM11 MPCORE [11], which indicates that multiprocessing is increasingly pervasive. However, this comes at the cost of additional complexity.
2.1.2
Memory Access
In recent years, we have also seen the gap between the available processing power and memory bandwidth widen, the former evolving much faster than the latter, as presented in [12].
Various architectural solutions have been deployed to deal with this kind of prob-lem. The addition of an increasing number of cache layers being the primary method to help data accesses keeping up with the processor speed. Level-1, level-2 and level-3 caches are now found in processors. They accelerate data access under the condition that temporal and space locality is preserved. Given the increasing performance gap filled by these caches, locality of reference becomes an increasingly important consid-eration.
Increasing the number of cache levels is one way to deal with the ever increasing number of processors trying to access the same memory. It performs well as long as applications are providing good cache locality. An alternative solution to connect multiple cores to shared memory is Non-Uniform Memory Access (NUMA). This type
of architecture subdivides memory into regions closer to specific processors. Access to local memory is faster, but the cost is that access to remote memory is slower than machines with standard shared memory. Getting good performance on these architectures requires to adapt the operating system and applications to allocate data in memory regions close to the processor, and to take memory access locality in consideration when performing thread migration between processors.
Hence, being able to identify inefficient memory access patterns becomes increas-ingly important as memory access locality effect increases and memory layout becomes intrinsically tied to thread scheduling.
Because current architectures allow reordering of memory accesses to increase instruction-level parallelism, verification of parallel algorithms is required to ensure proper execution on parallel systems. Memory models and formal verification meth-ods are one way to achieve such verification. The background will be presented in the state of the art of the article “Multi-Core Systems Modeling for Formal Verification of Parallel Algorithms”, found in Chapter 7.
2.1.3
Software-Level Support for Multiprocessing
Some of the widely used multiprocessing libraries to develop applications include the pthread library, part of the glibc, and OpenMP, now included in the gcc com-piler. Outside of multiprocessing support added to intrinsically sequential languages like C or Fortran by added libraries, SMP support becomes increasingly integrated in languages like Java, where thread support is included in the language.
The K42 operating system is an experiment on highly-scalable OS, with built-in tracbuilt-ing support. Its tracbuilt-ing features will be detailed built-in the state of the art of the article “Lockless Multi-Core High-Throughput Buffering Scheme for Kernel Tracing”, in Chapter 5.
KTAU is a kernel tracer for the Linux operating system developed for multi-processor computers. It provides detailed per-process tracing information, but only aggregated information for system-wide tracing. It will be detailed in the state of the art of the same Chapter.
2.2
Real-time
Increase of architecture-level complexity caused by addition of parallelism and increased impact of memory access locality is a concern for real-time applications.
An application is considered as having real-time requirements when it needs a computation to be performed in a deterministically known amount of time. The throughput provided by the application, in this case, comes second to the worst-case delay the computation can afford [13, 14].
There is a major problem in terms of real-time response caused by these archi-tecture trends. While increasing the size of caches and the number of processors can help increasing the computing throughput, the side-effect of this complexity increase is that real-time response becomes harder to certify. It is affected by pipeline stalls, in-teractions between processors, and the fact that memory access delay becomes harder to predict.
Real-time requirements are usually classified under the banners “hard real-time” and “soft real-time”. At one extreme, hard real-time applications simply can’t afford to miss a deadline. This imposes strict requirements on verification and architecture behavior, where throughput is likely to be sacrificed in favor of increased determinism. At the other side of the spectrum, soft real-time applications also have real-time requirements, and would thus consider a missed deadline as a bug in the sense that it deteriorate service quality. Some of these applications could not afford to sacrifice performance because high throughput, and potentially low average latency, are parts of their requirements. Therefore, these applications will typically provide guarantees in terms of number of deadlines missed per time-period [15].
There is currently an increasing amount of such soft real-time applications used in the field. For instance, Autodesk is using a slightly customized Linux distribution to run their audio and video acquisition and edition applications [16]. Soft real-time and low-latency must however not be confused. For instance, the Google servers, answering to web search requests, must provide a low average latency response-time to their users in an effort to make their experience enjoyable. This is, in fact, slightly different from soft real-time: one slow answer once in a while can be acceptable, but their aim is to have very low average response time [17].
Some operating systems are specialized to meet hard real-time requirements [18]. This is the case of VxWorks and µC OS-II, for instance. These operating systems
are meant to provide a deterministic response time. In the hard real-time systems category, RTAI (Real-Time Application Interface) and Xenomai provide hard real-time support for user-space applications. They collaborates with a Linux kernel, but provide limited application interfaces to the real-time applications. The RT-preempt Linux kernel is derived from the standard Linux kernel. It aims at providing real-time guarantees to standard Linux applications. It modifies extensively locking primitives, interrupt handling and thread scheduling. The aim of this kernel is to provide real-time guarantees close to hard real-time, where missing a deadline is inadmissible. This comes at the cost of a significant performance regression compared to the standard mainline kernel, and is hence not yet suitable for high-throughput soft real-time applications.
Real-time systems requirements being heavily tied to the execution time, trac-ers can easily provide counter-examples showing where the system does not meet deadlines along with the faulty execution trace. This category of tool is therefore extremely useful for these systems.
Tracing tools are already widely used in the real-time field, such as the closed-source Wind River Tornado, a tracing tool embedded in the VxWorks real-time op-erating system.
Amongst the open-source tracers, the original Linux Trace Toolkit [19] is a tracer for the Linux operating system which has been made available for embedded real-time systems, including RTAI. The Ftrace Linux mainline kernel tracer evolved from the IRQ latency tracer, part of the Linux RT (Real-Time) kernel tree before the latter was integrated in the Linux mainline kernel. This tracer’s goal was specifically to identify long latencies caused by interrupt disabling. The tracers for which source-code availability allows their study are presented in the article “Lockless Multi-Core High-Throughput Buffering Scheme for Kernel Tracing”, in Chapter 5.
2.3
Distributed Systems
The growing trend of distributed systems, predicted in [5], is confirmed by their increasing use between 2000 and 2009 [9, 10], especially for large-scale indexing and query workloads.
In the scientific and engineering fields, the MPI library allows to divide a task across a group of computers using a standard message-passing programming interface
to exchange data at synchronization points. The Sun Studio Performance Analyzer and PIP [20] tracers instrument the MPI synchronization primitives and provide an insight into the workload by monitoring the exchanges between the nodes.
Commercial distributed systems are however less likely to rely on a MPI-style com-munication between the nodes. Algorithms like map-reduce [8], which reserve different roles to various nodes, including redundancy, are better suited to a RPC (Remote
Pro-cedure Call) interface. As discussed in Chapter 8, tracing the data exchanges is only
part of the equation; knowing what is happening at the system-level on a per-node basis is also required to identify the causes of performance degradations.
2.4
Commercial Servers
Linux distribution packaging companies such as Redhat aim to provide tools, to help system administrators identifying performance issues on their servers running the Redhat Enterprise distribution. SystemTAP, based on the Kprobes, Kernel Markers and Tracepoint instrumentations, is Redhat’s response to this demand. Solaris, from Sun, targets a similar market by enhancing their operating system with Dtrace, a system-wide tracer.
The main characteristic of this use-case category is to have servers running various services, which makes the task of pinpointing the source of performance slowdown across the kernel, library and application layers difficult.
This category of tracer will be studied in greater depth in the state of the art of Chapter 5, within the article “Lockless Multi-Core High-Throughput Buffering Scheme for Kernel Tracing”.