HAL Id: hal-00328380
https://hal.archives-ouvertes.fr/hal-00328380
Submitted on 7 Feb 2005
HAL is a multi-disciplinary open access
archive for the deposit and dissemination of
sci-entific research documents, whether they are
pub-lished or not. The documents may come from
teaching and research institutions in France or
abroad, or from public or private research centers.
L’archive ouverte pluridisciplinaire HAL, est
destinée au dépôt et à la diffusion de documents
scientifiques de niveau recherche, publiés ou non,
émanant des établissements d’enseignement et de
recherche français ou étrangers, des laboratoires
publics ou privés.
Tropospheric ozone over Equatorial Africa: regional
aspects from the MOZAIC data
B. Sauvage, V. Thouret, Jean-Pierre Cammas, F. Gheusi, G. Athier, P.
Nédélec
To cite this version:
B. Sauvage, V. Thouret, Jean-Pierre Cammas, F. Gheusi, G. Athier, et al.. Tropospheric ozone over
Equatorial Africa: regional aspects from the MOZAIC data. Atmospheric Chemistry and Physics,
European Geosciences Union, 2005, 5 (2), pp.335. �hal-00328380�
SRef-ID: 1680-7324/acp/2005-5-311 European Geosciences Union
Chemistry
and Physics
Tropospheric ozone over Equatorial Africa: regional aspects from
the MOZAIC data
B. Sauvage, V. Thouret, J.-P. Cammas, F. Gheusi, G. Athier, and P. N´ed´elec Laboratoire d’A´erologie, OMP, UMR 5560, Toulouse, France
Received: 9 April 2004 – Published in Atmos. Chem. Phys. Discuss.: 21 June 2004 Revised: 24 November 2004 – Accepted: 27 January 2005 – Published: 7 February 2005
Abstract. We analyze ozone observations recorded over Equatorial Africa between April 1997 and March 2003 by the MOZAIC programme, providing the first ozone climatology deriving from continental in-situ data over this region. Three-dimensional streamlines strongly suggests connections be-tween the characteristics of the ozone monthly mean vertical profiles, the most persistent circulation patterns in the tropo-sphere over Equatorial Africa (on a monthly basis) such as the Harmattan, the African Easterly Jet, the Trades and the regions of ozone precursors emissions by biomass burning. During the biomass burning season in each hemisphere, the lower troposphere exhibits layers of enhanced ozone (i.e. 70 ppbv over the coast of Gulf of Guinea in December-February and 85 ppbv over Congo in June-August). The characteris-tics of the ozone monthly mean vertical profiles are clearly connected to the regional flow regime determined by sea-sonal dynamic forcing. The mean ozone profile over the coast of Gulf of Guinea in the burning season is charac-terized by systematically high ozone below 650 hPa ; these are due to the transport by the Harmattan and the AEJ of the pollutants originating from upwind fires. The confine-ment of high ozone to the lower troposphere is due to the high stability of the Harmattan and the blocking Saharan an-ticyclone which prevents efficient vertical mixing. In con-trast, ozone enhancements observed over Central Africa dur-ing the local dry season (June-August) are not only found in the lower troposphere but throughout the troposphere. More-over, this study highlights a connection between the regions of the coast of Gulf of Guinea and regions of Congo to the south that appears on a semi annual basis. Vertical profiles in wet-season regions exhibit ozone enhancements in the lower troposphere due to biomass burning products transport from fires situated in the opposite dry-season hemisphere.
Correspondence to: B. Sauvage ([email protected])
1 Introduction
Tropospheric ozone acts both to control the oxidizing capac-ity of the atmosphere and as a greenhouse gas (Logan and Kirchhoff, 1986; Crutzen, 1987). Most of the oxidation of long-lived gases by hydroxyl radicals (OH) takes place in the tropics, where high UV and humidity promote the forma-tion of OH from the photolysis of ozone (Logan et al., 1981; Thompson, 1992). Ozone is produced within the troposphere by the photochemical oxidation of hydrocarbons, methane (CH4)and carbon monoxide (CO) in the presence of nitro-gen oxides (NOx=NO+NO2)(Crutzen, 1974, 1988; Fishman et al., 1979; Marenco et al., 1989) and is also transported down from the stratosphere. Ozone photochemical forma-tion occurs in three main ways (Logan et al., 1981, 1985): (1) a rapid formation from reactive hydrocarbons (urban pol-lution, biomass burning) close to their source, followed by its mixing within the troposphere, and (2) a slow and de-layed formation (2 or 3 weeks) from less reactive precursors, such as CO and CH4, during or after their redistribution in the troposphere by horizontal and vertical atmospheric mo-tions (Logan et al., 1981, 1985). This has been summarized as “cook then mix” or “mix then cook” by Chatfield and De-lany (1990). (3) A very slow process of production in the uppermost troposphere which results from background tro-pospheric carbon species and nitrogen oxides. The latter pro-cess can be accelerated by lightning NOxas the dry season gives way to thunderstorms of the wet season (Edwards et al., 2003; Chatfield et al., 2004). While this appears to be a non-pollution process, the organic radical producers may indeed be increased by pollution.
The first rapid process is illustrated by polluted biomass burning plumes sampled during the TROPOZ campaign showed that ozone concentrations increase from 90 to 105 ppbv after only two days (Jonquieres et al., 1998). Thus the photochemical impact of pollutants must be considered both on regional and hemispheric scales.
312 B. Sauvage et al.: Tropospheric ozone over Equatorial Africa
(a) (b)
Fig. 1. Fires counts during DJF (a) and JJA (b) from the ATSR World fire Atlas (http://shark1.esrin.esa.it/ionia/FIRE/). Average over the
years 1998 to 2002.
The equatorial African region is of great interest because of a particular combination of dynamical processes, high chemical activity from intense biomass burning. Figure 1 shows the position of the fires as seen by ATSR on board of ERS2, and averaged over the years 1998-2002, for the two dry seasons.
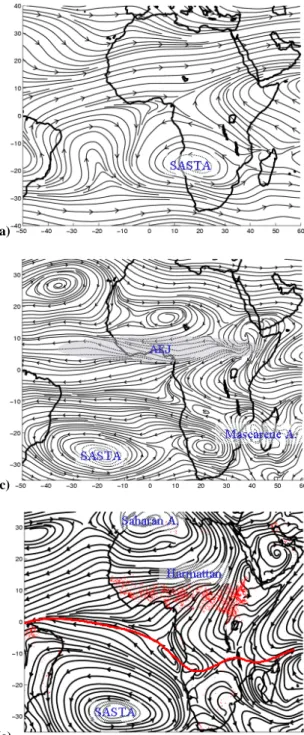
We begin with a schematic overview of the dynamical situ-ation over Africa for two opposite seasons. Figure 2 shows an example of the monthly mean streamlines from the ECMWF analyses for January and July 2002 (left and right column respectively), for three different pressure levels (250 hPa: a and b; 650 hPa: c and d; and 850 hPa: e and f). One of the main synoptic flow features is the West African monsoon; a flow from the south-west due to the strong thermal gradi-ent between contingradi-ent and ocean in boreal summer (Fig. 2f). The zone of confluence between north-easterly (Harmattan) and south-westerly trade winds is represented by the inter-continental convergence zone (hereafter, ITCZ, Figs. 2e, f, red lines) which shifts each boreal summer into the north-ern hemisphere. The African Easterly Jet (hereafter, AEJ) is a thermal wind responding to temperature gradients be-tween the warm Sahara Desert area and the cool Gulf of Guinea in southern West Africa. It is located around 700– 650 hPa (Fig. 2c). The equatorward side of the jet coincides with maximum cyclonic shear and may also be the birthplace of easterly waves which reach their maximum from May to October. Two anticyclones dominate at 500 hPa. The Saha-ran Anticyclone is centered at 15◦N–10◦E ; and the South Atlantic Subtropical Anticyclone (hereafter SASTA, or St. Helena anticyclone) is centered at 30◦S–15◦W (at 850 hPa level for both, Fig. 2e and f). These two highs migrate
syn-chronously of the ITCZ, with a northward shift during the monsoon season (JJA). They both contribute to the well de-fined and stable trade-wind inversion and the highly strati-fied nature of the atmosphere (Andreae et al., 1994). Com-pared with West Africa, East Africa exhibits slightly dif-ferent regimes due to the topography and the proximity of the Indian Ocean. Several major structural elements can be identified: the ITCZ and the Arabian and Mascarene anticy-clones. The East African low-level jet or Somali jet (Fig. 2f), originates at the north-eastern tip of Madagascar (Hastenrath, 1990); and the Tropical Easterly Jet prevails in the upper tro-posphere.
In Africa as a whole, the forest and the savannas occupy areas of 2×10⁶ and 1×10⁷km2, respectively. The annu-ally burned dry matter biomass is estimated at 1.3×10⁸tons yr−1(Delmas et al., 1991). Human activities are the primary cause of biomass burning, which serves a variety of purposes: clearing of forest and brush land for agricultural use, conver-sion of forests to agricultural and pastoral uses, energy pro-duction for cooking, heating and fuel, control of pests, in-sects and weeds, nutrient mobilization, and removal of brush and litter (Crutzen and Andreae, 1990). Biomass burning has long been recognized as a significant source of reactive species such as CO, hydrocarbons and NOx, which play an important role in the chemistry and the radiative budget of the troposphere (Crutzen et al., 1985; Crutzen and Andreae, 1990). Emissions of ozone precursors from biomass burning and their consequent photochemistry have been observed at different scales (Andreae et al., 1988, 1992; Marenco et al., 1990; Fishman et al., 1990; Jonquieres et al., 1998).
(a) (b)
(c) (d)
(e) (f)
Fig. 2. Monthly mean streamlines from the 2002 ECMWF analyses. (a) 250 hPa January, (b) 250 hPa July; (c) 650 hPa January; (d) 650 hPa
July; (e) 850 hPa Januray; (f) 850 hPa July. Main dynamical features are written in blue. ITCZ is represented by a red doted line. Red points symbolize the position of the fires in January and July (as in Fig. 1). Shaded areas symbolize the AEJ location.
However Africa remains a poorly understood and docu-mented continent. Several campaigns have been conducted within the last decades to learn more about emissions and transport of biogenic and anthropogenic trace constituents over the South Atlantic and Africa (Table 1 and references therein). These field missions focused mainly on
emis-sions from tropical ecosystems and on the photochemistry of lower and middle troposphere. The first results came from DECAFE (1988 – Congo), FOS/DECAFE (1991 Ivory Coast) followed by EXPRESSO (1996 Central Africa); and SAFARI/TRACE-A (1992–2000 Southern Africa). They provided evidence of biomass burning emissions over Africa.
314 B. Sauvage et al.: Tropospheric ozone over Equatorial Africa
Table 1. Major African campaigns wich provided in-situ ozone measurements.
Acronym Publication (Special issues; papers) Period/Place
TROPOZ I and II [J. Geophys. Res., 103 (D15), 11–22 Dec. 1987 West Africa “TROPospheric OZone Jonquieres et al., 1998] 9 January to 1 February 1991 experiment”
DECAFE [J. Geophys. Res., 97 (D6), 1992] February 1988 Congo
“Dynamique Et Chimie special issue “FOS/DECAFE 91 Northern Hemisphere Dry season Atmosph´erique en Forˆet Experiment” in J. Atmos. Chem., 1991 Ivory Coast
Equatoriale” 22 (1,2), 1–239, 1995 FOS/DECAFE [Fontan et al., 1992]
SAFARI-92/TRACE-A [J. Geophys. Res., 101 (D19), 1996] South Africa
“Transport and Atmospheric [Fishman et al., 1996] 21-09-1992 to 26-10-1992 Chemistry near the Equator-Atlantic” [Lindesay et al., 1996]
SAFARI-2000 [South African J. of Sci., August–September 1999 and 2000
“Southern African 98, 2002] Southern Hemisphere Dry season
Regional Science Initiative” special issue, J. Geophys. Res., 108 (D13), 2003 Zambia (Lusaka) Polastern cruises [1987, 1988; Smit et al.,]
1989; Weller et al., 1996]
Aerosols99 cruise [Thompson et al., 2000] January February 1999
Northern Hemisphere Dry season (New York City Cape Town)
SHADOZ [Thompson et al., 2002] from 1998 on. once a week
“Southern Hemisphere Nairobi (over Africa)
ADditional Ozonesondes”
EXPRESSO [Cautenet et al., 1999] November 1996 to December 1996
Part of DECAFE programme [Delmas et al., 1999] Central Africa
High concentrations of gases (CO, CO2, NMHC, NO and O3)and particles were observed in biomass burning plumes and haze layers occurring in the mid-troposphere (altitudes between 1 and 4 km) (Andreae et al., 1988, 1992). The role of the ITCZ in the redistribution of carbon monoxide from biomass burning near Central Africa has been demonstrated by Cautenet et al. (1999). However, only a few measure-ments were made throughout the troposphere. The few ones performed during the TROPOZ I and II campaigns confirmed that fires in northern Equatorial Africa are effective in pro-ducing large amounts of ozone with photochemical ozone formation rates of 15–35 ppbv O3.d−1in the middle tropo-sphere (Jonquieres et al., 1998). During the SAFARI 2000 experiment, the flux of organic and elemental carbon from African savannas burning was estimated at 14±1 Tg.yr−1, and the flux of nitrogen species at 2±2 Tg.yr−1with much of this pollution exported from the east coast towards the In-dian Ocean (Swap et al., 2003).
From a climatological point of view, observations of ozone over Africa are only available from satellite observations (TOMS) that can be interpreted to give a total tropospheric column ozone (Fishman and Brackett, 1997; Kim et al., 2001). There is however significant uncertainty in the tro-pospheric ozone columns products because of the very poor
sensitivity of sensors to the lower troposphere ozone, pre-sumably due to Rayleigh scattering. Even the recent TOMS product using the Scan-Angle Method overestimates clear-sky tropospheric ozone columns in areas with particular low ozone and underestimates amounts in areas with high ozone (Kim et al., 2001). Indeed the TOMS Tropical Tropospheric Ozone Content (TTOC) do not capture the seasonal maxi-mum due to biomass burning found in observations and mod-els over sub-Saharan northern Africa (Thompson et al., 2002; Martin et al., 2002). This insensitivity in the lower tropo-sphere increases the “tropical Atlantic paradox” (Thomp-son et al., 2000), i.e. the north-south gradient reversal in ozone over the tropical Atlantic during the northern African biomass burning season in December–February (DJF).
The lack of in-situ tropospheric measurements over Equa-torial Africa restricts the assessment of its regional bud-get and validation of both global models and satellite prod-ucts. The objective of this paper is to establish a climatol-ogy of tropospheric ozone (in terms of seasonal and vertical variations) over Equatorial Africa from the first regular in-situ data recorded there by the MOZAIC programme. The MOZAIC programme and the methodology will be described in Sect. 2. In accord with the climatological approach of this paper we present the data merged by region and season so as
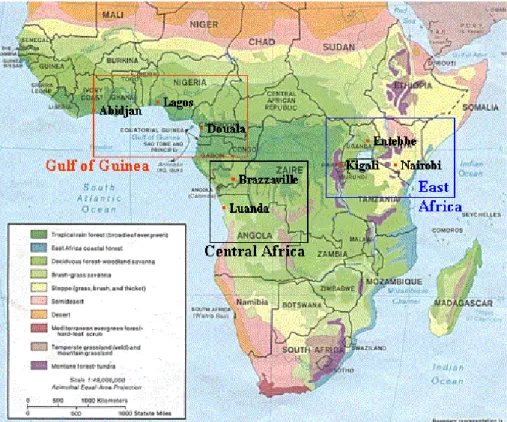
Fig. 3. Location of the most documented airports in the three different regions as defined in the text, along with the different vegetation type.
order to produce a catalogue of monthly mean vertical pro-files. Our analysis in Sect. 3 further investigates the verti-cal distributions of a set of descriptors, i.e. biomass burn-ing periods, meteorology particularities, vegetation, etc. The ozone monthly mean distributions presented here exhibit per-sistent and repetitive characteristics. We aim to establish connections between these characteristics and the most per-sistent circulation patterns in the troposphere over Equatorial Africa, such as the Harmattan, the AEJ and the Trades that have a weak variability in terms of location, on a monthly basis. For that purpose we have examined back-trajectories based on ECMWF monthly mean analyses, corresponding to 3-dimensional streamlines of a stationary flow, so as to in-vestigate such connections.
2 Data and Methodology
The MOZAIC programme (Measurement of Ozone and Wa-ter Vapor by Airbus In-Service Aircraft) was designed to col-lect ozone and water vapour data, using automatic equip-ment installed aboard 5 long range Airbus A340 aircraft flying regularly all over the world (Marenco et al., 1998; http://www.aero.obs-mip.fr/mozaic/ for more details con-cerning access and use). The programme started in 1994, and more than 20 000 flights have been already performed. The MOZAIC programme provides measurements every 4
seconds for ozone, water vapour, temperature and wind. The vertical take-off speed of the aircraft is around 5–7 m s−1, leading to a vertical resolution of the data of about 20– 28 m. For ozone a dual-beam UV absorption instrument (Thermo-Electron, model 49-103) is used, and the mea-surement accuracy was estimated at ±2 ppbv +2%; details are given in Thouret et al. (1998b). An inter-comparison with the available ozone soundings has shown the ability of the MOZAIC ozone data to produce accurate and reli-able ozone distributions (Marenco et al., 1998; Thouret et al., 1998b; http://www.aero.obs-mip.fr/mozaic/). Since the end of 2001, MOZAIC has also provided additional mea-surements of NOy on board only 1 aircraft, (Volz-Thomas et al., 2004) and CO on board all 5 aircraft (N´ed´elec et al., 2003). The data set used for this analysis corresponds to measurements of ozone and water vapour recorded between April 1997 and March 2003. We also make a specific use of the CO data recorded in January 2002 and January 2003 over Lagos.
In this paper, we use vertical profiles corresponding to takeoff and landing at 8 airports regularly visited by MOZAIC aircraft. Airports have been merged into 3 groups regarding their geographical position: Gulf of Guinea (Abid-jan, Douala and Lagos), Central Africa (Brazzaville and Lu-anda), and East Africa (Entebbe, Kigali, Nairobi). Figure 3 shows their locations on a map.
316 B. Sauvage et al.: Tropospheric ozone over Equatorial Africa
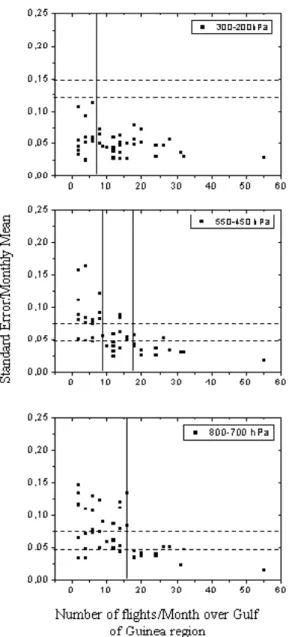
Fig. 4. Fractional standard error versus the number of flights in a
month, for the pooled data over the Gulf of Guinea region. The horizontal dashed lines are for relative standard errors of 0.05 and 0.075 for the lower and the middle troposphere (800–700 and 550– 450 hPa, respectively), and for 0.125 and 0.15 for the upper tropo-sphere. Each point is the value for a given station and given month, for one of the indicated pressure level.
To study monthly mean distributions, ozone concentra-tions have been vertically averaged into 20 layers, 12 be-tween the surface and 400 hPa with a 50 hPa thickness and 8 between 400 hPa and 200 hPa with a 25 hPa thickness. This resolution is fine enough to assess the general characteris-tics of the monthly mean distributions. We consider the air-craft measurements during ascent and descent to be vertical profiles even though there is significant (350 km) horizon-tal travel between the ground and cruising altitude.
Com-parisons with ozonesondes (which ascend more steeply than aircraft) (Thouret et al., 1998a) and lidar (which provides a two-dimensional coverage of layers) (Stoller et al., 1999) have shown that the assumption is satisfactory. Table 2 gives the number of profiles available over Equatorial Africa since April 1997 as a total and per month. Note that each region is well documented throughout the year (except East Africa from February to April).
In order to determine a reliable climatology over equa-torial Africa, we need to assess the statistical significance of our observations. The methodology is based on statisti-cal laws, like in Logan (1999) with ozonesondes data. Fig-ure 4 gives the standard error on the ozone monthly mean (SE=σ /√N, with σ the square root of the sample variance and N the number of flights) as a fraction of the monthly mean versus the number of flights per month. The 95% con-fidence intervals for the monthly means (2SE) clearly depend on both the inherent variability of ozone and the number of measurements. Logan (1999) found that in the tropics, 20 ozone soundings were required for 1 SE to be <7.5% of the mean below 500 hPa.
Applying this criterion (the 95% confidence interval) to our data set shows that only 15 measurements are required in the lower troposphere (LT) over Gulf of Guinea for 1 SE to be <5% of the mean. In the mid troposphere (MT), 18 measurements are necessary for 1 SE to be <5% and 8 for 1 SE <7.5%. This value falls to 6 measurements in the up-per middle troposphere, for 1 SE to be <12.5% of the mean, as the variability of ozone at this altitude is weaker in the tropics than mid-latitudes due the higher tropopause height that reduces the stratospheric influence. For the other re-gions (not shown) the variability is similar for each tropo-spheric level and within the sites. However fewer measure-ments are necessary for the LT and MT over Central Africa, with 12 and 7 measurements for 1 SE <5% respectively. For Central Africa in the UT, 6 measurements are required, for 1 SE <5%. This clearly shows the different degrees of vari-ability seen over Africa. The tropical region is known to be of high tropospheric ozone variability as recently shown by Thompson et al. (2003b). However, these results show that the ozone monthly means over each airport should be rep-resentative with 15 measurements over Gulf of Guinea, 13 over East Africa and 8 over Central Africa. Over the main visited cities (Brazzaville, Lagos, Abidjan), these criteria are satisfied (Table 2).
As introduced before we aim to establish connections be-tween the ozone monthly mean vertical profiles characteris-tics and the main transport processes that also have a persis-tent signature on a monthly basis. One approach could have been to use seasonal streamlines at constant pressure level, averaged over the MOZAIC sampling period (1997–2003), as performed in similar studies (Jenkins and Ryu, 2004b for example). However, this approach only gives a two dimen-sional vision of the transport. We aim to further document the preferred pathways associated with the main dynamical
Table 2. Number of MOZAIC profiles per month over Africa, from April 1997 to March 2003.
AFRICA
Town/Month Jan. Feb. Mar. Apr. May Jun. Jul. Aug. Sep. Oct. Nov. Dec.
Abidjan 32 12 12 18 6 12 16 14 8 26 18 6 Ivory Coast, 5.4◦N/4◦W Douala 8 24 31 4 – – – – 2 6 9 – Cameroon, 4◦N/9.8◦E Lagos 14 28 20 55 12 2 14 16 4 24 20 10 Nigeria, 6.6◦N/3.3◦E GULF OF GUINEA 54 64 53 77 18 14 30 30 14 56 47 16 Brazzaville 7 16 6 10 9 12 18 12 14 8 – – Congo, 4.3◦S/15.3◦E Luanda 6 – 2 8 5 1 10 4 4 4 2 2 Angola, 8.8◦S/13.3◦E CENTRAL AFRICA 13 16 8 18 14 13 28 22 18 12 2 2 Entebbe 2 – – – 8 4 8 12 6 7 2 – Uganda, 0◦N/32.4◦E Kigali – – – – 10 10 8 12 14 6 2 2 Rwanda, 2◦S/30.1◦E Nairobi 2 – – – 18 14 16 24 20 14 4 2 Kenya, 1.1◦S/36.7◦E EAST AFRICA 4 36 28 32 48 40 27 8 4 Total 71 84 79 113 80 57 114 106 76 109 59 28
processes and to link them with the vertical structure of ozone monthly mean distributions. For that purpose we have computed back-trajectories with the Lagrangian-model, LA-GRANTO (Wernli and Davies, 1997; Wernli, 1997) using the 3-dimensional winds from the ECMWF monthly mean anal-yses (0.5◦×0.5◦ latitude longitude grid, 60 vertical model
levels) calculated with a time step of 30 min. As is typical of these lagrangian approaches convection and turbulence are not represented in these calculations. Furthermore, monthly analyses only provide stationary wind fields, and hence tra-jectories computed here actually represent three-dimensional streamlines (hereafter 3-D streamlines).
As a validation, the robustness of this methodology has been assessed by a statistical comparison between 3-D streamlines and individual backtrajectories computed with 6-hourly ECMWF analyses. This comparison has been car-ried out for an ensemble of air parcels histories for which the sub-monthly variability of dynamical fields is included by defining the following set of initial parameters for backward movement computations over 5 days:
– the region defined by a 1.5◦×1.5◦ latitude-longitude
square centered around one of the airports visited by the MOZAIC aircraft (as the analyses have a 0.5◦ horizon-tal resolution, such a 1.5◦×1.5◦ square corresponds to air parcels defined by 4×4 grid points over the region) – the pressure level choosen among mandatory level of
ECMWF analyses
– the date of initialisation for four different years (2000, 2001, 2002, 2003); months of January and July; and for which the day is one of the following: the 30th, the 27th, 25th, 22nd and 20th of each month. (Limitations in varying the year and the day are due to data storage restrictions)
The robustness of the 3-D streamlines is established in terms of their ability to reproduce the same connections (between regions of fires and regions of ozone enhancements) as those established with backtrajectories. Connections with both ap-proaches are quantified as the number of air parcels that passed over a selected source region of biomass burning products (compared to the initial number of air parcels re-leased) following a particular direction. Thus we define se-lection criteria (SC) as a combination of:
– a continental source region, geographically defined with the map of fires (Fig. 1)
– a pressure level dependence (characteristic of the alti-tude of the Harmattan, the Trades or the AEJ).
Note that the year of the ECMWF monthly mean analyses chosen for the 3-D streamlines simply fits with the year of the most frequent sampling by MOZAIC aircraft (depending on the region and the season). The investigation of the inter-annual variability of ozone monthly means and its possible dependence on one of dynamical fields is out of the scope of the present study.
318 B. Sauvage et al.: Tropospheric ozone over Equatorial Africa
(a)
B. Sauvage et al.: Tropospheric ozone over Equatorial Africa
27
[a] [b]
[c] [d]
[e] [f]
Fig. 5. Monthly mean ozone vertical profiles in parts per billion by volume (ppbv) as a function of pressure, over the different areas: for the
Gulf of Guinea in December(a), January (c), February (e) with: Abidjan (black), Douala (red), Lagos (green); for Central and East Africa in
December(b), January (d), February (f) with: Brazzaville (black), Luanda (red), Nairobi (green). The horizontal bars represent one standard
deviation.
www.atmos-chem-phys.org/acp/0000/0001/
Atmos. Chem. Phys., 0000, 0001–41, 2005
(b)
B. Sauvage et al.: Tropospheric ozone over Equatorial Africa
27
[a] [b]
[c] [d]
[e] [f]
Fig. 5. Monthly mean ozone vertical profiles in parts per billion by volume (ppbv) as a function of pressure, over the different areas: for the
Gulf of Guinea in December(a), January (c), February (e) with: Abidjan (black), Douala (red), Lagos (green); for Central and East Africa in
December(b), January (d), February (f) with: Brazzaville (black), Luanda (red), Nairobi (green). The horizontal bars represent one standard
deviation.
www.atmos-chem-phys.org/acp/0000/0001/
Atmos. Chem. Phys., 0000, 0001–41, 2005
(c)
B. Sauvage et al.: Tropospheric ozone over Equatorial Africa
27
[a] [b]
[c] [d]
[e] [f]
Fig. 5. Monthly mean ozone vertical profiles in parts per billion by volume (ppbv) as a function of pressure, over the different areas: for the
Gulf of Guinea in December(a), January (c), February (e) with: Abidjan (black), Douala (red), Lagos (green); for Central and East Africa in
December(b), January (d), February (f) with: Brazzaville (black), Luanda (red), Nairobi (green). The horizontal bars represent one standard
deviation.
www.atmos-chem-phys.org/acp/0000/0001/
Atmos. Chem. Phys., 0000, 0001–41, 2005
(d)
B. Sauvage et al.: Tropospheric ozone over Equatorial Africa
27
[a] [b]
[c] [d]
[e] [f]
Fig. 5. Monthly mean ozone vertical profiles in parts per billion by volume (ppbv) as a function of pressure, over the different areas: for the
Gulf of Guinea in December(a), January (c), February (e) with: Abidjan (black), Douala (red), Lagos (green); for Central and East Africa in
December(b), January (d), February (f) with: Brazzaville (black), Luanda (red), Nairobi (green). The horizontal bars represent one standard
deviation.
www.atmos-chem-phys.org/acp/0000/0001/
Atmos. Chem. Phys., 0000, 0001–41, 2005
(e)
B. Sauvage et al.: Tropospheric ozone over Equatorial Africa
27
[a] [b]
[c] [d]
[e] [f]
Fig. 5. Monthly mean ozone vertical profiles in parts per billion by volume (ppbv) as a function of pressure, over the different areas: for the
Gulf of Guinea in December(a), January (c), February (e) with: Abidjan (black), Douala (red), Lagos (green); for Central and East Africa in
December(b), January (d), February (f) with: Brazzaville (black), Luanda (red), Nairobi (green). The horizontal bars represent one standard
deviation.
www.atmos-chem-phys.org/acp/0000/0001/
Atmos. Chem. Phys., 0000, 0001–41, 2005
(f)
B. Sauvage et al.: Tropospheric ozone over Equatorial Africa
27
[a] [b]
[c] [d]
[e] [f]
Fig. 5. Monthly mean ozone vertical profiles in parts per billion by volume (ppbv) as a function of pressure, over the different areas: for the
Gulf of Guinea in December(a), January (c), February (e) with: Abidjan (black), Douala (red), Lagos (green); for Central and East Africa in
December(b), January (d), February (f) with: Brazzaville (black), Luanda (red), Nairobi (green). The horizontal bars represent one standard
deviation.
www.atmos-chem-phys.org/acp/0000/0001/
Atmos. Chem. Phys., 0000, 0001–41, 2005
Fig. 5. Monthly mean ozone vertical profiles in parts per billion by volume (ppbv) as a function of pressure, over the different areas: for the
Gulf of Guinea in December (a), January (c), February (e) with: Abidjan (black), Douala (red), Lagos (green); for Central and East Africa in December (b), January (d), February (f) with: Brazzaville (black), Luanda (red), Nairobi (green). The horizontal bars represent one standard deviation.
B. Sauvage et al.: Tropospheric ozone over Equatorial Africa 319
(a)
[a] [b]
Fig. 6. Monthly mean vertical profiles over Lagos during January 2002 and 2003. Dynamical parameters (a). In red meridional components
of the windm (m/s), in black: zonal components of the windn (m/s), in blue: potential temperature (K), Chemical parameters (b): in red:
CO (ppbv), black: Oo (ppbv), blue: RH (%). The three different layers described in the text are highlighted in grey.
Atmos. Chem. Phys., 0000, 0001–41, 2005
www.atmos-chem-phys.org/acp/0000/0001/
(b)
[a] [b]
Fig. 6. Monthly mean vertical profiles over Lagos during January 2002 and 2003. Dynamical parameters (a). In red meridional components
of the windm (m/s), in black: zonal components of the wind n (m/s), in blue: potential temperature (K), Chemical parameters (b): in red:
CO (ppbv), black: Oo (ppbv), blue: RH (%). The three different layers described in the text are highlighted in grey.
Atmos. Chem. Phys., 0000, 0001–41, 2005
www.atmos-chem-phys.org/acp/0000/0001/
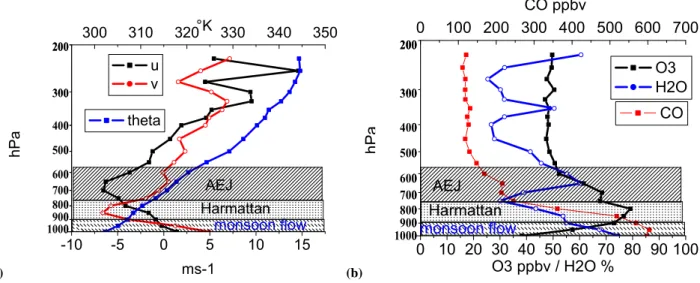
Fig. 6. Monthly mean vertical profiles over Lagos during January 2002 and 2003. Dynamical parameters (a). In red meridional components
of the wind v (m/s), in black: zonal components of the wind u (m/s), in blue: potential temperature (K), Chemical parameters (b): in red: CO (ppbv), black: O3(ppbv), blue: RH (%). The three different layers described in the text are highlighted in grey.
3 Distribution and variability of tropospheric ozone: seasonal and regional dependence. Monthly mean vertical profiles and seasonal cycles over Equatorial Africa
3.1 December-January-February (DJF): Biomass burning season in the northern tropics
As shown previously (Figs. 1a and 2e), biomass burning throughout the northern part of Equatorial Africa is at its maximum during the dry season and is an important source of ozone precursors (Hao et al., 1994). Figure 5 shows the ozone monthly mean vertical profiles during December, Jan-uary, and FebrJan-uary, over the Gulf of Guinea and over Central Africa plus Nairobi. For clarity reasons, Fig. 5 shows the ozone vertical profiles only over Nairobi. Other sites from East Africa are given in Fig. 19.
3.1.1 Gulf of Guinea
During the Northern Hemisphere dry season, hereafter named DJF, ozone concentrations maximize in the lower tro-posphere of the Gulf of Guinea. In this region, the highest concentrations reach 60 to 80 ppbv with the overall maxi-mum occurring in January over Lagos (Fig. 5c). The polluted layers are 150 hPa to 300 hPa thick, with a central pressure at 750–700 hPa. This enhancement is estimated to be about +20–30 ppbv over a background concentration level. In this study the term background has to be understood as the av-eraged concentration the profile would exhibit in case of no pollution. For example, a background profile for this season would be around 50 ppbv throughout the troposphere. From the end of February the concentrations decrease.
For a complementary analysis, Fig. 6 shows the January monthly mean vertical profiles of the MOZAIC dynami-cal, thermal (u, v, θ , Fig. 6a), and chemical (O3, RH, CO, Fig. 6b) parameters over Lagos. In order to take advantage of availability of the CO data these profiles have been com-puted from January 2002 and January 2003. The boundary layer is fed by maritime air masses embedded in the mon-soon flow up to 900 hPa and characterized by south-westerly winds, high relative humidity and low ozone (40–60 ppbv). High CO concentrations (500–600 ppbv) probably character-ize local pollution. The monsoon flow is capped by the Har-mattan layer (900–750 hPa) with north-easterly winds bring-ing ozone-rich (>65 ppbv), dry and stable air masses from a continental origin. The contribution of thermal winds asso-ciated with the meridional temperature gradient between the Gulf of Guinea and the continent, peaks into the AEJ (7 ms−1 for monthly-mean and up to 10–15 ms−1on individual pro-files between 750 and 550 hPa).
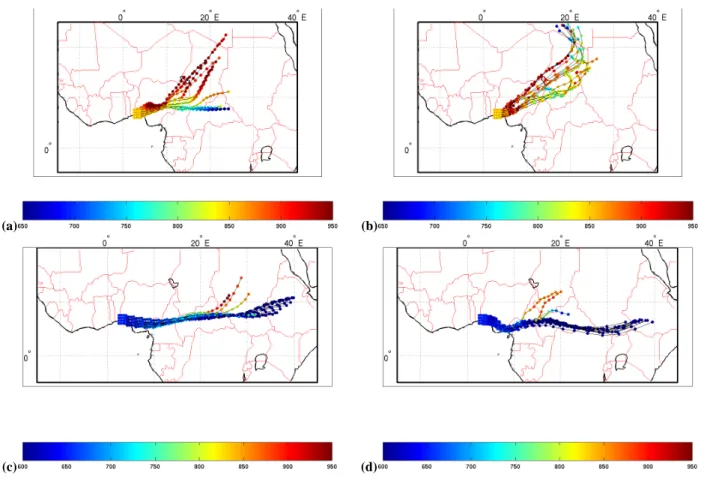
In order to explain the origin and formation of the ob-served enhanced ozone layers, Fig. 7a represents 3-D stream-lines initialized in the ozone maximum at 850 hPa over La-gos and traced backward for 5 days using the monthly mean wind fields of January 2002. Such trajectories show an ori-gin from north-east in the lower troposphere (820–900 hPa) over the eastern African region (Central African Republic, Sudan, Zaire, Uganda and Ethiopia), where biomass burning is active at this time of the year (Figs. 1a and 2e).
As explained before, in order to validate this methodol-ogy, we aim to quantify the robustness of such a connec-tion. For that purpose we have compared the 3-D stream-lines initialized in the ozone enhancement, at 850, 800 and 750 hPa over Lagos and over Abidjan, with 5 days individual
320 B. Sauvage et al.: Tropospheric ozone over Equatorial Africa
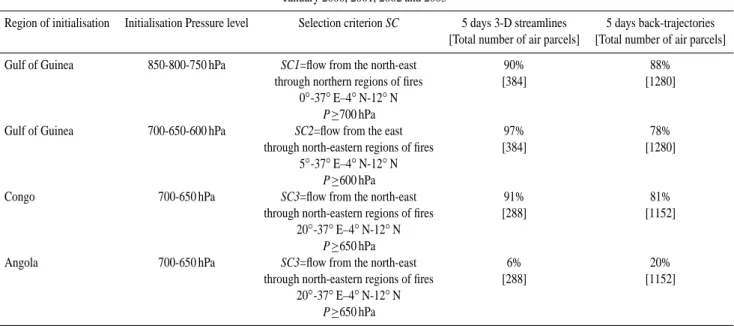
Table 3. Results of the statistical comparison between 3-D streamlines (from monthly mean analyses) and back-trajectories (from 6-hourly
analyses) characteristic of DJF. For each region (Gulf of Guinea, Congo and Angola), 1.5◦×1.5◦square of air parcels (4×4 grid points centered around the airports) have been initialized, for one pressure level, for one month, and for one date. 5 days back-trajectories are computed every month for the 5 different dates (the 30th, 27th, 25th, 22nd and 20th). Numbers in brackets summarize the total of grid points initialized within each region for the four different years and the different pressure levels.
January 2000, 2001, 2002 and 2003
Region of initialisation Initialisation Pressure level Selection criterion SC 5 days 3-D streamlines 5 days back-trajectories [Total number of air parcels] [Total number of air parcels] Gulf of Guinea 850-800-750 hPa SC1=flow from the north-east 90% 88%
through northern regions of fires [384] [1280] 0◦-37◦E–4◦N-12◦N
P ≥700 hPa
Gulf of Guinea 700-650-600 hPa SC2=flow from the east 97% 78%
through north-eastern regions of fires [384] [1280] 5◦-37◦E–4◦N-12◦N
P ≥600 hPa
Congo 700-650 hPa SC3=flow from the north-east 91% 81%
through north-eastern regions of fires [288] [1152] 20◦-37◦E–4◦N-12◦N
P ≥650 hPa
Angola 700-650 hPa SC3=flow from the north-east 6% 20%
through north-eastern regions of fires [288] [1152] 20◦-37◦E–4◦N-12◦N
P ≥650 hPa
back trajectories. Table 3 summarizes the statistical com-parison. Selection criteria are the following: SC1 is sat-isfied when air parcels are connected to northern regions of fires (0◦-37◦E–4◦N-12◦N), staying below 700 hPa along their north-easterly/south-westward pathway. SC2 is satis-fied when air parcels are connected to north-eastern regions of fires (5◦-37◦E–4◦N-12◦N) along their easterly-westward pathway, staying below 600 hPa. The Harmattan allows a connection to be established between north-east regions of fires and Gulf of Guinea while AEJ allows connections to be established with eastern regions of fires. Both connections are robust with 90% and 97% of air parcels satisfying SC1 and SC2 respectively. They are confirmed with individual back-trajectories (88% and 78% respectively).
For each case, the comparison shows negligible differ-ences in the interpretation of the origin of air parcels. An ex-ample of such a comparison for two pressure levels, one year, and one date of initialization for individual back-trajectories is shown in Fig. 7. As said previously the choice of the year 2002 for the 3-D streamlines is function of the sampling fre-quency over the city in the MOZAIC database. Figure 7b shows back trajectories initialized on the 30 January 2002, at 850 hPa over Lagos. Figure 7d gives back trajectories initial-ized on the 30 January 2002, at 650 hPa, while Figs. 7a and c give the 3-D streamlines for the same altitudes respectively. Individual trajectories show the same north-easterly origin (characteristic of the Harmattan) as the 3-D streamlines
ini-tialized at 850 hPa in January 2002 and the same easterly ori-gin (characteristic of the AEJ) at 650 hPa. The main differ-ence concerns the transport speed. Back-trajectories initial-ized at 850 hPa visit regions situated a little bit further north. This is obviously due to the stationary state represented with the 3-D streamlines, for which monthly analyses represent smoothed winds fields. This smoothing also prevents 3-D streamlines representing dynamical features with short vari-ability (few days), such as easterly waves. But the goal of this study is to establish the connections between regions of fire and ozone enhancements.
Within the AEJ layer, ozone concentrations decrease with altitude (65 to 50 ppbv). Note that very similar vertical struc-tures are measured over the three sites of the region (Douala, Lagos and Abidjan). What could be the processes respon-sible of the absence of any strong zonal gradient along the AEJ over the Gulf of Guinea coast? The AEJ lies just on the southern edge of the regions of fires (Figs. 7c and d) over a large longitudinal band and may be constantly sus-tained with ozone and/or ozone precursors by winds from north-east, with ascending motion, so that one could expect to observe an ozone zonal gradient in it. Note that both tra-jectories and 3-D streamlines flowing from the east originally come from the low levels (P>800 hPa), with 28% and 21.5% respectively, due to synoptic upward motion below the AEJ. The absence of zonal gradient suggests that after ozone is initially formed at regional scale in the Harmattan layer by
(a) (b)
(c) (d)
Fig. 7. 5 days 3-D streamlines (left panels) and individual back-trajectories (right panels) computed with monthly and daily ECMWF
analyses respectively, and initialized over: Lagos in January 2002 at 850 hPa (a), and the 30th of January 2002 at 850 hPa (b). Lagos in January 2002 at 650 hPa (c), and the 30th of January 2002 at 650 hPa (d). Trajectories are colour-coded with pressure (hPa), from 650 hPa to 950 hPa (a and b); and from 600 hPa to 950 hPa (c and d).
rapid photochemical processes over the band of fires (Jon-quieres et al., 1998; Singh et al., 1996), the slower photo-chemical enhancements of ozone during the transport along the AEJ is either weak or balanced by mixing processes; oth-erwise the zonal gradient of ozone should be stronger. A Lagrangian aircraft campaign and model studies would be needed to investigate whether the dominant process creating the dry-season ozone maximum can be attributed to rapid and regional photochemistry or to slower and continental-scale photochemistry. This is beyond the scope of this study.
The stability of the Harmattan layers combined with the subsidence caused by the Saharan Anticyclone (found near 500 hPa between 5◦–15◦N, a feature which is present
be-tween November and February) restricts ascending motions. This prevents any efficient vertical transport towards the middle and upper troposphere (from 500 hPa to 200 hPa) where ozone concentrations remains constant over the Gulf of Guinea, with about 50 ppbv up to 200 hPa. An excep-tion is seen in February over Abidjan, near 250 hPa, with 70 ppbv. The origin could be lightning activity, or detrain-ment from ITCZ (situated just southward) of air masses
pre-viously loaded with pollution from northern biomass burning emissions, as noticed by Edwards et al. (2003).
3.1.2 Central and East Africa
In the two other regions situated further south (Central and East Africa), only Brazzaville shows such an ozone en-hancement in the lower troposphere, near 650 hPa, within a layer 200 hPa thick, with concentrations from 50 to 65 ppbv (Figs. 5d and f). Luanda and Nairobi exhibit lower con-centrations, never exceeding 20–40 ppbv on average. Such enriched ozone layers over Brazzaville during the boreal dry season have been already observed during the TRACE-A campaign and attributed to fires in the northern regions (Nganga et al., 1996). The upper troposphere over Braz-zaville, near 200 hPa, also presents high concentrations with more than 60 ppbv (Figs. 5d and 5f).
Figure 8a shows that the 3-D streamlines ending in the ozone maximum in the lower troposphere over Brazzaville have a northeasterly origin (over the Sudan) from the north-ern boreal hemisphere where biomass fires are active. The connection between north-east fires and lower troposphere
322 B. Sauvage et al.: Tropospheric ozone over Equatorial Africa
(a)
(b)
Fig. 8. 5 days 3-D streamlines (a) and individual back-trajectories (b) computed with monthly and daily ECMWF analyses
respec-tively, and initialized over Brazzaville in January 2002 at 700 hPa, and the 30th of January 2002 at 700 hPa. Trajectories are colour-coded with pressure (hPa), from 650 hPa to 950 hPa (a and b).
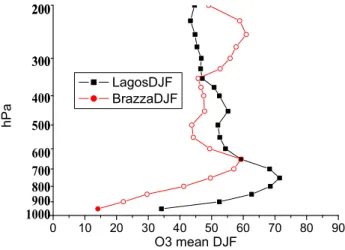
of Brazzaville and Luanda is robust with 91% of air parcels satisfying the selection criterion (SC3, Table 3), and is con-firmed with individual back-trajectories (81%) (see Fig. 8b). However, the latter also show a possible monsoon flow in-fluence (around 7% over the 4 years). Such a transport by north-easterlies emanating from the semi-permanent Saha-ran High affects both the Gulf of Guinea and Central Equa-torial Africa when the ITCZ peaks is in its southernmost position (see Fig. 2e). This explains the similar shapes of the vertical profiles over Lagos and Brazzaville during DJF (Fig. 9). However, note that the ozone maximum over Braz-zaville is shifted vertically compared to the one over Lagos. This reflects the higher altitude of the trade wind inversion at
B. Sauvage et al.: Tropospheric ozone over Equatorial Africa
31
Fig. 9. Seasonal ozone vertical profiles over Lagos (black) and Brazzaville (red) in DJF (biomass burning season in the northern tropics)
www.atmos-chem-phys.org/acp/0000/0001/
Atmos. Chem. Phys., 0000, 0001–41, 2005
Fig. 9. Seasonal ozone vertical profiles over Lagos (black) and
Brazzaville (red) in DJF (biomass burning season in the northern tropics).
the vicinity of the convergence zone. Further south, this fea-ture is absent from the January and February vertical profiles over Luanda where ozone concentrations are quite low. The absence of such enhanced layers is explained by the lack of north-easterly influence as seen in the ECWMF wind fields (see Fig. 2e): Most of the time Luanda is on the southern side of the ITCZ. Both back-trajectories and 3-D streamlines show a monsoon flow influence, with more than 80% of this origin. The SC3 north-easterly influence occurs only 20% of the time with individual back-trajectories, and only 6% with 3-D streamlines (Table 3).
Concerning the strong ozone enhanced layer appearing in January and February over Brazzaville near 300–200 hPa, back trajectories show a possible north-easterly influence originating from the lower levels over regions of fires (fig-ure not shown). Indeed, Chatfield et al. (2004) have ob-served such an influence from Sahel fires in the upper tropo-sphere over Ascencion Island (14◦South). Besides, accord-ing to Jenkins and Ryu (2004a and 2004b) there is a possi-ble influence of lightning which is maximum in the opposite hemisphere of the biomass burning activity. Using MOPITT and GOME data, Edwards et al. (2003) have shown that at-mospheric layers observed in the middle troposphere of the southern hemisphere and coming from the lower troposphere over Sahel, could be exposed to lightning shortly after have been loaded by biomass burning emissions. Indeed polluted air masses from North-East fires regions could be entrained into the ITCZ which is situated between fires regions and Brazzaville at this time of the year. Consequent NOxand CO could then be combined to explain such an enhancement.
B. Sauvage et al.: Tropospheric ozone over Equatorial Africa 323
(a)
32
B. Sauvage et al.: Tropospheric ozone over Equatorial Africa
[a] [b]
[c] [d]
[e] [f]
Fig. 10. Monthly mean ozone vertical profiles in parts per billion by volume (ppbv) as a function of pressure, over the different areas: for the
Gulf of Guinea in June(a), July (c), August (e) with: Abidjan (black), Douala (red), Lagos (green); for the Central and East Africa in June (b), July (d), August (f) with: Brazzaville (black), Luanda (red), Nairobi (green). The horizontal bars represent one standard deviation about
mean.
(b)
32
B. Sauvage et al.: Tropospheric ozone over Equatorial Africa
[a] [b]
[c] [d]
[e] [f]
Fig. 10. Monthly mean ozone vertical profiles in parts per billion by volume (ppbv) as a function of pressure, over the different areas: for the
Gulf of Guinea in June(a), July (c), August (e) with: Abidjan (black), Douala (red), Lagos (green); for the Central and East Africa in June (b), July (d), August (f) with: Brazzaville (black), Luanda (red), Nairobi (green). The horizontal bars represent one standard deviation about
mean.
(c)
32
B. Sauvage et al.: Tropospheric ozone over Equatorial Africa
[a] [b]
[c] [d]
[e] [f]
Fig. 10. Monthly mean ozone vertical profiles in parts per billion by volume (ppbv) as a function of pressure, over the different areas: for the
Gulf of Guinea in June(a), July (c), August (e) with: Abidjan (black), Douala (red), Lagos (green); for the Central and East Africa in June (b), July (d), August (f) with: Brazzaville (black), Luanda (red), Nairobi (green). The horizontal bars represent one standard deviation about
mean.
Atmos. Chem. Phys., 0000, 0001–41, 2005
www.atmos-chem-phys.org/acp/0000/0001/
(d)
32
B. Sauvage et al.: Tropospheric ozone over Equatorial Africa
[a] [b]
[c] [d]
[e] [f]
Fig. 10. Monthly mean ozone vertical profiles in parts per billion by volume (ppbv) as a function of pressure, over the different areas: for the
Gulf of Guinea in June(a), July (c), August (e) with: Abidjan (black), Douala (red), Lagos (green); for the Central and East Africa in June (b), July (d), August (f) with: Brazzaville (black), Luanda (red), Nairobi (green). The horizontal bars represent one standard deviation about
mean.
Atmos. Chem. Phys., 0000, 0001–41, 2005
www.atmos-chem-phys.org/acp/0000/0001/
(e)
[a] [b]
[c] [d]
[e] [f]
Fig. 10. Monthly mean ozone vertical profiles in parts per billion by volume (ppbv) as a function of pressure, over the different areas: for the
Gulf of Guinea in June(a), July (c), August (e) with: Abidjan (black), Douala (red), Lagos (green); for the Central and East Africa in June (b), July (d), August (f) with: Brazzaville (black), Luanda (red), Nairobi (green). The horizontal bars represent one standard deviation about
mean.
Atmos. Chem. Phys., 0000, 0001–41, 2005
www.atmos-chem-phys.org/acp/0000/0001/
(f)
[a] [b]
[c] [d]
[e] [f]
Fig. 10. Monthly mean ozone vertical profiles in parts per billion by volume (ppbv) as a function of pressure, over the different areas: for the
Gulf of Guinea in June(a), July (c), August (e) with: Abidjan (black), Douala (red), Lagos (green); for the Central and East Africa in June (b), July (d), August (f) with: Brazzaville (black), Luanda (red), Nairobi (green). The horizontal bars represent one standard deviation about
mean.
Atmos. Chem. Phys., 0000, 0001–41, 2005
www.atmos-chem-phys.org/acp/0000/0001/
Fig. 10. Monthly mean ozone vertical profiles in parts per billion by volume (ppbv) as a function of pressure, over the different areas: for the
Gulf of Guinea in June (a), July (c), August (e) with: Abidjan (black), Douala (red), Lagos (green); for the Central and East Africa in June
(b), July (d), August (f) with: Brazzaville (black), Luanda (red), Nairobi (green). The horizontal bars represent one standard deviation about
mean.
3.2 June-July-August (JJA) season : Biomass burning sea-son in the southern tropics
Figure 10 shows the monthly mean ozone vertical profiles over Central and East Africa (right column), and over the Gulf of Guinea (left column) for the whole period of
mea-surements, for June (Figs. 10a and b), July (Figs. 10c and d), and August (Figs. 10e and f).
324 B. Sauvage et al.: Tropospheric ozone over Equatorial Africa
3.2.1 Central and East Africa
During the southern hemisphere dry season, there is an ozone enhancement in the lower troposphere over both Brazzaville and Luanda, between 900 and 600 hPa (Fig. 10). The con-centrations maximize at 700 hPa with 90 ppbv on average. In contrast, Nairobi presents the lowermost concentrations in these lower levels, with only 20 to 40 ppbv, although higher than during DJF.
In Fig. 11, the 3-D streamlines clearly demonstrate that air masses in the lower troposphere travel south-easterly from west of Lake Malawi. This is a region of intense fire ac-tivity (Figs. 1b and 2f), with ozone precursors probably be-ing injected into the continental south-easterlies as they pass over the fires of the Democratic Republic of Congo, Zambia and Zimbabwe before moving up to Brazzaville and Luanda. This connection is robust with both the 3-D streamlines and the individual back-trajectories with more than 86% and 81% respectively, calculated over 2000, 2001, 2002 and 2003 (Ta-ble 4). It confirms findings by Garstang et al. (1996) during the TRACE-A campaign about the anticyclonic circulation over the subcontinent during the winter half-year that reaches a 80% daily occurrence in July, allowing a circulation from the east on the northern edge of the high. The MOZAIC dy-namical parameters also confirm this connection (Fig. 12), with strong negative zonal wind, u=−10 m.s−1; v=+5 m.s−1. As observed in DJF over the Gulf of Guinea, ozone enhanced layers due to biomass burning products are particularly sta-ble. Indeed, during the TRACE-A campaign, 5 km stable layers have been observed, due to strong subsidence-induced inversion, inhibiting vertical transport of pollution (Chatfield et al., 1996 and Fuelberg et al., 1996). In the lower tropo-sphere (up to 900–850 hPa) Congo and Angola are subject during the entire year to the southern monsoon flux, char-acterized by positive zonal and meridional winds (Fig. 12) of up to 3–4 m.s−1 on the monthly mean basis, and relative humidity higher than 90%. That explains the strong ozone vertical gradient in the lower layers of the troposphere (see Fig. 12a).
At this stage of the analysis, it is interesting to compare the dry seasons of Angola-Congo (in JJA) and Gulf of Guinea (in DJF). Figure 12 shows that they present the same shape in the lower troposphere, but with ozone concentrations over Brazzaville being 15% higher within a thicker layer (250 hPa against 150 hPa over Abidjan). Given that the magnitude of burning in northern and southern African tropical belts is very similar (48% of the African fires are in the north and 52% in the south, according to Hao and Liu, 1994), the dif-ference in the ozone concentrations may partly reflect the different types of vegetation found in the African northern and southern hemispheres. Figure 3 shows that in the south-ern hemisphere deciduous forest-woodland savanna predom-inates whereas brush-grass savannas become important in the north. According to Duncan et al. (2003) emission factors of pollutant fires from tropical forest are higher for CO (104 g
CO/kg DM), than fires from savannas (65 g CO/kg DM). It seems reasonable to simply argue that higher CO concentra-tions in the southern regions may contribute to higher ozone concentrations (assuming that NOxemissions are also higher in the south).
Even if the East Africa region does not present ozone en-hanced layers in the lower troposphere, concentrations are higher than during the DJF season. There is an obvious in-fluence of the local biomass burning, occurring over Rwanda, Tanzania, Mozambique, Zimbabwe and Kenya in JJA, along the south-eastern coast of Africa. Figure 14 shows the MOZAIC dynamical parameters recorded over Kigali with stable (strong θ gradient) flow from south east(v=2.5 m.s−1, u=−2.5 m.s−1), characterized by high RH (80%). This flow originates from the south-eastern Africa in the confluence area of the Mascarene anticyclone and the east African low level jet, passes over the regions of fires where it may be loaded with ozone precursors, and then passes up to Kigali.
In the middle troposphere, above 600 hPa, Central Africa and East Africa present higher concentrations than in DJF, with 60 ppbv ozone over Brazzaville and Luanda (Fig. 10). Above 400 hPa, Nairobi presents similar concentrations at around 50 ppbv.
The two regions are under complex influences, involv-ing variations in trans-central-African flow, especially dur-ing the end of this season (August) and durdur-ing austral sprdur-ing (SON). Both South America and Asia can influence these re-gions through upper troposphere circulation (Krishnamurti et al., 1996; Jacob et al., 1996). The tropospheric ozone columns from TOMS suggest a strong inflow from Indian Ocean, which may have high ozone contents (Krishnamurti et al., 1996; Chatfield et al., 2004). As noticed by Thompson et al. (2003b), this origin confined between 40◦–70◦E, over
the Indian Ocean, corresponds to a region that may be influ-enced by pollution from nearby East African regions of fires, or India (Lelieveld et al., 2001).
3.2.2 Gulf of Guinea
From June to August (JJA, Fig. 10), the lower troposphere exhibits much lower ozone concentrations than during the dry season. Ozone concentrations from 20 to 30 ppbv have been measured over Lagos and Abidjan from the ground up to 780 hPa. The monsoon event with clean oceanic flow from south-west is particularly active over this region, from the ground up to 800 hPa with RH around 90% on average (figure not shown).
Above this ozone-depleted layer, an ozone enhancement is measured over Lagos in July, from 700 to 600 hPa, with 45 ppbv ozone (Fig. 10c). A similar behaviour is observed over Lagos and Abidjan in August with an enhanced ozone (55 ppbv) layer between 750 and 600 hPa (Fig. 10e).
The 3-D streamlines ending within these ozone enhance-ments do not exhibit a dominant transport process as robust on a monthly basis as those observed during the northern
B. Sauvage et al.: Tropospheric ozone over Equatorial Africa 325
(a)
Fig. 11. 5 days 3D streamlines (a) and individual back-trajectories (b) computed with monthly and daily ECMWF analyses respectively, and
initialized over: Brazzaville in July 2003 at 800 hPa(a), and the 30th of July 2003 at 800 hPa (b). Trajectories are colour-coded with pressure
(hPa), from 600 hPa to 950 hPa
www.atmos-chem-phys.org/acp/0000/0001/ Atmos. Chem. Phys., 0000, 0001–41, 2005
(b)
Fig. 11. 5 days 3D streamlines (a) and individual back-trajectories (b) computed with monthly and daily ECMWF analyses respectively, and
initialized over: Brazzaville in July 2003 at 800 hPa(a), and the 30th of July 2003 at 800 hPa (b). Trajectories are colour-coded with pressure
(hPa), from 600 hPa to 950 hPa
www.atmos-chem-phys.org/acp/0000/0001/ Atmos. Chem. Phys., 0000, 0001–41, 2005
Fig. 11. 5 days 3-D streamlines (a) and individual back-trajectories (b) computed with monthly and daily ECMWF analyses respectively,
and initialized over: Brazzaville in July 2003 at 800 hPa (a), and the 30th of July 2003 at 800 hPa (b). Trajectories are colour-coded with pressure (hPa), from 600 hPa to 950 hPa.
(a)
34
B. Sauvage et al.: Tropospheric ozone over Equatorial Africa
[a] [b]
Fig. 12. Monthly mean vertical profiles of ozone over Brazzaville during August. Dynamical parameters (a): in red:p (m/s), black:q (m/s),
blue: potential temperature (K); Chemical parameters (b): in black: Or (ppbv), in blue: RH (%). Trades layer is in grey.
(b)
34
B. Sauvage et al.: Tropospheric ozone over Equatorial Africa
[a] [b]
Fig. 12. Monthly mean vertical profiles of ozone over Brazzaville during August. Dynamical parameters (a): in red:p (m/s), black:q (m/s),
blue: potential temperature (K); Chemical parameters (b): in black: Or (ppbv), in blue: RH (%). Trades layer is in grey.
Fig. 12. Monthly mean vertical profiles of ozone over Brazzaville during August. Dynamical parameters (a): in red: v (m/s), black: u (m/s),
blue: potential temperature (K); Chemical parameters (b): in black: O3(ppbv), in blue: RH (%). Trades layer is in grey.
hemispheric dry season cases. Connections between fires occurrence over southern regions and these layers are not ro-bust on a monthly basis, with only 15.6% of back-trajectories and only 7.5% of 3-D streamlines coming from fires over austral Africa to the Gulf of Guinea (see Table 4). Indeed ozone enhancements themselves are not a systematic feature within this season as characterized by strong standard devi-ations. During JJA, the Gulf of Guinea can present two dif-ferent shapes of profile: with or without ozone enhanced lay-ers around 650 hPa. Figure 15a represents the seasonal JJA ozone distribution over Lagos (black) and Abidjan (red) only when such enriched ozone layers appear in individual pro-files. The daily trajectories initialized for such a case in the 700–600 hPa ozone enhanced layers reveal a south-easterly origin from Southern Hemisphere region of fires (Congo Democratic Republic, see 5 days back-trajectories, Fig. 15c).
The monsoon flow from the south west is also seen, but do not contribute to the transport of polluted air. Figure 15b shows the seasonal ozone distribution without any ozone enhancements over Lagos and Abidjan. One example of the associated connection is then represented by the indi-vidual back-trajectories, between the 29 and 24 July 2000. They show a north-easterly influence originating from Saha-ran regions (Fig. 15d). Such an example shows the limita-tion of monthly analyses to explain all the possible connec-tions. However, we can still conclude that south-easterlies are responsible for enhanced layers measured in the Gulf of Guinea. Indeed, depending on the position of the ITCZ, south or north of Lagos and Abidjan, south-easterlies from fires regions are, or are not the prominent feature over the Gulf of Guinea. Moreover, this process may explain why the shapes of the vertical profiles are similar between north and
326 B. Sauvage et al.: Tropospheric ozone over Equatorial Africa
Table 4. Same as Table 3 for JJA. Selection criterion has been defined: SC1=air parcels with a flow from southeast that passes over regions
of fires and stay below 600 hPa; Results are given as % of the total of air parcels. July 2000, 2001, 2002 and 2003
Region of initialisation Initialisation Pressure level Selection criterion SC 5 days 3-D streamlines 5 days back-trajectories [Total number of air parcels] [Total number of air parcels] Gulf of Guinea 700-650-600 hPa SC1=flow from the south-east 7.5% 15.6%
through southern regions of fires [384] [1280] 13◦-37◦E–5◦S-25◦S
P ≥600 hPa
Congo and Angola 800-750-700 hPa SC1=flow from the south-east 86% 81% through southern regions of fires [288] [1152]
13◦-37◦E–5◦S-25◦S
P ≥600 hPa
B. Sauvage et al.: Tropospheric ozone over Equatorial Africa
35
Fig. 13. Seasonal ozone vertical profiles over Lagos (black) and Brazzaville (red) during their respective biomass burning season DJF and
JJA
www.atmos-chem-phys.org/acp/0000/0001/
Atmos. Chem. Phys., 0000, 0001–41, 2005
Fig. 13. Seasonal ozone vertical profiles over Lagos (black) and
Brazzaville (red) during their respective biomass burning season DJF and JJA.
south (Fig. 16), with higher ozone concentrations (85 ppbv over Brazzaville, 70 ppbv over Lagos) measured in the south-ern hemisphere at the same time, and shifted vertically over the Gulf of Guinea. The decrease in the ozone concentrations (−15 ppbv) during transport may be attributed to convective and turbulent mixing processes. As cross-equatorial advec-tion is very slow with a wind speed around 2 m.s−1, most of the time, individual cases have shown that more than 8 days are necessary to transport air masses from the regions of fires to Gulf of Guinea. Regional transport explains the similari-ties in the vertical profiles. South-easterlies emanating from the SASTA anticyclone situated over Angola reach the Gulf of Guinea coast, as the ITCZ peaks in its northern position (10–15◦N) at this time of the year. The vertical displace-ment of the ozone enhanced layers between the two profiles is associated with an increase in altitude of the trade wind inversion level downstream of the anticyclone.
The middle and upper troposphere show ozone concen-trations from 45 to 65 ppbv (Figs. 15a and b). The mid-dle troposphere shows higher concentrations than the lower troposphere, as a consequence of the ozone-poor maritime boundary layer origin air of the monsoon flow below 600– 700 hPa. Between 300 hPa and 200 hPa, Lagos shows higher concentrations than during the dry season, with a +15 ppbv difference (compared to Fig. 5c). As described by Thompson et al. (2003b) a possible entrainment of air across the ITCZ could explain this difference as biomass burning is occurring in the Southern Hemisphere at this time of year. Moreover, lightning NOx or local pollution uplifted in convective re-gions may be responsible for such ozone enhancements. 3.3 March-April-May and September-October-November
[MAM and SON], the intermediate seasons
Figures 17 and 18 represent the monthly mean vertical pro-files of ozone during intermediate seasons, March-April-May (Fig. 17), and September-October-November (Fig. 18); over the Gulf of Guinea (left column) and over Central Africa and Nairobi (right column). Finally, as a summary of this climatology, Fig. 19 gives the annual overview through the seasonal cycles for three layers 100 hPa thick, centered on 750 hPa (Fig. 19e and f), 500 hPa (Fig. 19c and d) and 250 hPa (Fig. 19a and b).
3.3.1 Gulf of Guinea
During the transition seasons, boreal spring (MAM) and fall (SON), ozone concentrations are weaker in the lower levels of the troposphere (Fig. 17a and Fig. 18a). This clearly con-firms the importance of the biomass burning in the African northern tropics for ozone production. As the northern Hemi-spheric biomass burning seasons starts during November and stops during March, some ozone enhancements in the lower troposphere are seen over Abidjan in March (up to 60 ppbv, Fig. 17a), and over Lagos and Douala in November (up to
B. Sauvage et al.: Tropospheric ozone over Equatorial Africa 327
(a)
[a] [b]
Fig. 14. Monthly mean vertical profiles over Kigali during August. Dynamical parameters (a): in red:s (m/s), black:t (m/s), blue: potential
temperature (K); Chemical parameters (b) in black: Ou (ppbv), blue: RH (%).
Atmos. Chem. Phys., 0000, 0001–41, 2005
www.atmos-chem-phys.org/acp/0000/0001/
Fig. 14. Monthly mean vertical profiles over Kigali during August. Dynamical parameters (a): in red: v (m/s), black: u (m/s), blue: potential
temperature (K); Chemical parameters (b) in black: O3(ppbv), blue: RH (%).
(a)
B. Sauvage et al.: Tropospheric ozone over Equatorial Africa
37
[a] [b]
[c] [d]
Fig. 15. Seasonal vertical profiles of ozone over Lagos (black) and Abidjan red, in JJA. Average with enhancement in the lower troposhere
(a), without ozone enhancement (b). c; d: example of associated back-trajectories: c, 11-16th of July 2000; d, 24-29th of July 2000 (b)
B. Sauvage et al.: Tropospheric ozone over Equatorial Africa
37
[a] [b]
[c] [d]
Fig. 15. Seasonal vertical profiles of ozone over Lagos (black) and Abidjan red, in JJA. Average with enhancement in the lower troposhere
(a), without ozone enhancement (b). c; d: example of associated back-trajectories: c, 11-16th of July 2000; d, 24-29th of July 2000 (c)
B. Sauvage et al.: Tropospheric ozone over Equatorial Africa 37
[a] [b]
[c [d]
Fig. 15. Seasonal vertical profiles of ozone over Lagos (black) and Abidjan red, in JJA. Average with enhancement in the lower troposhere
(a), without ozone enhancement (b). c; d: example of associated back-trajectories: c, 11-16th of July 2000; d, 24-29th of July 2000
www.atmos-chem-phys.org/acp/0000/0001/ Atmos. Chem. Phys., 0000, 0001–41, 2005
(d)
B. Sauvage et al.: Tropospheric ozone over Equatorial Africa 37
[a] [b]
[c] [d
Fig. 15. Seasonal vertical profiles of ozone over Lagos (black) and Abidjan red, in JJA. Average with enhancement in the lower troposhere
(a), without ozone enhancement (b). c; d: example of associated back-trajectories: c, 11-16th of July 2000; d, 24-29th of July 2000
www.atmos-chem-phys.org/acp/0000/0001/ Atmos. Chem. Phys., 0000, 0001–41, 2005
Fig. 15. Seasonal vertical profiles of ozone over Lagos (black) and Abidjan red, in JJA. Average with enhancement in the lower troposhere (a), without ozone enhancement (b). (c); (d): example of associated back-trajectories: (c) 11–16 July 2000; (d) 24–29 July 2000.
328 B. Sauvage et al.: Tropospheric ozone over Equatorial Africa
38
B. Sauvage et al.: Tropospheric ozone over Equatorial Africa
Fig. 16. Seasonal ozone vertical profiles over Lagos (black) and Brazzaville (red) during the Southern Hemisphere biomass burning season
JJA
Atmos. Chem. Phys., 0000, 0001–41, 2005
www.atmos-chem-phys.org/acp/0000/0001/
Fig. 16. Seasonal ozone vertical profiles over Lagos (black) and
Brazzaville (red) during the Southern Hemisphere biomass burning season JJA
55 ppbv, Fig. 18e). In the upper levels, concentrations are similar in the two seasons at the three sites with about 50– 60 ppbv. The annual cycle shown in Fig. 19e exhibits the strong seasonal cycle in the lower troposphere with a maxi-mum from November to March, while Figs. 19a and c clearly exhibit the noticeable characteristic of northern Equatorial Africa: absence of any strong seasonal variability in the mid-dle and upper troposphere. This can be explained by the sub-sidence caused by the Saharan Anticyclone found near 500 hPa between 5◦–15◦N, which is present between November and February. Moreover, the stability of the Harmattan layers restricts ascending motions, and thus allows accumulation of pollutants in the lower troposphere by restricting ventilation into the upper levels.
3.3.2 Central and East Africa
During the intermediate season MAM, these regions do not exhibit any particular ozone feature. Concentrations are lower below 600 hPa with less than 50 ppbv. In the middle troposphere concentrations may reach 50 ppbv (Figs. 17b, d and f).
During SON, there is over Central Africa an extension of the seasonal maximum that starts in June, at both 750 hPa (except over Brazzaville), 500 hPa and 250 hPa (Figs. 19b and d). Indeed, the vertical profiles (Fig. 18, right col-umn) show three enhanced layers in September over Lu-anda. The first one centered at 650 hPa with 100 ppbv, the second at 450 hPa (85 ppbv) and the last one at 250 hPa (75 ppbv). During October and November, there is just one thick layer with ozone mixing ratio up to 80 ppbv, centered near 350 hPa, and a large perturbation from the background (+20/+25 ppbv). Brazzaville shows a similar behaviour in October, with 70 ppbv of ozone around 350 hPa.
This region has been much studied during the TRACE-A and SAFARI-92 campaigns that took place in SON season. At this time of the year, the dry season ends, with a max-imum of biomass burning activity around the south-eastern countries of Africa (Mozambique, Zimbabwe, South Africa). Recirculation over Central Africa via the northern edge of the continental anticyclone could explain such high concen-tration over Luanda in September (Figs. 18b and 19f). Sta-ble layers have been observed, around 600 hPa, and transport to higher levels has been explained by strong deep convec-tive lifting, as described by Garstang et al. (1996), during SAFARI-92 campaign (August 16 to October 31). This may explain the stratified structure in August and September over Luanda. Easterly winds give then the rise to the advection of biomass burning ozone precursors from the eastern part of Africa (Malawi, Zimbabwe and Mozambique), after they have been transported vertically by convection into the mid-dle troposphere over Brazzaville and Luanda. A similar fire influence has been observed by Thompson et al. (1996) and Jenkins et al. (1997), during the TRACE-A and SAFARI 92 campaigns and can explain the continuity of high ozone con-centrations in both three levels of the troposphere, 750, 500 and 250 hPa, up to October (Fig 19f, d and b).
The other origin of the high ozone values during this sea-son over Central Africa may be the biomass burning activ-ity in Brazil. It is at its maximum during this period (Hao et al., 1994). Krishnamurti et al. (1996) have shown such an origin, especially in the upper troposphere over the At-lantic, where north-westerly and westerly transport predomi-nates. Convection may lift ozone and its precursors from the boundary layer over Brazil to the middle and the upper tro-posphere, where it is transported over the Atlantic by high-level westerlies, and with the easterlies emanating from the St-Helene high (SASTA) centered over Namibia (Browell et al., 1996). This enhancement in the middle troposphere dur-ing SON is also in agreement with the analyses made by Cros et al. (1992), Kirchhoff et al. (1996), Nganga et al. (1996), Thompson et al. (1996), Diab et al. (1996) and Olson et al. (1996) during the TRACE-A and SAFARI 92 campaigns. Another attributable origin of the high ozone concentra-tions measured over Angola and Congo near 250 hPa in SON may be the ozone production from lightning NOxemissions. Observations from space by the LIS sensor (http://thunder. msfc.nasa.gov/data/query/distributions.html) show high lev-els of lightning activity over Angola and Congo in SON, as well as during DJF (see Sect. 3.1). The impact of lightning NOxemissions on ozone production is badly quantified, as is the magnitude of the emissions. Estimates of the source mag-nitude are highly variable, from 3 Tg N yr−1to 10 Tg N yr−1 (Jourdain and Hauglustaine, 2001; Staudt et al., 2002a). The uncertainty of the global NOx lightning source and its im-pact on ozone concentrations remain one of the major issues in understanding the tropical ozone budget. However, this region as well as West Africa and South Atlantic, is highly sensitive to such influence, because of subsidence throughout