HAL Id: hal-00000759
https://hal.archives-ouvertes.fr/hal-00000759v3
Submitted on 13 Nov 2003
HAL is a multi-disciplinary open access
archive for the deposit and dissemination of
sci-entific research documents, whether they are
pub-lished or not. The documents may come from
teaching and research institutions in France or
abroad, or from public or private research centers.
L’archive ouverte pluridisciplinaire HAL, est
destinée au dépôt et à la diffusion de documents
scientifiques de niveau recherche, publiés ou non,
émanant des établissements d’enseignement et de
recherche français ou étrangers, des laboratoires
publics ou privés.
The H2CO abundance in the inner warm regions of low
mass protostellar envelopes
Sébastien Maret, C. Ceccarelli, Emmanuel Caux, Alexander Tielens, Jes
Jorgensen, Ewine van Dishoeck, A. Bacmann, Alain Castets, Bertrand
Lefloch, Laurent Loinard, et al.
To cite this version:
Sébastien Maret, C. Ceccarelli, Emmanuel Caux, Alexander Tielens, Jes Jorgensen, et al.. The H2CO
abundance in the inner warm regions of low mass protostellar envelopes. Astronomy and Astrophysics
- A&A, EDP Sciences, 2004, 416, pp.577-594. �hal-00000759v3�
ccsd-00000759 (version 3) : 13 Nov 2003
(DOI: will be inserted by hand later)
The H
2
CO abundance in the inner warm regions of low mass
protostellar envelopes
S. Maret
1, C. Ceccarelli
2, E. Caux
1, A.G.G.M. Tielens
3, J.K. Jørgensen
4, E. van Dishoeck
4, A. Bacmann
5,
A.Castets
6, B. Lefloch
2, L. Loinard
7, B. Parise
1, and F. L. Sch¨oier
41 Centre d’Etude Spatiale des Rayonnements, CESR/CNRS-UPS, BP 4346, F-31028 Toulouse Cedex 04, France 2 Laboratoire d’Astrophysique, Observatoire de Grenoble, B.P. 53, F-38041 Grenoble Cedex 09, France 3 Space Research Organization of the Netherlands, P.O. Box 800, 9700 AV Groningen, The Netherlands 4 Leiden Observatory, P.O. Box 9513, NL-2300 RA Leiden, The Netherlands
5 European Southern Observatory, Karl-Schwarzschild Str. 2, D-85748 Garching bei M¨unchen, Germany 6 Observatoire de Bordeaux, BP 89, F-33270 Floirac, France
7 Instituto de Astronom´ıa, Universidad Nacional Aut´onoma de M´exico, Apartado Postal 72-3 (Xangari), 58089 Morelia,
Michoac´an, Mexico
Received August 4, 2003 /Accepted October 9, 2003
Abstract.We present a survey of the formaldehyde emission in a sample of eight Class 0 protostars obtained with the IRAM and JCMT millimeter telescopes. The range of energies of the observed transitions allows us to probe the physical and chemical conditions across the protostellar envelopes. The data have been analyzed with three different methods with increasing level of sophistication. We first analyze the observed emission in the LTE approximation, and derive rotational temperatures between 11 and 40 K, and column densities between 1 and 20 × 1013cm−2. Second, we use a LVG code and derive higher kinetic
temperatures, between 30 and 90 K, consistent with subthermally populated levels and densities from 1 to 6 × 105 cm−3.
The column densities from the LVG modeling are within a factor of 10 with respect to those derived in the LTE approximation. Finally, we analyze the observations based upon detailed models for the envelopes surrounding the protostars, using temperature and density profiles previously derived from continuum observations. We approximate the formaldehyde abundance across the envelope with a jump function, the jump occurring when the dust temperature reaches 100 K, the evaporation temperature of the grain mantles. The observed formaldehyde emission is well reproduced only if there is a jump of more than two orders of magnitude, in four sources. In the remaining four sources the data are consistent with a formaldehyde abundance jump, but the evidence is more marginal (≤ 2 σ). The inferred inner H2CO abundance varies between 1 × 10⁻⁸and 6 × 10⁻⁶. The absolute
values of the jump in the H2CO abundance are uncertain by about one order of magnitude, because of the uncertainties in
the density, ortho to para ratio, temperature and velocity profiles of the inner region, as well as the evaporation temperature of the ices. We discuss the implications of these jumps for our understanding of the origin and evolution of ices in low mass star forming regions. Finally, we give predictions for the submillimeter H2CO lines, which are particularly sensitive to the
abundance jumps.
Key words.ISM: abundances - ISM: molecules - Stars: formation
1. Introduction
Low mass protostars form from dense fragments of molecular clouds. During the pre-collapse and collapse phases, the physi-cal and chemiphysi-cal composition of the matter undergoes substan-tial, sometimes spectacular, changes. From a chemical point of view, the pre-collapse phase is marked by the freezing of molecules onto the grain mantles. In the very inner parts of the pre-stellar condensations, molecules have been observed to progressively disappear from the gas phase (e.g. Tafalla et al. 2002; Bergin et al. 2002). The CO molecule, whose
condensa-Send offprint requests to: S´ebastien Maret, e-mail:
sebastien.maret@cesr.fr
tion temperature is around 20 K, is the best studied species both because it is the most abundant molecule after H2, and because
of its important role in the gas thermal cooling. CO depletion of more than a factor of ten has been observed in the centers of these condensations (Caselli et al. 1998, 2002; Bacmann et al. 2002). This large CO depletion is accompanied by a variety of changes in the molecular composition; the most spectacu-lar is the dramatic increase in the molecuspectacu-lar deuteration (up to eight orders of magnitude with respect to the D/H elemental abundance) observed in formaldehyde (Bacmann et al. 2003). The changes are recorded in the grain mantles, where the pre-collapse gas will be progressively stored. When a protostar is finally born, the dust cocoon warms up and the mantle species
2
evaporate into the gas phase, returning information from the previous phase.
Most of the studies of the composition of the grain mantles have been so far carried out towards massive protostars, be-cause they have strong enough IR continua against which the absorption of ices can be observed (e.g. Gerakines et al. 1999; Dartois et al. 1999; Gibb et al. 2000). The absorption technique allows one to detect the most important constituents of the grain mantles: H2O, CO, CO2, and sometime NH3, CH3OH and
H2CO (Schutte et al. 1996; Keane et al. 2001). In much cases,
the mantle composition of low mass protostars has been di-rectly observed. In these cases, the observations have been car-ried out towards protostars that possess a strong enough IR con-tinuum (e.g. Boogert et al. 2000b). If our understanding of the evolution of a protostar is basically correct, those protostars, typically Class I or border line Class II sources, represent a rel-atively evolved stage, where most of the original envelope has already been dispersed (e.g. Shu et al. 1987; Andr´e et al. 2000). Furthermore, the observed absorption may be dominated by foreground molecular clouds (Boogert et al. 2002). Thus, di-rect observations of the chemical composition of the primeval dust mantles of low mass protostars have so far proven to be elusive.
Alternatively, one can carry out an “archeological” study, looking at the composition of the gas in the regions, which are known or suspected to be dominated by the gas desorbed from grain mantles. This technique has the advantage of be-ing much more sensitive than the absorption technique, as it can detect molecules whose abundance (with respect to H2)
is as low as ∼ 10−11 against a limit of ∼ 10−6− 10−7 reach-able with the absorption technique. Indeed, several very com-plex molecules observed in the warm (≥ 100 K) gas of the so called hot cores have been considered hallmarks of grain mantle evaporation products (e.g. Blake et al. 1987). Once in the gas phase, molecules like formaldehyde and methanol, ini-tially in the grain mantles, trigger the formation of more com-plex molecules, referred to as daughter or second-generation molecules (e.g. Charnley et al. 1992; Caselli et al. 1993). The gas temperature and density are other key parameters in the chemical evolution of the gas, which has the imprint of the pre-collapse phase.
So far, hot cores have been observed in massive protostars, and are believed to represent the earliest stages of massive star formation, when the gas is not yet ionized by the new born star (Kurtz et al. 2000). Recently, however, it has been proposed that low mass protostars might also harbor such hot cores. Note that the definition of hot core is not unanimous in the litera-ture. Here we mean a region where the chemical composition reflects the evaporation of the ice mantles and subsequent reac-tions between those species (e.g. Rodgers & Charnley 2003). In this respect, Ceccarelli et al. (2000a,c) claimed that the low mass protostar IRAS16293-2422 shows evidence of an in-ner region (∼ 400 AU in size) warm enough (≥ 100 K) to evaporate the grain mantles, a claim substantially confirmed by Sch ¨oier et al. (2002). Indeed, very recent observations by Cazaux et al. (2003; see also Ceccarelli et al. 2000b) reveal also the presence of organic acids and nitriles in the core of IRAS16293-2422, substantiating the thesis of a hot core region
in which not only the ices have evaporated but also a subse-quent hot core chemistry has ensued. Furthermore, Maret et al. (2002) argued that NGC1333-IRAS4, another low mass very embedded protostar, has also such a warm region, somewhat less than 200 AU in size.
Formaldehyde is a relatively abundant constituent of the grain mantles and it is a basic organic molecule that forms more complex molecules (e.g. Charnley et al. 1992). For this reason, we studied the formaldehyde line emission originating in the envelopes of a sample of very embedded, Class 0 low mass protostars. In this article we report the first results of this systematic study. This is part of a larger project aimed to char-acterize as far as possible the physical and chemical composi-tion of low mass protostars during the first phases of formacomposi-tion. Jørgensen et al. (2002) determined the temperature and density structure for these sources and the CO abundance in the outer regions. A forthcoming paper will address the methanol line emission in the same source sample, as methanol is another key organic mantle constituent, linked by a common formation route with formaldehyde.
One of the ultimate goals of the present study is to under-stand the efficiency of H2CO against CH3OH formation in low
mass protostars, whether and how it depends on the parental cloud, and to compare it with the case of massive protostars. An immediate goal of the present article is to study the formalde-hyde abundance profile in the surveyed sample of low mass protostars. In a previous study that we carried out towards IRAS16293-2422, we concluded that formaldehyde forms on grain mantles and is trapped mostly in H2O-rich ices in the
in-nermost regions of the envelope and mostly in CO-rich ices in the outermost regions (Ceccarelli et al. 2000c, 2001). As the dust gradually warms up going inwards, formaldehyde is re-leased from the icy mantles all along the envelope. In the hot core like region (r ≤ 200 AU) the formaldehyde abundance jumps by about a factor 100 to ∼ 1 × 10⁻⁷ (Ceccarelli et al. 2000c; Sch ¨oier et al. 2002). Similarly, formaldehyde enhance-ment is observed in several outflows, because of ice man-tle sputtering in shocks (Bachiller & Perez Gutierrez 1997; Tafalla et al. 2000). In contrast, no jump of formaldehyde abun-dance has been detected in the sample of massive protostars studied by van der Tak et al. (2000). To firmly assess whether and by how much formaldehyde is systematically more abun-dant in the interiors of low compared to high mass proto-stars, a survey of more low mass protostars has to be carried out. This will allow us to answer some basic questions such as how, when and how much formaldehyde is formed on the grain mantles. Given that it forms more complex molecules (e.g. Bernstein et al. 1999) knowing the exact abundance of formaldehyde is fundamental to answer the question of whether or not pre- and/or biotic molecules can be formed in the 200 or so inner AUs close to the forming star.
In this article we report observations of formaldehyde emis-sion in a sample of eight Class 0 sources. After a preliminary analysis (rotational diagrams and LVG analysis), the observa-tions are analyzed in terms of an accurate model that accounts for the temperature and density gradients in each source, as well as the radiative transfer, which includes FIR photon pump-ing of the formaldehyde levels. The article is organized as
fol-lows: we first explain the criteria that lead to the source and line selection and the observations carried out (§2). In §3 we describe the results of the observations, in §4 we derive the approximate gas temperature, density and H2CO column
den-sity of each source by means of the standard rotational diagram technique and by a non-LTE LVG model. In §5 we derive the formaldehyde abundance in the inner and outer parts of the en-velope of each source, with an accurate model that takes into account the structure of the protostellar envelopes. Finally, in §6 we discuss the implications of our findings, and conclude in §7.
2. Observations
2.1. Target and line selection
We observed a sample of eight protostars, all of them Class
0 sources (Andr´e et al. 2000) located in the Perseus,
ρ-Ophiuchus and Taurus complexes, except L1157-MM that lies in an isolated clump (Bachiller & Perez Gutierrez 1997). The eight selected sources are among the brightest Class 0 sources in the Andr´e et al. (2000) sample. Their physical structure (dust density and temperature profiles) has been determined from their continuum emission by Jørgensen et al. (2002) except for L1448-N, which is analyzed in this paper (see Appendix A).
The source distances quoted by Jørgensen et al. (2002) were adopted. The list of the selected sources is reported in Table 1 together with their bolometric luminosity, enve-lope mass, the ratio of the submillimeter to bolometric lumi-nosity, and the bolometric temperature and distance. In the same Table, we also report the data relative to IRAS16293-2422, which was previously observed in H2CO transitions
by van Dishoeck et al. (1995) and Loinard et al. (2000), and studied in Ceccarelli et al. (2000c) and Sch ¨oier et al. (2002). IRAS16293-2422 will be compared to the other sources of the sample.
A list of eight transitions was selected, three ortho-H2CO
transitions and five para-H2CO transitions (Table 2). When
possible, the corresponding isotopic lines were observed in or-der to or-derive the line opacity. The transitions were selected to cover a large range of upper level energies (between ∼ 20 and ∼ 250 K) with relatively large spontaneous emission co-efficients Au,l (≥ 10−4 s−1). The latter condition is dictated
by the necessity to detect the line, whereas the first condi-tion aims to obtain lines that probe different regions of the en-velope. Finally, practical considerations, namely having more than one line in a single detector setting, provided a further con-straint. In the final selection we were helped by our pilot study on IRAS16293-2422 (Ceccarelli et al. 2000c) and by previous studies of the formaldehyde emission in molecular clouds and protostellar envelopes (Mangum & Wootten 1993; Jansen et al. 1994, 1995; Ceccarelli et al. 2003).
The formaldehyde transitions between 140 and 280 GHz were observed with the single dish IRAM-30m telescope1,
lo-cated at the summit of Pico Veleta in Spain. Higher frequency
1 IRAM is an international venture supported by INSU/CNRS
(France), MPG (Germany) and IGN (Spain).
lines were observed at the JCMT2, a 15 meter single dish
tele-scope located at the summit of Mauna Kea, Hawaii. The choice of the two telescopes allows us to have roughly similar beam sizes over the observed frequencies.
2.2. IRAM observations
The IRAM observations were carried out in November 19993 and September 2002. The various receivers available at the 30-m were used in different combinations to observe at least four transitions simultaneously. The image sideband rejection was always higher than 10 dB, and typical system tempera-tures were 200-300 K at 2 mm, and 200-500 K at 1 mm. The intensities reported in this paper are expressed in main beam temperature units, given by:
Tmb =
Feff
Beff
TA∗ (1)
where Beffis the main beam efficiency, and Feff is the forward
efficiency. The main beam efficiency is 69%, 57% and 42% at 140, 220 and 280 GHz respectively, and the forward efficiency is 93%, 91% and 88% at the same frequencies. Each receiver was connected to an autocorrelator unit. For the 1 and 2 mm bands, a spectral resolution of 80 kHz and a bandwidth of 80 MHz was used. These spectral resolutions correspond to a ve-locity resolution of 0.09-0.17 km s−1depending on frequency. All IRAM observations were obtained in position switching mode. The absolute calibration was regularly checked and was about 10%, 15% and 20% at 140-170 GHz, 220-240 GHz and 280 GHz respectively. Pointing was also regularly checked and was better than 3”.
2.3. JCMT observations
The JCMT observations were obtained in February 2001, August 2001 and February 2002. The single sideband dual polarization receiver B3 was used with the Digital Autocorrelation Spectrometer (DAS). Typical system temper-atures were 400 to 800 K. A spectral resolution of 95 kHz for a 125 MHz bandwidth was used for most of the lines, while a resolution of 378 kHz for a bandwidth of 500 MHz was used to observe some of the lines simultaneously. These spectral res-olutions correspond to a velocity resolution of 0.08-0.32 km s−1. The antenna temperatures were converted into main beam temperature scale using4
Tmb=
T∗
A
ηmb
(2)
2 The JCMT is operated by the Joint Astronomy Center in
Hilo, Hawaii on behalf of the present organizations: The Particle Physics and Astronomy Research Council in the United Kingdom, the National Research Council of Canada and the Netherlands Organization for Scientific Research.
3 IRAM November 1999 data have also been presented in
Loinard et al. (2002a)
4 JCMT does not follow the same convention for antenna
temper-ature than IRAM, the JCMT antenna tempertemper-ature T∗
A being already
2
Table 1. The observed sample. IRAS16293-2422, which has been studied elsewhere (see text) is included for comparison.
Source α(2000) δ(2000) Cloud Dist.a L
bolb Menvb Lsmm/Lbolc Tbolb
(pc) (L⊙ ) (M⊙ ) (%) (K) NGC1333-IRAS4A 03:29:10.3 +31:13:31 Perseus 220 6 2.3 5 34 NGC1333-IRAS4B 03:29:12.0 +31:13:09 Perseus 220 6 2.0 3 36 NGC1333-IRAS2 03:28:55.4 +31:14:35 Perseus 220 16 1.7 .1 50 L1448-MM 03:25:38.8 +30:44:05 Perseus 220 5 0.9 2 60 L1448-N 03:25:36.3 +30:45:15 Perseus 220 6 3.5 3 55 L1157-MM 20:39:06.2 +68:02:22 Isolated 325 11 1.6 5 60 L1527 04:39:53.9 +26:03:10 Taurus 140 2 0.9 0.7 60 VLA1623 16:26:26.4 -24:24:30 ρ-Ophiuchus 160 1 0.2 10 <35 IRAS16293-2422d 16:32:22.7 -24:38:32 ρ-Ophiuchus 160 27 5.4 2 43 a From Andr´e et al. (2000), except for Perseus sources (Cernis 1990).
b From Jørgensen et al. (2002) c From Andr´e et al. (2000) d Included for comparison.
where ηmbis the main beam efficiency, equal to 63% at the
ob-served frequencies. The calibration and pointing were regularly checked using planets and were found to be better than 30% and 3” respectively. The JCMT observations were obtained in beam switching mode, with a 180” offset.
3. Results
The observed H2CO line spectra are shown in Figs. 1 and 2 and
the results of the observations are summarized in Table 2. Most of the lines are relatively narrow (FWHM ∼ 2-3 km s−1) with a small contribution (≤ 5%) from wings extending to larger velocities. The higher the upper level energy of the transition the lower the contribution of the wings, which prac-tically disappear in the lines observed with JCMT. NGC1333-IRAS4A and NGC1333-IRAS4B represent an exception to this picture. The line spectra of these two sources are broad (∼ 5 km s−1) and the wings are more pronounced than in the other sources. Evidence of self-absorption and/or absorption from foreground material is seen in most sources, in particular in low lying lines.
In this study we focus on the emission from the envelopes surrounding the protostars. Hence, we are interested in the in-tensity of the narrow component of the lines, that we fitted with a Gaussian. In some cases, a residual due to the “high” velocity wings remains, and that has not been included in the line flux estimate. When a Gaussian fitting was not possible because of self-absorption, the flux of the lines was estimated by integrating over a velocity range of ± 2 km s−1around the source Vlsr. This velocity range corresponds to the width of the
lines with high upper level energies, where self-absorption is less important. For these lines, the self-absorption is included in the line flux determination, and the flux measured is there-fore slightly smaller than the one that would have been obtained by a Gaussian fitting. We observed the brightest lines in the13C
isotopomer of formaldehyde, as reported in Table 3.
Finally, the errors quoted in Table 2 and 3 include both the statistical uncertainties and the calibration error. For non de-tected lines we give the 2σ upper limit defined as follows:
Fmax= 2(1 + α) σ
√
∆v δv (3)
where σ is the RMS per channel, ∆v is the line width estimated from detected lines on the same source, δv is the channel width, and α is the calibration uncertainty.
4. Approximate analysis
4.1. Line opacities
The detection of some H13
2 CO transitions allows to estimate
the line opacities of the relevant H12
2 CO lines. Using the escape
probability formalism and assuming that the H13
2 CO lines are
optically thin, the ratio between the H13
2 CO and H 12
2 CO line
fluxes can be expressed as:
FH12 2CO FH13 2CO =[ 12C] [13C]β (4)
where β is the escape probability, which, in the case of a homo-geneous slab of gas (de Jong et al. 1980), is equal to:
β = 1 − exp(−3τ)
3τ (5)
and [[1213C]C] is the isotopic elemental ratio, equal to 70
(Boogert et al. 2000a). In the previous equation, we assume that the H122 CO to H132 CO ratio is equal to the isotopic ele-mental ratio, as supported by the available observations (e.g. Sch ¨oier et al. 2002). Using this equation, the opacities values reported in Table 4 are obtained.
The opacity values reported in Table 4 are relatively low, which indicates that the lines are moderately thick, vwith the exception of the line at 351 GHz towards NGC1333-IRAS2. The uncertainty on the latter opacity is however relatively large, as shown by the errors bars reported in Table 4.
Fig. 1. Spectra of the eigth H2CO transitions in Table 2 observed towards IRAS4A, IRAS4B,
NGC1333-IRAS2, and L1448-MM respectively.
4.2. Rotational diagram analysis
To obtain a first order estimate, we derived the beam-averaged column density of formaldehyde and rotational temperature by means of the standard rotational diagram technique (see Goldsmith & Langer 1999 for a general description of the
method, and Mangum & Wootten 1993 for its application to formaldehyde lines).
Fig. 4 shows the H2CO rotational diagrams of the observed
sources. In these diagrams, the ortho to para ratio of formalde-hyde was kept as a free parameter, and was derived by min-imizing the χ2between the observed fluxes and the rotational
2
Fig. 2. As Fig. 2 for the sources L1448-N, L1157-MM, L1527 and VLA1623.
diagram predictions. The best agreement is obtained for a value of about 2 on all the sources. The fact that this value is lower than the high-temperature limit of 3 suggest that the formalde-hyde is formed at low temperature, around 20 K (Kahane et al. 1984). However, while this ratio seems to be the same for all sources, we emphasize that it is highly uncertain. In particu-lar, the fact that the same transitions have been observed on all
the sources can lead to systematic errors on this value. A more accurate derivation of the ortho to para ratio would need a cor-rection for the line opacities, which has the effect of scattering the points in the rotational diagram (see Goldsmith & Langer 1999, for a review on the effect of opacities in a rotational diagram). This correction is not possible here as only a lim-ited number of H132 CO transitions has been observed. The 52,4
-Table 2. Integrated fluxes of H2CO lines in TmbdV units . Upper limits are given as 2 σ. The “-” symbol indicates lack of the relevant observation. o-H2CO p-H2CO Transition 21,2-11,1 41,4-31,3 51,5-41,4 30,3-20,2 32,2-22,1 50,5-40,4 52,4-42,3 54,2-44,1a Eu(K) 21.9 45.6 62.4 21.0 68.1 52.2 96.7 234 Au,l(s−1) 5.4 × 10⁻⁵ 6.0 × 10⁻⁴ 1.2 × 10⁻³ 2.9 × 10⁻⁴ 1.6 × 10⁻⁴ 1.4 × 10⁻³ 1.2 × 10⁻³ 5.0 × 10⁻⁴ ν(GHz) 140.839 281.527 351.769 218.222 218.476 362.736 363.946 364.103 gu 5 9 11 7 7 11 11 11
Telescope IRAM IRAM JCMT IRAM IRAM JCMT JCMT JCMT
HPBW (”) 17 9 14 11 11 14 14 14 ηmbor Beff/Feff 0.74 0.47 0.63 0.62 0.62 0.63 0.63 0.63 NGC1333-IRAS4A 9.1 ± 1.4 10.6 ± 2.6 5.5 ± 1.2 9.3 ± 1.9 2.2 ± 0.4 2.9 ± 1.0 1.2 ± 0.6 1.7 ± 0.9 NGC1333-IRAS4B 6.8 ± 1.0 12.1 ± 3.0 7.5 ± 1.7 9.6 ± 1.9 4.7 ± 1.0 5.9 ± 2.1 3.6 ± 1.0 0.9 ± 0.6 NGC1333-IRAS2 4.3 ± 0.6 5.8 ± 1.5 1.6 ± 0.4 4.9 ± 1.0 1.0 ± 0.2 1.8 ± 0.6 0.6 ± 0.4 <0.4 L1448-MM 3.3 ± 0.7 4.7 ± 1.1 1.0 ± 0.2 3.4 ± 0.6 0.4 ± 0.1 1.3 ± 0.4 0.2 ± 0.1 <0.1 L1448-N 7.9 ± 0.9 6.9 ± 1.6 3.8 ± 0.9 5.7 ± 0.9 - - 0.6 ± 0.2 -L1157-MM 1.2 ± 0.2 2.1 ± 0.5 1.2 ± 0.3 1.1 ± 0.3 <0.2 0.5 ± 0.2 <0.1 <0.1 L1527 2.8 ± 0.7 4.5 ± 1.1 1.0 ± 0.3 3.0 ± 1.3 0.2 ± 0.1 0.4 ± 0.2 - -VLA1623 3.8 ± 1.2 2.7 ± 1.2 0.9 ± 0.2 5.0 ± 1.5 - 1.2 ± 0.4 <0.2 <0.3
a Blended with the 5
4,1-44,0H2CO line.
Fig. 3. Spectra of the observed H13
2 CO lines.
42,3 line was only detected towards NGC1333-IRAS4A and
NGC1333-IRAS4B. Because of its high energy (234 K), this line is probably excited in hotter regions, and would increase the derived rotational temperature. This line was not included
to keep the derived parameters comparable from one source to the other.
Table 5 summarizes the derived total column densities and rotational temperatures. The column densities range from 2 to 7 × 1013cm−2, and the rotational temperatures from 11 to 40 K.
2
Table 3. Integrated fluxes of H213CO lines in TmbdV units. Upper limits are given as 2 σ. The “-” symbol indicates lack of the
relevant observation. o-H13 2CO p-H 13 2 CO Transition 21,2-11,1 41,4-31,3 51,5-41,4 52,4-42,3 Eu(K) 21.7 44.8 61.3 98.5 Au,l(s−1) 1.5 × 10⁻⁴ 1.7 × 10⁻³ 3.4 × 10⁻³ 1.1 × 10⁻³ ν(GHz) 137.450 274.762 343.325 354.899 HPBW (”) 17 9 14 14
Telescope IRAM IRAM JCMT JCMT
ηmbor Beff/Feff 0.74 0.47 0.63 0.63 NGC1333-IRAS4A 0.4 ± 0.1 0.3 ± 0.1 0.3 ± 0.2 <0.1 NGC1333-IRAS4B - - 0.3 ± 0.1 <0.1 NGC1333-IRAS2 0.2 ± 0.1 - 0.4 ± 0.2 <0.1 L1448-MM - - <0.1 <0.2 L1448-N 0.2 ± 0.1 <0.1 - -L1157-MM - - <0.1 <0.1
Table 4. H2CO lines opacities derived from the H213CO observations.
o-H2CO p-H2CO Transition 21,2-11,1 41,4-31,3 51,5-41,4 52,4-42,3 NGC1333-IRAS4A 1.0+0.7 −0.4 0.5 +1.2 −0.4 1.2 +9.9 −0.7 <2 NGC1333-IRAS4B - - 0.9+1.3 −0.5 <0.5 NGC1333-IRAS2 1.1+1.9 −0.6 - 5.5 +11.1 −2.2 <4 L1448-MM - - <2 -L1448-N 0.4+1.1 −0.3 <0.1 - -L1157-MM - - <1.4
-The values are both only lower limits to the actual gas tempera-ture and column density, as the gas temperatempera-tures can actually be significantly higher in the case of non-LTE conditions, and the derived column density can also be higher in case of optically thick emission. To correct for this effect, the derived column densities were recalculated adopting the average value of opac-ities quoted in Table 4. The corrected column densopac-ities are also reported in Table 5, and range from 0.8 to 2 ×1014cm−2.
4.3. LVG modeling
In order to derive the physical conditions of the emitting gas under non-LTE conditions, the formaldehyde emission has been modeled using an LVG code5. The collisional coefficients from Green (1991) and the Einstein coefficients from the JPL database (Pickett et al. 1998) were used. The LVG code has three free parameters: the column density to line width ratio
N(H2CO)
∆v (which regulates the line opacity), the gas temperature
Tgas, and the molecular hydrogen density n(H2). When the lines
are optically thin the line ratios only depend on the latter two parameters. Since we measured only marginally optically thick lines, the gas temperature and density were first constrained based on the line ratios predicted in the case of optically thin lines. The absolute line fluxes predicted by the model were
5 Details on the used LVG code can be found in Ceccarelli et al.
(2002).
then compared with observations to constrain the H2CO
col-umn density.
The gas temperature and density have been determined by minimizing the χ2
red, defined as:
χ2red= 1 N − 2 N X 1 (Observations − Model)2 σ2 (6)
where all the observed H2CO lines were included. Fig. 5 show
the χ2 contours. The derived T
gas and n(H2) are reported in
Table 5. The H2CO column densities were then constrained
us-ing the observed o-H2CO 51,5-41,4line flux, under the
assump-tion of optically thin emission.
The derived temperatures are between 30 and 90 K. These temperatures are significantly higher than the rotational tem-perature, suggesting that the observed transitions are subther-mally populated. Indeed, the derived densities support this con-clusion, as they vary between 1 and 6 × 105 cm−3. It is re-markable that the density range is so small, but the density es-timate is certainly biased because of the choice of the transi-tions. In particular, the densities are slightly lower than those found by Blake et al. (1995) and van Dishoeck et al. (1995) for NGC1333-IRAS4A, NGC1333-IRAS4B, and IRAS16293-2422. This is probably due to the fact that those studies cluded only the higher frequency lines whereas we here in-cluded also lower frequency, and thus lower critical density lines. This re-inforces the conclusion that a range of densi-ties are present in the envelope, as predicted by the power-law density structure derived from continuum observations
Fig. 4. H2CO rotational diagrams derived for the observed sources. Circles and squares mark the ortho and para H2CO transitions
respectively. Fluxes of the para transitions have been multiplied by the ortho to para ratio, obtained by minimizing the χ2between
the observations and the predictions of the rotational diagram (see text). Solid lines show the best fit curves.
(Jørgensen et al. 2002). Finally, the H2CO column densities
de-rived with the rotational diagram method are typically lower by less than a factor 5 than the ones derived using the LVG method with the exception of NGC1333-IRAS2.
Table 5 also reports estimates of the average H2CO
abun-dance in each source, obtained dividing the H2CO by the
H2 column densities derived by Jørgensen et al. (2002) from
submillimeter continuum observations. The latter refer to the amount of material with a temperature larger than 10 K, typi-cally at a distance of several thousands of AUs, more than the envelope encompassed by the beam of our observations. This material is likely an upper limit to the column density of the gas emitting the H2CO lines, but it provides a first
approxi-mate estiapproxi-mate of the H2CO abundance. Table 5 shows rather
large variations in the H2CO abundance from source to source.
Given the approximation of the method used to derive them, this spread may not be entirely real. In the next section we
an-alyze the observed lines by means of an accurate model that takes into account the source structure.
5. Protostellar envelope model
5.1. Model description
The model used computes the line emission from a spherical envelope. Dust and gas have density and temperature gradi-ents, that are approximated as follows. The density profile is described by a power law n(H2) ∝ r−α, where α is between 0.5
and 2. The case α = 1.5 corresponds to an entirely free-falling envelope, whereas α = 2 would mimic an isothermal sphere in hydrostatic equilibrium. The densities and dust temperature profiles of all the sources of the sample have been derived by Jørgensen et al. (2002), except for L1448-N, whose analysis is reported in Appendix A.
2
Table 5. Results of the rotational diagram and LVG analysis.
Rotational Diagram LVG
Source Trot Nthin(H2CO) N(H2CO)a Tgas n(H2) N(H2CO)b H2CO/H2c CO/H2d
(K) (cm−2) (cm−2) (K) (cm−3) (cm−2) NGC1333-IRAS4A 25 7 × 10¹³ 2 × 10¹⁴ 50 3 × 10⁵ 1 × 10¹⁵ 5 × 10⁻¹⁰ 8 × 10⁻⁶ NGC1333-IRAS4B 40 7 × 10¹³ 2 × 10¹⁴ 80 3 × 10⁵ 2 × 10¹⁴ 7 × 10⁻¹⁰ 1 × 10⁻⁵ NGC1333-IRAS2 24 3 × 10¹³ 1 × 10¹⁴ 70 3 × 10⁵ 5 × 10¹³ 1 × 10⁻¹⁰ 2 × 10⁻⁵ L1448-MM 19 2 × 10¹³ - 30 3 × 10⁵ 6 × 10¹³ 4 × 10⁻¹⁰ 4 × 10⁻⁵ L1448-N 22 5 × 10¹³ 8 × 10¹³ 90 1 × 10⁵ 3 × 10¹³ 7 × 10⁻¹⁰ -L1157-MM 18 1 × 10¹³ - 80 3 × 10⁵ 4 × 10¹³ 3 × 10⁻¹¹ 6 × 10⁻⁶ L1527 16 3 × 10¹³ - 30 6 × 10⁵ 4 × 10¹³ 1 × 10⁻⁹ 4 × 10⁻⁵ VLA1623 11 3 × 10¹³ - 80 1 × 10⁵ 8 × 10¹³ 3 × 10⁻¹⁰ 2 × 10⁻⁴
a Corrected for opacity effects, assuming a value of τ = 1 for NGC1333-IRAS4A, NGC1333-IRAS4B and NGC1333-IRAS2 and τ = 0.4
for L1448-N respectively (see Table 4.
b Averaged over a 10” beam. c From H
2column densities quoted by Jørgensen et al. (2002) d From Jørgensen et al. (2002)
Fig. 5. χ2contours as a function of the density and temperature of the emitting gas. Contours indicates the 1, 2 and 3σ confidence levels respectively.
The gas temperature profile has then been computed by using the model developed by Ceccarelli et al. (1996), which solves the thermal balance in the envelope. In order to compute the gas temperature, one needs to solve the radiative transfer of the main coolants of the gas, i.e. H2O, CO and O. For the water
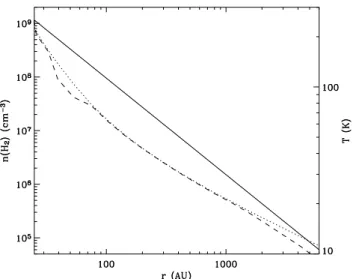
abundance in the inner and outer regions we used the values derived by the analysis of IRAS16293-2422 (Ceccarelli et al. 2000a) and NGC1333-IRAS4 (Maret et al. 2002): 4 × 10⁻⁶and 4 × 10⁻⁷respectively. The CO abundance in the outer region is taken to be 10−5(e.g. Jørgensen et al. 2002), lower than the canonical value, as this species is depleted in the cold parts of the envelope. Finally, the oxygen abundance is taken to be 2.5 × 10⁻⁴. Fig. 6 shows as a typical example the case of NGC1333-IRAS2. The gas temperature tracks closely, but not completely, the dust temperature. In the very inner region the gas is colder than the dust because of the increase of the water abundance caused by the icy mantle evaporation (when Tdust ≥ 100 K),
which increases the gas cooling capacity. In the very outer re-gion the gas is colder than the dust too, because of the effi-cient gas cooling by the CO lines (see also the discussion in Ceccarelli et al. 1996 and Maret et al. 2002). These differences concern however small regions in the envelope, and therefore the results would be essentially the same if the gas and dust temperature are assumed to be equal. To fully quantify this ef-fect, we ran a model for NGC1333-IRAS2 with a gas temper-ature equal to the dust one, and no significant differences were found.
The velocity field, which regulates the line opacity in the inner envelope, has been approximated as due to free falling gas towards a 0.5 M⊙central object in all sources (no turbulent broadening is taken into account). In view of the importance of ice evaporation, the formaldehyde abundance across the enve-lope has been modeled by a step function: when the dust tem-perature is lower than the ice mantle evaporation (Tdust ≤ 100
K) the abundance has the value Xout , whereas it increases to
Xinin the Tdust ≥ 100 K region. Finally, a H2CO ortho to para
ratio of 3 was assumed6. We will discuss the dependence of
the obtained results on these “hidden” parameters in the next section.
Finally, the line emission is computed by solving the radia-tive transfer in presence of warm dust in the escape probability formalism where the escape probability β is computed at each point of the envelope by integrating the following function over the solid angle Ω (Ceccarelli et al. 1996):
β = kd kL+ kd + kL (kL+ kd)2 Z dµ1 − exp [− (kL+ kd) ∆Lth] ∆Lth (7) where kL and kd are the line and dust absorption coefficients
respectively, and ∆Lthis the line trapping region, given by the
following expressions: ∆Lth = 2∆vth v r 1 − 3 2µ 2 !−1 (8)
6 Since the value of 2 obtained with the rotational diagrams is
highly uncertain, we prefer to adopt the canonical value of 3 for the standard model. We will show in section 5.3.3 that the results are not substantially affected by this value.
Fig. 6. Density (solid line), gas (dashed line) and dust (dotted
line) temperature across the envelope of NGC1333-IRAS2.
in the infalling region of the envelope (where arcos (µ) is the angle with the radial outward direction) and
∆Lth= r 1 −
r Renv
!
(9)
in the static region (where Renvis the envelope radius). In the
previous equations, ∆vth is the thermal velocity width and v
is the infall velocity. In practice, the photons emitted by the dust can be absorbed by the gas and can pump the levels of the formaldehyde molecules. At the same time, photons emitted by the gas can be absorbed by the dust (at the submillimeter wavelengths the dust absorption is however negligible).
5.2. Results
In order to constrain the inner and outer formaldehyde abun-dance in the envelope, we run a grid of models, varying Xout
between 10−12 and 10−8, and Xin between 10−12 and 10−4 re-spectively for each source. Both parameters were constrained by minimizing the χ2red. The best fit model for each source was then obtained from the χ2red diagrams shown in Fig. 7, and the parameters are summarized in Table 6. The list of predicted o-H2CO spectra for each source are reported in Appendix B.
Xout is well constrained in all sources, and varies between
8 × 10⁻¹¹ and 8 × 10⁻¹⁰. These values differ on average by a factor 3 from the abundances derived by the LVG analysis. In four sources (NGC1333-IRAS4B, NGC1333-IRAS2, L1448-MM and L1527) the value of Xin is also well constrained by
the observations, with a 3σ confidence level. In three sources (NGC1333-IRAS4A, L1448-N and L1157-MM) we also de-tected formaldehyde abundance jumps, but the level of confi-dence is less or equal to 2σ. VLA1623 is the only source where no evidence of a jump is detected, although the data would not be inconsistent with it. The measured Xin values are between
1 × 10⁻⁸and 6 × 10⁻⁶, and the jumps in the formaldehyde abun-dance are between 100 and 104.
2
Fig. 7. Protostellar envelope model χ2
redcontours as a function of the outer and inner H2CO abundances. The contours levels show
the 1, 2, and 3 σ confidence levels respectively.
Table 6. Formaldehyde abundances as derived from the envelope model in the outer parts of the envelope (Xout) and the inner
parts of the envelope (Xin). The table also includes the radius where the dust temperature is 100 K and 50 K, and the density at
the radius where the dust temperature is 100 K.
Source R100K R50K n100K Xout Xin (AU) (AU) (cm−3) NGC1333-IRAS4A 53 127 2 × 10⁹ 2 × 10⁻¹⁰ 2 × 10⁻⁸ NGC1333-IRAS4B 27 101 2 × 10⁸ 5 × 10⁻¹⁰ 3 × 10⁻⁶ NGC1333-IRAS2 47 153 3 × 10⁸ 3 × 10⁻¹⁰ 2 × 10⁻⁷ L1448-MM 20 89 2 × 10⁸ 7 × 10⁻¹⁰ 6 × 10⁻⁷ L1448-N 20 95 1 × 10⁸ 3 × 10⁻¹⁰ 1 × 10⁻⁶ L1157-MM 40 105 8 × 10⁸ 8 × 10⁻¹¹ 1 × 10⁻⁸ L1527 20 140 3 × 10⁶ 3 × 10⁻¹⁰ 6 × 10⁻⁶ VLA1623 13 48 2 × 10⁸ 8 × 10⁻¹⁰ -IRAS16293-2422a 133 266 1 × 10⁸ 1 × 10⁻⁹ 1 × 10⁻⁷ a From Ceccarelli et al. (2000c).
Fig. 8. Ratio of the model predictions over the observed fluxes
of H2CO lines as a function of the upper energy of the line,
for NGC1333-IRAS2. In the left panel a jump in the abun-dance (Tab. 6) is adopted, while the in the right panel a constant abundance across the envelope is assumed. The circles and the squares represent H12
2 CO and H 13
2 CO lines respectively. The
ar-rows represent lower limits.
To illustrate the reliability of the derived jumps, Fig. 8 shows the ratio between the model and the observations in the cases of no abundance jump and with a jump, for NGC1333-IRAS2 as an example. The constant abundance model can re-produce the observed fluxes of the lower transitions well, but it definitively underestimates the flux of the lines originating from the higher levels.
In the next section, we discuss the effects of the other model parameters on the H2CO abundance determination.
5.3. Dependence on other parameters of the model
The derived formaldehyde abundances depend on four hid-den parameters: the adopted velocity and hid-density profiles, the H2CO ortho to para ratio and the evaporation temperature. In
the following we discuss the influence of all these parameters on the determination of the H2CO inner abundance.
5.3.1. Velocity profile
In our analysis, we assumed a velocity profile of a free falling envelope, given by:
v(r) = 2GM r
!1/2
(10)
where G is the gravitational constant and M the mass of the central star. The choice of a free falling velocity profile seems natural, as these protostars are believed to be in ac-cretion phase (e.g. Andr´e et al. 2000). Yet, the central mass is a poorly constrained parameter. Recently, Maret et al. (2002) and Ceccarelli et al. (2000a) derived a central mass of 0.5 and 0.8 M⊙ for NGC1333-IRAS4A and IRAS16293-2422 respec-tively. Here we adopt a central mass of 0.5 M⊙ for all the ob-served sources, but this parameter could vary from one source to the other.
A different choice for the velocity profile could change the derived abundance. In particular, a higher central mass would
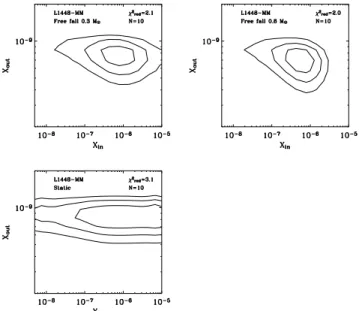
Fig. 9. χ2
red diagrams of L1448-MM for three different
veloc-ity profiles. The upper left and upper right panels show the χ2redcontours derived for a free falling envelope with a central mass of 0.3 and 0.8 M⊙ respectively. The lower panel shows the static envelope case, with a 1 km s−1 turbulent velocity. Contours indicate the 1, 2 and 3σ confidence levels respec-tively.
imply a higher velocity gradient in the central parts of the enve-lope, and as a consequence, a lower opacity of the H2CO lines.
This lower opacity would decrease the formaldehyde abun-dance needed to reproduce a given flux. These differences are expected to affect mainly the high lying lines, which originate in the inner parts of the envelope.
In order to quantify this effect on the derived formaldehyde abundances, two models of L1448-MM were run, using a cen-tral mass of 0.3 and 0.8 M⊙ respectively. A third model was also run to check the case of a static envelope, where a turbu-lent line broadening of 1 km s−1 has been added. This model was adopted by Jørgensen et al. (2002), and reproduced well the observed low J CO emission, which originates in the static envelope.
Figure 5.3.1 shows the χ2
reddiagrams obtained in the three
cases. While the derived outer formaldehyde abundance is not much affected by the adopted velocity field, the inner abun-dance changes significantly when adopting a static envelope rather than a free-fall profile. Yet, the inner abundance is well constrained in the first two cases (free-fall with different central masses), and very weakly depends on the adopted central mass: 8 × 10⁻⁷and 5 × 10⁻⁷for 0.3 and 0.8 M⊙ respectively. On the contrary, only a lower limit is obtained if a static envelope is adopted: > 3 × 10⁻⁸. This is due to different line opacities in the three cases. In a static envelope, the high lying lines become more easily optically thick, because of the reduced linewidth with respect to the free-fall cases. For this reason, these lines do not depend on Xin , when Xin is ∼ 10−7, because they
be-come optically thick. This explains why only a lower limit on
2
5.3.2. Density profile
The H2CO abundances depend on the density profile derived
from the continuum observations. In particular, the observa-tions used to derive the physical structure of the envelopes have been obtained with a typical beamwidth of 10′′, i.e. 2200 AU at the distance of NGC1333. The observed continuum is therefore not very sensitive to the physical conditions in the in-nermost regions of the envelope, at scales smaller than a few hundred AUs. Consequently, the derived density power-law in-dex reflects rather the density in the outer part of the envelope, and the inner density, extrapolated from these power law, may be a rough estimate. Finally, the determination of the density profiles of some of the sources of the sample was difficult be-cause of the existence of multiple components (Jørgensen et al. 2002). Jørgensen et al. (2002) reported an average uncertainty of ±0.2 on the power-law index. If the density at the outer radius of the envelope is assumed to be correctly determined by the continuum observations, the uncertainty on the power-law index corresponds to an uncertainty of a factor five on the density at the inner radius of the envelope. In order to check the effect of this uncertainty on the derived abundances, we ran models of NGC1333-IRAS4B with an inner density arti-ficially multiplied by a factor 5 (note that the outer density is not changed). Whereas the H2CO outer abundance remains
un-changed, the inner abundance decreases by about the same fac-tor 5. Uncertainties in the inner density could therefore lead to uncertainties on the derived inner abundances of the same order of magnitude.
5.3.3. The H2CO ortho to para ratio
The derived formaldehyde abundances depend also on the value of the H2CO ortho to para ratio. Given the relatively
low number of observed lines, this parameter cannot be con-strained by the present observations. Actually, it is very badly constrained even in the case of IRAS16293-2422, where many more formaldehyde lines have been observed. Ceccarelli et al. (2000c) and Sch ¨oier et al. (2002) report a value for the ortho and para ratio around 3, but with a large uncertainty. We thus adopted the canonical value of 3 in our analysis (Kahane et al. 1984).
As an example, Fig. 10 shows the influence of this parame-ter on the derived H2CO abundance of NGC1333-IRAS4A. We
ran models with the ortho to para ratio 1, 2 and 3 respectively. While the derived inner and outer abundances are almost iden-tical for the three ratios, the abundance jump is slightly better constrained for a ratio of 1 (3σ) than an higher ratio (2σ).
5.3.4. Evaporation temperature
Finally, the evaporation temperature Tev, at which the
formaldehyde desorption occurs, is also a hidden parame-ter of our model. As described in §5.1, in the present study we adopted Tev = 100 K, which corresponds to the
evapo-ration of water ices (Aikawa et al. 1997). However, part of the desorption could also occur at the evaporation temper-ature of pure formaldehyde ices (50 K; Aikawa et al. 1997;
Fig. 10. χ2
red diagrams of NGC1333-IRAS4 for three different
ortho to para ratios. The upper left, upper right and lower pan-els shows the χ2red contours derived for an ortho to para ratio of 1, 2 and 3 respectively. Contours indicates the 1, 2 and 3σ confidence levels respectively.
Fig. 11. χ2
red diagrams of NGC1333-IRAS2 for an
evapora-tion temperature of 100 K (left panel) and 50 K (right panel). Contours indicates the 1, 2 and 3σ confidence levels respec-tively.
Rodgers & Charnley 2003). For example, a detailed analysis of the formaldehyde spatial emission in IRAS16293-2422 has shown that the formaldehyde abundance has a first jump, of about a factor 10, where Tdust ≥ 50 K, and a second jump of
about a factor 25 where Tdust ≥ 100 (Ceccarelli et al. 2001).
However, given the relatively small number of observed lines and the absence of spatial information on the formaldehyde emission in the source sample of the present study, we limited the H2CO abundance profile to a single step function. In order
to check if the data are also consistent with a jump at 50 K, a model with a jump in the abundance at 50 K for NGC1333-IRAS2 was run (see Fig. 11). While Xoutis very little sensitive
to this parameter, Xinis about ten times smaller when assuming
a jump at 50 K (2 × 10⁻⁷and 2 × 10⁻⁸for 100 and 50 K re-spectively). We note, however, that the best agreement with the data is obtained for an evaporation temperature of 100 K (χ2
red
5.3.5. Summary
In the χ2
red analysis of §5.2, we adopted the most reasonable
values of the various hidden parameters in the model. In this section we have explored the effect of variations in them on the derived abundance jumps. We emphasize that the actual value of the jump as well as the precise location are quite uncer-tain. Based on the previous analysis, the adopted velocity field seems to affect most strongly the amplitude and/or the presence of the derived jump, in particular when a static, turbulent field is considered. The other three parameters, the inner density, the ortho to para ratio, and the evaporation temperature seem to play a minor role. In this sense, the model assumption of an infalling envelope is probably the most critical in the present analysis. As already mentioned, we favor the hypothesis of col-lapsing envelopes, both because evidences are accumulating in this direction (e.g. Di Francesco et al. 2001), and because it is the most natural one.
To summarize, the sources (i.e. NGC1333-IRAS4B, NGC1333-IRAS2, L1448-MM and L1527) where the χ2
red
analysis yields 3σ evidence for jumps, the presence of an abundance jump is rather firm in our opinion. Although more marginal, the data are consistent with the presence of a jump in the other surveyed sources as well. Appendix B lists the predicted fluxes of the brightest ortho formaldehyde lines. Predictions of para H2CO line fluxes can be found on the web
site MEPEW7 (Ceccarelli et al. 2003). In particular, the sub-millimeter lines are sensitive to the presence and amplitude of the jump in the H2CO abundance, and future observations with
existing (JCMT, CSO) and future (e.g. SMA, ALMA) submil-limiter telescopes will better constrain this value.
6. Discussion
The first remarkable and by far the most important result of this study is the evidence for a region of formaldehyde evaporation in seven out of eight observed sources. In these regions, the formaldehyde abundance jumps to values two or more orders of magnitude larger than the abundance in the cold outer envelope. The transition is consistent with the location where the dust temperature reaches 100 K. The radius of these warm regions is between 13 and 133 AU, and the densities8are between 1 and 20 × 108cm−3. A straightforward interpretation of this result is that the grain mantles sublimate at 100 K, releasing into the gas phase their components, and, among them, formaldehyde. In addition, recent observations have shown the presence of complex molecules, typical of massive hot cores (Cazaux et al. 2003) towards IRAS16293-2422, the first studied hot core of low mass protostars (Ceccarelli et al. 2000a,b,c; Sch ¨oier et al. 2002). The similarity with the well studied hot cores of the massive protostars is certainly striking: warm, dense, and
com-pact regions chemically dominated by the mantle evaporation.
Even though the chemistry can be, and very probably is
differ-7 http://www-laog.obs.ujf-grenoble.fr/˜ceccarel/mepew/mepew.html 8
L1527 is an exception, with a density of 3×106cm−3, but, as
com-mented by Jørgensen et al. (2002) this may be due to the contribution of the disk, that may dominate the continuum emission in the inner parts of this source (Loinard et al. 2002b).
Fig. 12. Derived H2CO Xinabundances as a function of the
den-sity (left panel) and the radius (right panel) where Tdust= 100
K. The star represent IRAS16293-2422.
Fig. 13. Derived H2CO Xin abundances as a function of
Lsmm/Lbol. The star represent IRAS16293-2422.
ent in high and low mass protostars, the hot cores represent ba-sically the same process in both type of sources. Our study does not address the possibility that some of the H2CO ice mantles
may be liberated by shocks interacting with the inner envelope, since the line wings have been excluded from our analysis. The role of shocks could be studied by future high angular resolu-tion maps of the line center and line wing emission.
6.1.
X
inversusL
smm/
L
bolThe H2CO abundance in the inner region shows a loose trend
with a variety of source characteristics. These include the den-sity in the inner region and the size of the region (Fig. 12), as well as the ratio of the submillimeter luminosity to the bolo-metric luminosity, Lsmm/Lbol(Fig. 13). In assessing these
cor-relations, we should, of course, keep the large uncertainties – an order of magnitude – as well as systematic effects in mind. In particular, underestimating the density will immediately result in overestimating the abundance required to explain the obser-vations (cf. section 5.3). Likewise, if we underestimate the size of the emitting region, we will need a higher H2CO abundance.
Now, which of these, if any, correlations is the prime correla-tion and which one is derived is not directly clear. In particular,
2
within the inside-out-collapse, the density and inner radius are anti-correlated as are the luminosity and the radius of the evap-orated region.
The apparent anti-correlation between the H2CO
abun-dance and Lsmm/Lbol (Fig. 13) is of particular interest. The
latter is generally taken as an indicator of the evolutionary stage of the protostar where a larger value for Lsmm/Lbol
im-plies “youth” (e.g. large amounts of cold material surround-ing the YSO). The anti-correlation may seem a surprissurround-ing re-sult, as the most accepted scenario predicts that formaldehyde is formed on the grain surfaces, likely by successive hydro-genation of CO (Tielens & Hagen 1982; Charnley et al. 1997) during the pre-stellar phase. Once in the gas phase because of the evaporation of the grain mantles, formaldehyde is de-stroyed (i.e. converted into more complex molecules) on a timescale of ∼ 104 yr (Charnley et al. 1992). In this picture,
the youngest sources should have the largest Xin, which is
evi-dently not the case. This picture, however, might be somewhat over-simplified. Indeed, the process of ice evaporation is con-tinuous, involving larger and larger regions as the time passes and the luminosity of the protostar increases – as pointed out by the models by Ceccarelli et al. (1996) and Rodgers & Charnley (2003) – so that the result is a shell of continuously refurbished H2CO, moving outwards. The main point is that the region of
formaldehyde overabundance never disappears, but just moves, and the jump in the H2CO abundance is only governed by the
quantity of formaldehyde in the grain mantles.
If the Lsmm/Lbol ratio is not an age indicator but rather a
parameter affected more by the different initial conditions of each protostar, and specifically it is larger in sources where the pre-stellar density is larger (e.g. Jayawardhana et al. 2001), the trend of Fig. 13 would imply that the H2CO ice
abun-dance depends on the stellar conditions. Less dense pre-stellar conditions (i.e. lower Lsmm/Lbolratios) would give rise
to more H2CO enriched ices, because there is more atomic
H and thus more grain surface hydrogenation to form H2CO.
This is indeed consistent with the fact that the efficiency of CO hydrogenation into H2CO on the grain mantles is ∼ 250
times larger in H2O-rich ices when compared to CO-rich ices
(Ceccarelli et al. 2001). And since less dense regions have likely more H2O-rich than CO-rich ices, because CO-rich ices
likely form in relatively dense condensations (Bacmann et al. 2002), the larger H2CO abundance in sources with a lower
Lsmm/Lbol would therefore be due to a real larger efficiency of
the H2O-rich ices in forming H2CO. As a consequence, our
finding would suggest that the Lsmm/Lbolratio does not probe
the evolutionary status of protostars, but rather mainly reflects their different initial conditions.
Alternative explanations are also possible. For example, re-cent laboratory works suggest that the formation of formalde-hyde by CO hydrogenation on the grains depends on the dust temperature (Watanabe et al. 2003), and this may also be con-sistent with “older” protostars (i.e. lower Lsmm/Lbol ratios),
being also hotter, having larger H2CO abundances. This, of
course, would imply that the bulk of the H2CO is formed in
a stage later than the CO condensation, namely during the pre-stellar core phase (Bacmann et al. 2002). Whether this is likely is difficult to say, for CO may indeed be trapped on
the grain mantles and partly converted into H2CO only when
the grain temperature increases, as suggested by the labora-tory experiments. Another possibility is that formaldehyde for-mation on grains needs UV radiation (e.g d’Hendecourt et al. 1986; Schutte et al. 1996). Analogously to above, formalde-hyde would be formed only in a later stage, and the older the protostar, the larger the UV field and the larger the H2CO
abun-dance.
All these interpretations need to be taken with caution, of course, since the inferred variations in the inner H2CO
abun-dance might reflect uncertainties in the density and/or size of the region emitting the H2CO lines. A similar study on a larger
sample and focussing on higher energy lines is required to draw more definitive conclusions.
6.2. Low versus high mass protostars
In section 5 we have examined the evidence for the presence of jumps in the H2CO abundance in the warm gas
surround-ing low mass YSOs. The presence of such abundance jumps in hot cores around high mass stars is not well established. On the one hand, the prototype of hot cores in regions of massive star formation – the hot core in the Orion BN/KL region – has a H2CO abundance of 10−7(Sutton et al. 1995). On the other
hand, in a study of hot cores in a sample of massive protostars, van der Tak et al. (2000) did not find evidence for the presence of H2CO abundance jumps, but did find evidence for jumps
in the CH3OH abundance. It is unclear at present whether the
Orion hot core or the van der Tak sample is more representa-tive for the composition of hot cores in regions of massive star formation. Presuming that the differences in H2CO abundance
jumps are real, we note that the composition of the ices – which drive the chemistry in hot cores – may well differ between re-gions of low mass and high mass star formation.
Supporting this idea, the deuterium fractionation is dra-matically different in the high and low mass protostars. Doubly deuterated formaldehyde and methanol have been ob-served to be extremely abundant in low mass protostars when compared to massive protostars. The D2CO/H2CO ratio is
more than 25 times larger in low than in high mass proto-stars (Ceccarelli et al. 1998; Loinard et al. 2002a). Deuterated methanol may be as abundant than its main isotopomer in the low mass protostar IRAS16293-2422 (Parise et al. 2002), whereas it is only 4% of CH3OH in Orion (Jacq et al. 1993).
Since this extreme deuteration is likely a grain mantle prod-uct (e.g. Ceccarelli et al. 2001; Parise et al. 2002), the dramatic differences in the molecular deuteration between low and high mass protostars are already a very strong indication that man-tles in both type of sources are substantially different. This in-deed does not comes as a surprise, as the pre-collapse condi-tions very likely differ: warmer in high than in low mass stars, at the very least.
6.3.
X
outversus CO abundanceFinally, Fig. 14 compares the H2CO abundance Xout with the
Fig. 14. Derived outer formaldehyde abundance Xoutas a
func-tion the CO abundance of the outer enveloppe. Circles rep-resent Class 0 sources, The star reprep-resents IRAS16293-2422, the square represents VLA1623, and the triangles represent the pre-stellar cores of Bacmann et al. (2002, 2003) sample.
envelope. On the same plot we also reported the values found in the prestellar cores studied by Bacmann et al. (2002, 2003). The first thing to notice is the similarity of the values found in Class 0 sources and pre-stellar cores, in both molecules, despite the different methods used to derive the abundances. The similarity of the values adds support to the thesis that the stellar cores of the Bacmann et al. sample are pre-cursors of Class 0 sources, and that the outer regions of the envelopes of Class 0 sources are formed by material still un-changed by the collapse, i.e. that reflects the pre-collapse con-ditions. Second aspect to note of Fig. 14 is the clear correlation between the H2CO and CO abundance. In this case the
interpre-tation is straightforward: in the outer, cold envelope molecules are depleted, and the degree of depletion is the same for the CO and the H2CO molecules. As discussed in Bacmann et al.
(2002), the limited CO depletion observed in pre-stellar cores strongly suggests that a relatively efficient mechanism (cos-mic rays?) re-injects CO into the gas phase. Since the bind-ing energies of the CO and H2CO are relatively different (e.g.
Aikawa et al. 1997), the linear correlation of Fig. 14 strength-ens the claim that H2CO molecules are trapped into CO-rich
ices (Ceccarelli et al. 2001).
7. Conclusions
We have presented a spectral survey of the formaldehyde emis-sion of a sample of eight Class 0 protostars, carried out with the IRAM 30m and JCMT telescopes. A total of eight transitions were selected for each source, covering a large range of upper level energies in order to probe different physical conditions. When possible, the isotopic lines were observed in order to de-rive the line opacities. Most of the lines are relatively narrow with a small contribution from wings extending to larger ve-locities. Using the standard rotational diagram method, we
de-rived rotational temperatures between 11 and 40 K, and H2CO
column densities between 1 × 10¹³
and 7 × 1013 cm−2. For the sources with detected H132 CO lines, opacity corrections in-crease the derived column densities to the range 0.8 and 2 ×1014 cm−2. In order to test the effect of non-LTE excitation, the observed emission has been modeled using a LVG code. In this way the derived temperatures are significantly higher than the rotational temperatures, suggesting that the observed transitions are sub-thermally populated. The inferred densities, between 1 and 6 × 105cm−3, indeed support this conclusion.
To take into account the density and temperature gradients in the protostellar envelopes, the emission has been modeled using densities and dust temperature profiles derived from pre-vious studies of the continuum emission of these objects. The gas temperature in the envelopes was computed using a code of the thermal balance for protostellar envelopes. The formalde-hyde abundance across the envelope has been approximated by a step function : an outer abundance Xoutwhere Tdust≤ 100 K,
and a inner abundance Xinat Tdust ≥ 100 K. We show that the
outer abundance, Xout , is well constrained in all the sources,
and varies between 8 × 10⁻¹¹and 8 × 10⁻¹⁰. The inner abun-dance Xin is well constrained in four sources with a 3 σ level
confidence, while in three sources it is only a ≤ 2 σ evidence, and no evidence of a jump is found in VLA1623. The derived values of Xinrange between 1 × 10⁻⁸and 6 × 10⁻⁶, showing
jumps of the formaldehyde abundance between 2 and 4 orders of magnitude. The most important conclusion of this study is
hence that large amounts of formaldehyde are injected into the gas phase when the grain mantles evaporate at 100 K.
We have discussed the uncertainties on the actual values of the hidden parameters of the model, namely the velocity and density profile, the H2CO ortho to para ratio, and the
evapora-tion temperature. The uncertainty in these parameters makes the abundance jump value and jump locations uncertain for some sources. Future observations of higher frequency lines and modeling of the line profiles may distinguish between the different interpretations.
We found that sources with lower Lsmm/Lbol ratios
pos-sess the largest inner H2CO abundances. We discussed why we
think that this reflects very likely a different H2CO enrichment
of the grain mantles.
We found that the inner H2CO abundances are
systemat-ically larger than the H2CO abundances of the hot cores of
the sample of massive protostars studied by van der Tak et al. (2000). This supports to the idea that low and high mass proto-stars have a different grain mantle composition.
Finally, the derived outer H2CO abundance shows a
clear correlation with the CO abundance, implying that both molecules are depleted by a similar factor in the outer envelope, namely that H2CO molecules are likely trapped in CO-rich ices
in the outer envelope.
Acknowledgements. Most of the computations presented in this
pa-per were pa-performed at the Service Commun de Calcul Intensif de l’Observatoire de Grenoble (SCCI). Astrochemistry in Leiden is sup-ported by a NOVA Network 2 PhD grant and by a NWO Spinoza grant.