EFFET DU CHARGEMENT SUR LA PRÉCISION D’UNE MACHINE-OUTILS CINQ AXES
PIERRE-FRANÇOIS PINARD
DÉPARTEMENT DE GÉNIE MÉCANIQUE ÉCOLE POLYTECHNIQUE DE MONTRÉAL
MÉMOIRE PRÉSENTÉ EN VUE DE L’OBTENTION DU DIPLÔME DE MAÎTRISE ÈS SCIENCES APPLIQUÉES
(GÉNIE MÉCANIQUE) AVRIL 2017
ÉCOLE POLYTECHNIQUE DE MONTRÉAL
Ce mémoire intitulé :
EFFET DU CHARGEMENT SUR LA PRÉCISION D’UNE MACHINE-OUTILS CINQ AXES
présenté par : PINARD Pierre-François
en vue de l’obtention du diplôme de : Maîtrise ès sciences appliquées a été dûment accepté par le jury d’examen constitué de :
M. BALAZINSKI Marek, Docteur ès sciences, président M. MAYER René, Ph. D., membre et directeur de recherche M. ACHICHE Sofiane, Ph. D., membre
DÉDICACE
REMERCIEMENTS
Je souhaiterais remercier mon directeur de recherche M. René Mayer pour son aide et sa supervision dans ce projet, Guy Gironne et Vincent Mayer pour les tests expérimentaux et toutes les personnes qui m’ont aidé directement ou indirectement lors de ce travail.
RÉSUMÉ
Ce projet de recherche porte sur l’étude d’une potentielle relation entre le chargement dû au poids de la pièce et les erreurs volumétriques sur une machine-outil 5-axes à table verticale. Il prend le relais de l’étude de B. Asadishad [1] dans lequel le lien entre le chargement et les erreurs paramétriques fut étudié. Ici, l’étude des performances de la machine en termes de précision et de répétabilité des erreurs volumétriques sous charge sera privilégiée. Les charges appliquées dans l’étude précédente sont reprises mais le protocole de test et de mesures a été adapté. Ainsi, les tests développés pour la présente étude se servent de blocs (acier) simulant une force, des entretoises légères (aluminium) couplés aux blocs simulant un moment et des sphères montées sur des tiges de 280 mm de hauteur. Un protocole de test a ensuite été mis au point spécifiant les indexations des axes rotatifs B et C de la machine-outil et leur ordre, le nombre de blocs et d’entretoises ainsi que leur position sur la table et le nombre de sphères palpées. Ensuite, la machine comportant une zone de travail et une zone de chargement, un test de répétabilité a été effectué pour quantifier la précision de placement de la table après être passée dans la zone de chargement. La hauteur des tiges pouvant engendrer des erreurs de mesure en raison de déflexion sous leur propre poids et sous l’effet de la force du palpeur un test nommé « 0 » sera utilisé comme référence afin d’annuler les erreurs dues à la déflexion de la tige lors des palpages. Une série de 16 tests a été effectuée avec 16 chargements différents, chaque test a demandé 2 heures de temps à la machine et à l’opérateur pour être réalisé. A l’issu de ces tests, les données brutes sont analysées. D’autre part, les forces et moments engendrés par les poids, les erreurs volumétriques, les déviations linéaires et angulaire de chaque plan de palpage par rapport au plan de référence ainsi que la matrice des p-values de l’ensemble des données sont calculés. Certains comportements redondants ont pu être observés dans lesquels des conclusions ont pu être tirées par rapport à la précision de la machine en fonction du chargement et de la position de la table de la machine dans l’espace de travail. Enfin, cette étude s’est focalisée sur les erreurs volumétriques engendrées par un chargement sans prendre en compte les nombreuses autres sources d’erreurs comme la thermique et la dynamique. Il serait alors intéressant de coupler cette étude sur les effets du chargement avec des études plus générales portant sur les sujets cités précédemment.
Au terme de cette étude, il a été possible de mettre en avant l’existence de corrélations significatives entre le chargement et les erreurs mesurées et calculés. Le lien entre la charge et les erreurs volumétriques apparait comme le plus fort. De plus, il existe une corrélation entre la position de la
table, l’indexation et les erreurs observées. Néanmoins, cette étude ne permet pas l’identification précise de la provenance de ces erreurs.
Ce travail a donc contribué à démontrer qu’un chargement compris dans les limitations de la machine a une influence non négligeable sur sa précision.
ABSTRACT
This thesis presents a study of a possible relation between the load from the weight of the workpiece put on the table and volumetric errors. This work is the continuity of the study conducted by B. Asadishad [1] in which the link between the load and the error parameters was studied. Here, the study of machine performances regarding the precision and the repeatability of volumetric errors under load will be considered. The loading system used is the same as in the previous study but the test protocol and measurement protocol are adapted for the current study. The new test protocol developed uses heavy blocs of steel to simulate weight, light spacers paired with heavy blocs to simulate torque and spheres mounted on top of 280 mm rods. Then new test protocol specifies the indexation pairs of the B- and C-axis of the machine and their order of execution, the number of blocs and spacers and their position on the table, the number of spheres probed and the order in which tests have been conducted during a day of testing. Moreover and because the machine presents a loading area and a working area a repeatability test was done to quantify the repeatability of repositioning the table after traveling to and from the loading area. Because the height of rods could create errors of measurement because of deflexion under their own weight and under the force of the probe during the tests a test called « test 0 » is used as a reference to remove this effect form the loaded tests. A set of 16 tests is conducted with 16 different loading system. Each test lasts for 2 hours. From these tests raw data are analyzed. Then weight and torques produced by blocs, volumetric errors and the the rigid body motion of the table are compared to the reference plane and the p-values matrix are calculated. Significant correlation have been detected between the load (forces and torques), volumetric errors and the the rigid body motion of the table. More specifically, forces in Y directions and torques around X and Z axis are strongly correlated. Thus, table position, indexations, volumetric errors and the the rigid body motion of the table, show significant correlations. Nevertheless, this method does not make possible the identification of error sources.
TABLE DES MATIÈRES
DÉDICACE ... III REMERCIEMENTS ... IV RÉSUMÉ ... V ABSTRACT ... VII TABLE DES MATIÈRES ... VIII LISTE DES TABLEAUX ... X LISTE DES FIGURES ... XI LISTE DES SIGLES ET ABRÉVIATIONS ... XII LISTE DES ANNEXES ... XIII
CHAPITRE 1 INTRODUCTION ... 1
1.1 Problématique ... 2
1.2 Question de recherche ... 2
1.3 Objectifs ... 2
CHAPITRE 2 REVUE CRITIQUE DE LITTÉRATURE ... 4
CHAPITRE 3 DÉMARCHE DE L’ENSEMBLE DU TRAVAIL DE RECHERCHE ET ORGANISATION GÉNÉRALE DU DOCUMENT INDIQUANT LA COHÉRENCE DES ARTICLES PAR RAPPORT AUX OBJECTIFS DE LA RECHERCHE ... 7
3.1 Mise au point d’un protocole de test ... 7
3.2 L’acquisition des données de test ... 7
3.3 Le calcul de données additionnelles ... 8
3.4 L’analyse des données ... 8
CHAPITRE 4 ARTICLE 1: EFFECT OF LOAD ON MACHINE TOOL PRECISION ... 9
4.1 Introduction ... 9
4.3 Test Strategy ... 11
4.4 Repeatability Test ... 17
4.5 Loading system ... 18
4.6 Data acquisition ... 21
4.7 Experimental and additional data ... 24
4.7.1 Experimental data ... 24
4.7.2 Additional data ... 24
4.8 Data analysis ... 29
4.8.1 Correlations analysis ... 30
4.8.2 The influence of the indexations ... 34
4.9 Conclusion ... 36
4.10 Acknowledgments ... 37
CHAPITRE 5 DISCUSSION GÉNÉRALE ... 38
CHAPITRE 6 CONCLUSION ET RECOMMANDATIONS ... 41
BIBLIOGRAPHIE ... 43
LISTE DES TABLEAUX
Table 4.1 : Tests groups and configurations (Part 1) ... 13
Table 4.2 : Tests groups and configurations (Part 2) ... 14
Table 4.3 : Test protocol – loads ... 15
Table 4.4 : Test protocol – B- and C-axis indexation ... 16
Table 4.5 : Repeatability of the table removal and remounting process with no load (mm) ... 18
Table 4.6 : Spheres deviations (sample) ... 23
Table 4.7 : Table setting, forces and torques in the R1 system for B=C=0°. ... 25
Table 4.8 : Rigid body motion of the table reference balls for tests 0, 1 and 2 for B=0° and C=0° ... 28
Table 4.9 : Apparent rigid body motion volumetric residues (apparent distortion of the relative position of the table reference balls) for tests 0, 1 and 2 for B=0° and C=0° ... 29
Table 4.10 : Correlation summary between some volumetric errors and the load (sample) ... 30
Table 4.11 : Correlation summary (apparent rigid body motion of the table and load) (sample) .. 33
Table 4.12 : Correlation summary for test 7 (Rigid body motion of the table and table position) 36 Table 4.13 : Correlation summary for test 7 (volumetric errors and table position) ... 36
LISTE DES FIGURES
Figure 4.1 : Kinematic chain of the five-axis machine tool studied [1] ... 11
Figure 4.2 : Spheres mounted on blocs of the loading system in [1] ... 12
Figure 4.3 : Loading positions and spheres positions ... 16
Figure 4.4 : Test Protocol – B- and C-axis indexations throughout one test ... 17
Figure 4.5 : Repeatability diagram ... 18
Figure 4.6 : Bloc (left) and spacer (right) ... 19
Figure 4.7 : Drawing of the bloc with nominal dimensions ... 19
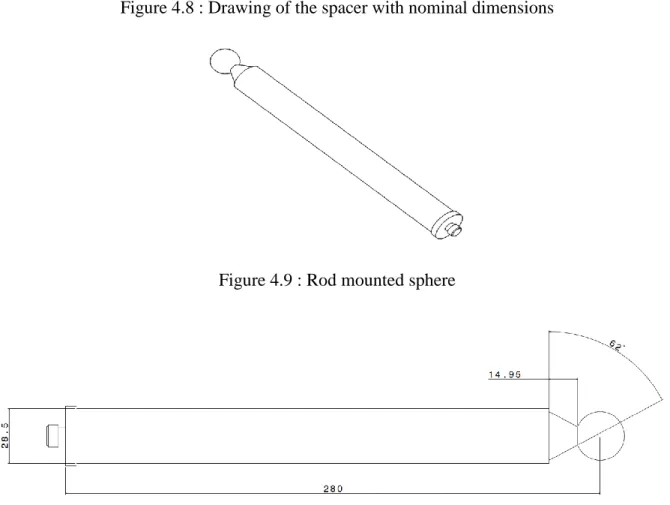
Figure 4.8 : Drawing of the spacer with nominal dimensions ... 20
Figure 4.9 : Rod mounted sphere ... 20
Figure 4.10 : Drawing of the rod mounted reference spheres with nominal dimensions ... 20
Figure 4.11 : Data acquisition during test 4 ... 22
Figure 4.12 : R1 system when the machine axis positions are x=b=c=0. The frame does not move with the table translation in X or rotation around B or C. ... 23
Figure 4.13 : R2 system definition ... 24
Figure 4.14 : Forces and torques in the R1 reference frame ... 26
Figure 4.15 : Volumetric errors (Δy3, Δy4, Δz3) versus Fy, for tests 3 to 7, for B=30° and C=0° ... 31
Figure 4.16 : Δy4 versus Fy, with linear regression, for tests 3 to 7 and indexations (0°; 30°; 0°), (0°;30°;45°), (0°;30°;90°), (0°;60°;135°) ... 32
Figure 4.17 : Load effect on the rigid body motion of the table ... 33
Figure 4.18 : δ versus X3, for test 7, influence of the table position on the rigid body motion of the table; tot is the total linear rigid body motion ... 34
Figure 4.19 : Angular deviation versus X3, influence of the table position on the table angular deviation ... 35
LISTE DES SIGLES ET ABRÉVIATIONS
CNC Computer numeric control ELS Electronic Lead Screw Fx Force selon l’axe X
Fy,1 Force selon l’axe Y dans les conditions d’indexation numéro 1 LDBB Loaded Double Ball Bar
p-value La valeur p
Rep_X Répétabilité de l’axe X Mall Matrices des données
Mx Moment selon l’axe X
α Déviation angulaire du plan de la table selon l’axe X β Déviation angulaire du plan de la table selon l’axe Y δtot Déviation linéaire totale
δx Déviation linéaire selon l’axe X
γ Déviation angulaire du plan de la table selon l’axe Z θtot Déviation angulaire totale
Δx Erreur volumétrique selon l’axe X
Δy4,1 Variation de mesures de la sphere numéro 4 sous les conditions d’indexation numéro 1 par rapport à la mesure de la sphère numéro 4 au test 0
LISTE DES ANNEXES
Annexe A – Mesures du test de répétabilité ... 46 Annexe B – Programme matlab de calcul de coefficient de correlation et p-values ... 47 Annexe C – Programme de traitement des fichiers de plapage ... 48 Annexe D – Programme de generation des deviation lineaires et angulaire des plans de la table. 51 Annexe E – Programme de calcul des forces et moments engendrées par le chargement ... 52
CHAPITRE 1
INTRODUCTION
De nombreux domaines de l’industrie utilisent des machines-outils 5 axes à commande numériques afin d’assurer l’usinage de pièces complexes. Ces machines présentent l’avantage économique majeur de pouvoir usiner différentes formes complexes en une seule prise de pièce, réduisant de manière significative le temps d’usinage.
Ces machines sont composées de trois axes linéaires et deux axes rotatifs augmentant le nombre de sources d’erreurs de différents types et pouvant réduire la précision de la machine. Néanmoins, la précision de ces machines, bien supérieure aux plus petites cotations géométriques demandées pour les bureaux d’étude, est adaptée aux industries.
Les sources d’erreurs sont multiples car les machines sont soumises à différentes contraintes tout au long de leurs phases de fonctionnement et d’arrêt. Les variations dimensionnelles des composants de la machine dues aux variations thermiques peuvent engendrer des erreurs tout comme les effets dynamiques et les vibrations. Lors d’un usinage, les efforts de coupe sont importants et sont également une source d’erreur.
Enfin, le brut fixé sur la table de la machine peut présenter une masse allant jusqu’à plusieurs dizaines de kilogrammes. Cette masse présente un chargement qui peut alors avoir une influence sur les performances de la machine. De nombreuses études se sont intéressées aux erreurs liées aux phénomènes thermiques et dynamiques ainsi qu’à l’effet des efforts de coupe mais seulement très peu ont cherché à comprendre le comportement d’une telle machine sous l’effet d’un chargement. En raison d’une volonté toujours présente de la part des industriels de produire des pièces de qualité supérieure, l’étude des effets d’un chargement sur la précision d’une machine-outil apparait comme nécessaire.
Nous allons ainsi chercher à déterminer si un chargement compris dans les limites des spécifications d’une machine 5-axes a une influence significative sur sa précision. Pour ce faire, une analyse statistique de la relation entre erreurs volumétriques, déviation du plan de la table, position de la table dans l’espace de travail et le chargement sera faite.
Il existe deux types d’erreur en relation avec la conception et la fabrication d’une machine outils, les erreurs géométriques et les erreurs volumétriques. Les erreurs géométriques quantifient les défauts de la structure et des composants de la machine alors que les erreurs volumétriques
représentent les erreurs de mouvement relatif entre l’outil et la pièce [2]. Une étude a été menée par B.Asadishad [1] sur les erreurs paramétriques sous charge. Elle a déterminé qu’il existait un lien entre ces erreurs et le chargement. Cet article suggère de poursuivre l’étude aux erreurs volumétriques, ce que nous nous proposons de faire.
1.1 Problématique
Comme énoncé précédemment, il n’existe que très peu d’études dans la littérature reliant précisément l’effet d’un chargement aux erreurs volumétriques engendrées pour une machine 5 axes à table verticale. Cette étude s’avère nécessaire car la précision des pièces fabriquées par cette même machine est alors en jeux. Une pièce usinée ne respectant pas les cotations imposées par le bureau d’étude est une perte pour une entreprise. Ainsi, s’il devient possible d’anticiper la réaction de la machine au chargement qui lui est imposé, les probabilités d’obtenir des pièces ne respectant pas les cotations diminueront.
1.2 Question de recherche
Pour une machine 5 axes à table verticale, un chargement compris dans les limites de fonctionnement de la machine est-t-il un facteur influençant la précision de positionnement de la broche par rapport à la pièce ?
1.3 Objectifs
L’objectif principal de cette étude est :
Quantifier l’effet d’un chargement sur les erreurs volumétriques pour une machine 5 axes à table verticale.
Les quatre sous objectifs de cette étude sont les suivants :
1. Proposer une méthodologie permettant de mettre en lumière les erreurs volumétriques dues au chargement
2. Déterminer s’il existe des erreurs volumétriques significatives engendrées par le chargement placé sur la table de la machine.
3. Déterminer s’il existe des corrélations significatives entre le chargement, les erreurs mesurées et la position de la table dans l’espace de travail.
4. Déterminer les composantes des forces et moments responsable des erreurs mesurées et discuter de leur cohérence par rapport à la géométrie de la machine.
CHAPITRE 2
REVUE CRITIQUE DE LITTÉRATURE
Ce projet de recherche se focalise sur l’existence de corrélations entre les erreurs volumétriques mesurées et le chargement imposé à la machine, tout en restant dans les limites de masse imposées par le constructeur (100 kg). Ce travail s’inscrit alors dans le très large domaine de la précision des machines, leurs performances et l’éventuelle compensation de leurs erreurs de tout type. D.Dornfield a regroupé dans son livre sur la fabrication de précision certain aspect requis pour une machine pour fabriquer des pièces de haute précision [3]. On y retrouve des critères de rigidité des axes, de précision de guidage mais aussi une analyse de la structure d’une machine témoignant des sources probables d’erreurs. Il s’agit ici des erreurs géométriques qui sont causées par les défauts de la structure et des composants de la machine. Ces erreurs sont à différencier des erreurs volumétriques qui elles, correspondent aux erreurs de mouvement relatifs entre l’outil et la pièce [2]. Les sources et la description des erreurs géométriques dans une machine sont présentées dans [4] . On y retrouve les erreurs dues à la chaine cinématique des axes, à la thermique changeante de la machine, à la dynamique et enfin les erreurs dues au chargement sont introduites. De plus, différentes méthodes de mesures d’erreurs sont présentées comme la mesure des erreurs de position, de rectitude ou encore la précision des axes rotatifs.
D’autre part, l’étude des sources et la quantification des erreurs volumétriques sont étudiées dans [5] à travers l’utilisation d’une « double ball bar ». Il s’agit d’un outil ayant une extrémité fixée sur la table de la machine et une autre sur la broche. Il permet ainsi de mesurer les variations de position entre la table et la broche ou encore entre la pièce et l’outil, qui est le cas qui nous intéresse. Une autre méthode par mesure laser est également appropriée pour l’étude des erreurs volumétriques sur une machine 5 axes [6]. Le tracker laser étant une méthode de haute précision, elle permet de mesurer non seulement les erreurs volumétriques mais aussi les erreurs géométriques, ce qui rend ce procédé intéressant d’un point de vu temps.
D’autres erreurs peuvent également affecter la précision de la machine telles que les erreurs thermiques étudiées dans [7] ou celles dues à la dynamique des axes [8].
En ce qui concerne les erreurs dues au chargement de la machine, il est possible d’envisager cet aspect de deux manières distinctes. La première est de comprendre le chargement comme l’effort transmis à la pièce usinées (et donc à la table) par l’outil lors d’une opérations d’usinage. Les
erreurs dues aux efforts de coupe sont étudiées dans [9] et témoignent de valeurs d’efforts considérables à ne pas négliger. Ensuite, les erreurs dues aux déformations de l’outil sont également envisagées dans [10] et leur analyse pourrait permettre une amélioration sensible de la précision d’usinage dépendamment de l’outil en lui-même et du procédé de fabrication adopté. La seconde est plus simplement de considérer la masse du brut à usiner comme un chargement. En effet, dépendamment des machines, un brut peut présenter une masse allant jusqu’à plusieurs centaines de kilogrammes, il semble alors intéressant d’envisager l’influence de cette masse sur la précision de la machine. Seulement quelques travaux ont été publié à ce sujet comme le travail de A. Archenti [11] sur l’évaluation de la précision des machines sous l’effet d’un chargement simulé par un dispositif nommé « loaded double ball bar » (LDBB). De plus, Archenti a développé un concept nommé « ELS » (elastically linked system) [12], permettant de lier la précision statique de la machine avec les erreurs géométriques des pièces usinée et ce en utilisant le dispositif nommé « LDBB ». Néanmoins, ces méthodes ne se sont pas focalisées sur les erreurs volumétriques. Enfin, une étude de l’influence directe du chargement sur les erreurs paramétriques d’une machine 5 axes a été faite utilisant des poids comme chargement et le palpage de sphères positionnées sur ce chargement comme mesures [1]. Des liens entre les valeurs des efforts et les erreurs mesurées ont pu être mis en évidence.
La machine utilisée pour ce projet est une machine 5 axes à table verticale reposant sur les axes B, C et X. Il semble alors intéressant de s’intéresser au comportement des axes d’une machine lorsqu’ils sont soumis à un chargement. Dans [13], la corrélation entre les déformations élastiques de la structure de la machine et les déviations géométriques sont mise en avant et peuvent avoir un impact sur la précision dimensionnelle des pièces usinées. Une étude [14] a également été menée afin de développer une méthode permettant de mesurer les déplacements élastiques des systèmes de support de la machine sous l’effet des efforts de coupe. Enfin, l’influence des erreurs géométriques sur les axes linéaires et donc sur les erreurs cinématiques observée est proposée dans [15]
Par la suite, l’identification des erreurs et leur mesure mènent à une éventuelle compensation et/ou à une calibration de la machine. La théorie pour la compensation des erreurs sur les machine-outil est présentée dans [16] ainsi qu’une méthode faisant appel à des modèles mathématiques pour compenser les erreurs mesurées. De façon plus spécifique, la compensation et la réduction des erreurs de type thermique sont rassemblés dans un document [7] proposant différentes façons de
réduire ces erreurs. Concernant la compensation des erreurs d’axes, le travail de Mchichi, N. A. [17] introduit la méthode SAMBA. Cette méthode permet l’estimation des erreurs de positionnement des axes ainsi que des erreurs paramétriques en vue de la calibration de la machine. D’autre part, seulement peu de travaux ont été menés sur la prédiction des erreurs volumétriques. Rahman, M. a étudié les erreur paramétriques inter-axe et intra-axe par palpage de surfaces [18] afin de prédire les erreurs volumétriques de la machine [19]. La prédiction des erreurs d’une machine est un domaine encore peu exploré mais qui, avec des études comme celle-ci sur le comportement sous charge pourra être enrichi.
En vue des études menées dans le domaine des erreurs machine présentées ci-dessus, nous pouvons remarquer que la majorité de ces travaux ont été réalisés sans chargement. Des méthodes de compensation et de calibrations sont mise en avant permettant d’améliorer la précision des machines. Néanmoins, d’autres études ont pu montrer qu’un chargement pouvait engendrer des déformations élastiques de certains composants de la machine affectant ainsi sa précision. L’étude qui va suivre va alors se pencher sur la question de l’influence du chargement sur les erreurs volumétriques afin de mettre en avant ou non une corrélation entre ces deux facteurs. Ce travail pourra alors mener à d’autres études sur la modélisation de ces liens dans le but, éventuellement, de compenser les erreurs de la machine en fonction de son chargement et ainsi augmenter sa précision.
CHAPITRE 3 DÉMARCHE DE L’ENSEMBLE DU TRAVAIL DE
RECHERCHE ET ORGANISATION GÉNÉRALE DU DOCUMENT
INDIQUANT LA COHÉRENCE DES ARTICLES PAR RAPPORT AUX
OBJECTIFS DE LA RECHERCHE
Ce travail a pour but principal de comprendre le comportement d’une machine 5 axes à table verticale sous l’effet d’un chargement, et de déterminer l’existence de liens entre le chargement de la table de la machine et les erreurs volumétriques. Ainsi, la démarche adoptée se décompose en les 4 étapes suivantes :
Mise au point d’un protocole de test
L’acquisition des données de test
Le calcul de données additionnelles
L’analyse des données
3.1 Mise au point d’un protocole de test
La mise au point du protocole définit la quantité et la qualité des données sur lesquelles se basera cette étude. La réflexion s’est essentiellement portée sur la disposition et le nombre des chargements ainsi que les indexations de palpage. Ce protocole a néanmoins été limité par certains facteurs comme les capacités de la machine. Le constructeur affiche une masse maximale de 100kg sur la table et une hauteur de chargement maximale de 300mm. Une fois ce protocole validé, une première série de tests a été effectué que l’on a appelé tests de répétabilité. En effet, entre chaque chargement différent, la table est déplacée dans l’espace de chargement puis redirigée vers l’espace de travail. Il a donc fallu quantifier la précision de positionnement de la table après chaque opération de ce type.
3.2 L’acquisition des données de test
Les tests en charge selon le protocole développé précédemment ont pu être effectués et des mesures de position ont été enregistrées. Il s’agit des seules données expérimentales qui seront utilisées. Chaque test a duré deux heures. Les données brutes se présentent sous forme d’un fichier texte
(.txt) indiquant l’indexation de palpage, le numéro de sphère palpée et les coordonnées X, Y et Z de cette dernière.
3.3 Le calcul de données additionnelles
Ce travail portant sur une potentielle influence du chargement sur la précision de la machine il semblait nécessaire de quantifier ce chargement par des forces et des moments. De ce fait, Les forces et moments engendrés par les différents chargements ont été calculés dans le repère de la table nommé R1 et défini sur la Figure 4.12. Les déviations linéaires et angulaires des plans formés par les sphères palpées ont été générées par le biais d’un produit vectoriel faisant appel aux erreurs volumétriques et aux coordonnées brutes des sphères palpées. L’idée est de diminuer le nombre de variables.
3.4 L’analyse des données
Le but ici est de démontrer l’existence d’erreurs volumétriques significatives pour une machine 5 axes ainsi que l’existence de liens entre les données acquises lors des tests et les données calculées. Dans un premier temps, l’analyse des erreurs volumétriques va permettre de discuter l’influence directe du chargement sur la position relative de la pièce par rapport à la broche de la machine. Par la suite, un test de p-value a été utilisé afin de déterminer les corrélations significatives qui existent entre certaines séries de données. Ensuite, la recherche de corrélations s’est divisée en deux stratégies. La première va fixer l’indexation et se focaliser sur les effets des forces et des moments tandis que la seconde fera l’inverse et fixera le chargement pour s’intéresser plus particulièrement aux effets de l’indexation et de la position de la table dans l’espace de travail.
Ce document s’articule autour de ces quatre étapes dans le but de démontrer l’existence de l’influence d’un chargement compris dans les limites de la machine sur sa précision. L’essentiel du travail de recherche sera présenté dans le corps d’un article scientifique qui commencera par la définition géométrique de la machine sur laquelle les tests ont été effectués pour continuer avec l’ensemble des points présentés précédemment.
CHAPITRE 4
ARTICLE 1: EFFECT OF LOAD ON MACHINE TOOL
PRECISION
Soumis à : The Internationnal Journal of Advanced Manufacturing Technology Date : 17/03/2017
Auteurs : Pierre-François PINARD et René MAYER
Machine parts accuracy depends on multiple factors such as workpiece material, tool selection and cutting parameters but also the precision of the machine tool itself. This paper focuses on the machine volumetric error caused by the workpiece weight. Tests are conducted on a five-axis machine tool with a vertical table. Different loading systems are mounted on the table along with four spheres. The X, Y and Z coordinate of the spheres are measured by on-machine probing. An unloaded “test zero” is used as a reference to eliminate a number of systematic errors not related to the sought effects. Sixteen different loading systems are studied, all within the machine specified limits. Then, nineteen different rotary indexations pairs form the test protocol. Data is analysed using correlations coefficient and p-value test in order to find probable link between the load and the volumetric errors and to quantify the machine performance. Three types of errors are considered: the total volumetric errors, the apparent rigid body motion of the table and the change in the on-machine measured relative position of the balls. It is observed that significant volumetric errors, up to 30 µm, occur during the tests under load. Stiffness in the region of 25 N/m were derived from the data. Furthermore, it has been possible to demonstrate the existence of significant correlations between the volumetric errors, the apparent rigid body motion of the table, the axis positions and the load. In particular, and as expected, the deviations, both in linear and angular terms, and the associated correlations are consistent with the anticipated effect of the added weight.
4.1 Introduction
The precision of machined parts depends on multiple factors such as the tool quality, the cutting parameters, the workpiece material and the machine tool. Among those factors the machine tool precision plays a key role in the dimensional quality of the part. Precision is affected by quasi-static errors and dynamic errors [3]. Focussing on quasi-quasi-static errors, there are several error
contributors such as geometric construction, wear, thermal variations, mechanical hysteresis and elastic effects. One key performance indicator for a CNC machine tool is the level of precision it is able to maintain under various workpiece loads.
Machine precision is generally tested under no-load conditions although a compliance test is proposed in [20] on an axis-by-axis basis so that five tests are conducted for a five axis machine tool.
Errors in machine tools originate from the structure of the machine and from the use of the machine and its environment.
There are two categories of errors, geometric errors and the resulting volumetric errors. The first represents errors coming from the structure and the component of the machine while the second are a result of the first category and are the errors of relative movement between the spindle and the table [2]. Much work has been done on geometric errors, their description are presented in [4]. The effect of forces applied to the tool and workpiece have been studied. The load as a result of the force created by the tool on the workpiece during the machining was studied in [9] and testifies of significant errors. Errors due to the tool deflection is considered in [10]. A. Archenti ([11] and [12]) developped a specific equipment called a « loaded double ball bar », which is a double ball bar integrating a system simulating a load. It enabled the study of the volumetric errors under directional load. This concept is called ELS for « Elastic Linked System ».
The influence of the load on the parametric error has been studied in [1] using masses put on the machine table and spheres mounted on the load stack used for the measurements. Tests conducted for this project have been carried out on a 5-axis machine tool with a vertical table. The table is mounted on the C-, B- and X-axis. The correlation between the elastic deformations of the structure and the geometrical deviations observed were studied in [13]. A method [14] has also been developed to measure the elastic deviation of the supporting system of the machine under the cutting forces. Finally the influence of geometric errors on the kinematic chain was investigated in [15].
This study will investigate the existence of significant volumetric errors and significant correlations between volumetric errors and the load put on the machine table. It could lead to further studies on the quantification of these correlations and the development of a model capable to predict volumetric errors according to the load and then improve the machine accuracy.
4.2 Machine definition
The test presented in this paper has been conducted on a five-axis machine tool with a vertical table. The kinematic chain of the machine is presented in Figure 4.1. A, B and C represent the rotary axes and, X, Y and Z are the linear axis of the machine. The table moves trough the X-, B- and C-axis and the spindle is in motion trough the Y- and Z-axis. The spindle is not actuated and will hold by a probe instead of a cutting tool.
Figure 4.1 : Kinematic chain of the five-axis machine tool studied [1]
4.3 Test Strategy
The aim of the test strategy (loading sequence, measurement points and rotary axes indexation) is to produce conditions that are typical of what may occur during normal operations. In [1] a loading system was proposed consisting in heavy solid steel blocks of 8,168 kg and light hollow spacers of 0,677 kg, which allow similar total weights to produce different loading moments. The reference
spheres were either mounted on the load stack or directly on the table as shown in Figure 4.2. For the spheres attached to the load stacks, their position could be affected by the stack deflection itself. This hypothesis has been studied in [1] and results showed that the loading stacks deflect slightly under their own weight and affect the position of the spheres mounted on them.
Figure 4.2 : Spheres mounted on blocs of the loading system in [1]
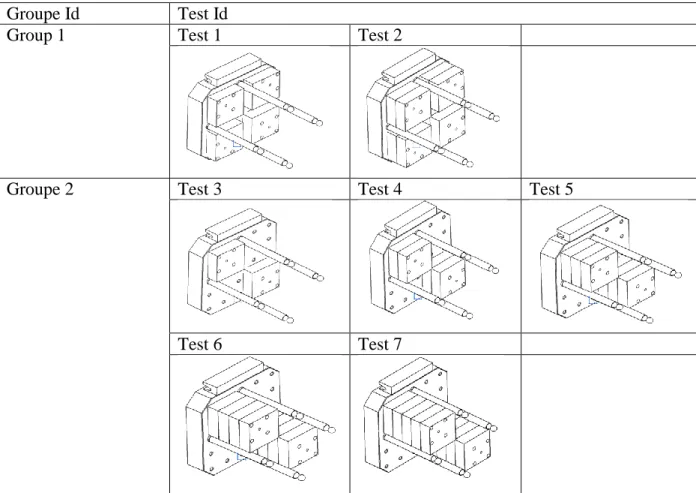
To avoid such disturbance in the current study the spheres are directly attached to the table. As for the loading strategy, six different groups of load were chosen as shown in Table 4.1 and Table 4.2. The first two produce a force with a small torque (only blocs of steal of 8,168 kg each are used) while the other four accentuate the resulting torques through the use of spacers. The load settings of each test are presented in Table 4.3.
Table 4.1 : Tests groups and configurations (Part 1)
Groupe Id Test Id
Group 1 Test 1 Test 2
Groupe 2 Test 3 Test 4 Test 5
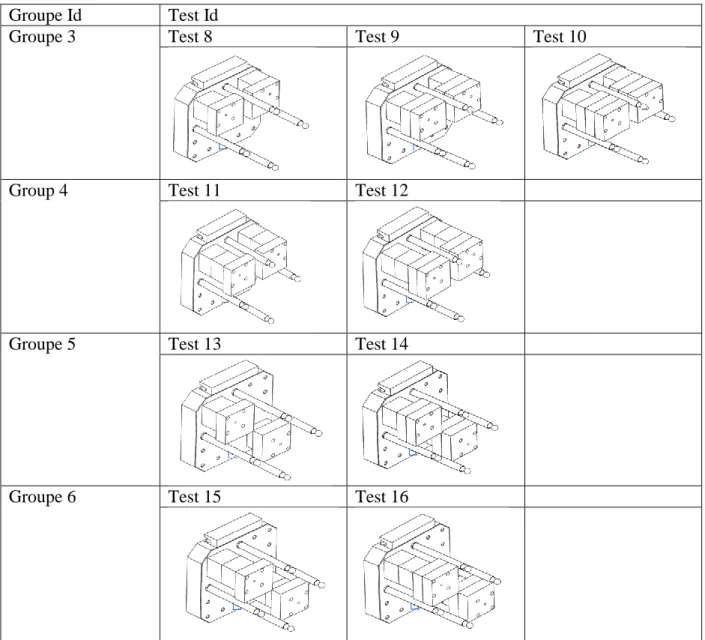
Table 4.2 : Tests groups and configurations (Part 2)
Groupe Id Test Id
Groupe 3 Test 8 Test 9 Test 10
Group 4 Test 11 Test 12
Groupe 5 Test 13 Test 14
Groupe 6 Test 15 Test 16
These loading configurations have been set in order to go over a vast range of forces and torques. Indeed, forces go from 160,2 N to 801,2 N and torques go from 4 Nm to 98,6 Nm (See Table 4.7). Thus, tests 1 to 7 focus on weight while tests 8 to 16 focus on torque where spacers will be privileged over blocs.
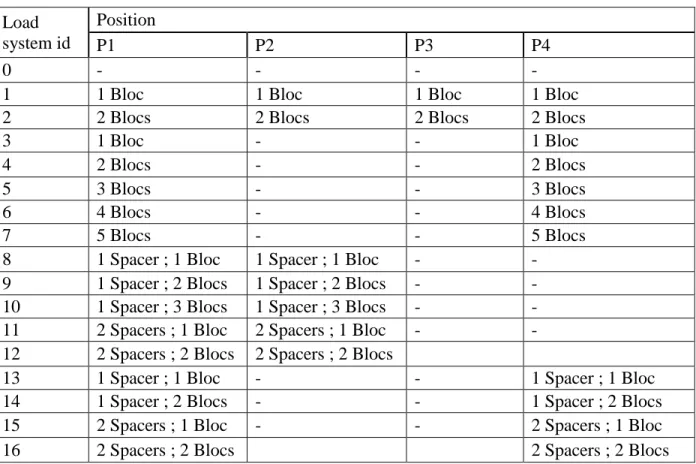
Table 4.3 : Test protocol – loads Load system id Position P1 P2 P3 P4 0 - - -
-1 1 Bloc 1 Bloc 1 Bloc 1 Bloc
2 2 Blocs 2 Blocs 2 Blocs 2 Blocs
3 1 Bloc - - 1 Bloc
4 2 Blocs - - 2 Blocs
5 3 Blocs - - 3 Blocs
6 4 Blocs - - 4 Blocs
7 5 Blocs - - 5 Blocs
8 1 Spacer ; 1 Bloc 1 Spacer ; 1 Bloc -
-9 1 Spacer ; 2 Blocs 1 Spacer ; 2 Blocs -
-10 1 Spacer ; 3 Blocs 1 Spacer ; 3 Blocs -
-11 2 Spacers ; 1 Bloc 2 Spacers ; 1 Bloc -
-12 2 Spacers ; 2 Blocs 2 Spacers ; 2 Blocs
13 1 Spacer ; 1 Bloc - - 1 Spacer ; 1 Bloc
14 1 Spacer ; 2 Blocs - - 1 Spacer ; 2 Blocs
15 2 Spacers ; 1 Bloc - - 2 Spacers ; 1 Bloc
16 2 Spacers ; 2 Blocs 2 Spacers ; 2 Blocs
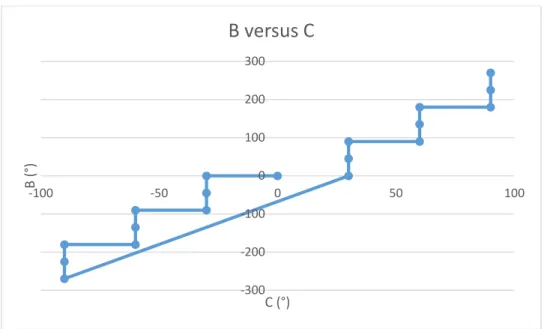
P1, P2, P3 and P4 represent the four locations where blocs and spacers are fixed on the table (See Figure 4.3). For example, a bloc fixed at position 1 (P1) is attached to the table using four threaded bars screwed in the four top left corner holes of the table as shown in the figures of Table 4.1 and Table 4.2. S1, S2, S3 and S4 are the location of the four spheres fixed on the table. The different indexations in which the spheres will be probed have been set in a special order to facilitate the detection of trends in the acquired data. This order respect the following strategy: the B- and C-axis are set at different indexations so that between two indexations only one angle can be changed in order to determine if deflections are coming from the rotation of the B-axis, the C-axis or both (See Table 4.4). A plot of the evolution of the B and C-axis indexation is shown on Figure 4.4.
Table 4.4 : Test protocol – B- and C-axis indexation Indexation identification number Indexation (degrees) B C 1 0 0 2 -30 0 3 -30 -45 4 -30 -90 5 -60 -90 6 -60 -135 7 -60 -180 8 -90 -180 9 -90 -225 10 -90 -270 11 30 0 12 30 45 13 30 90 14 60 90 15 60 135 16 60 180 17 90 180 18 90 225 19 90 270
Figure 4.3 : Loading positions and spheres positions
P1 P2 P3 P4 Spheres S1 S3 S4 S2
Figure 4.4 : Test Protocol – B- and C-axis indexations throughout one test
4.4 Repeatability Test
The test protocol involves various loads. The load is changed after the table has been automatically transferred to the pallet changer area. Thus the position repeatability in X, Y and Z directions of the removal and re-installation process of the table was quantified from n repetitions using the standard deviation [23] :
𝑠 = √∑ (𝑥𝑖− 𝑥̅)2 𝑛
1 𝑛 − 1
xi : ith measurement, obtained from a set of n measurements (here, x is one of the measurement);
𝑥̅ : Average value of the set of n measurements; n : number of measurements.
The test protocol for the repeatability test uses five spheres fixed on the table and their centre coordinates measured. Then the table goes into the loading area and comes back inside the working area of the machine followed by the re-measurement of the balls centre coordinates. This was repeated five times. The x, y and z coordinates are obtained as shown in Table 6.1. The standard deviations of the centre coordinates for each ball are listed in Table 4.5 and shown in Figure 4.5.
-300 -200 -100 0 100 200 300 -100B ( -50 0 50 100 °) C (°)
B versus C
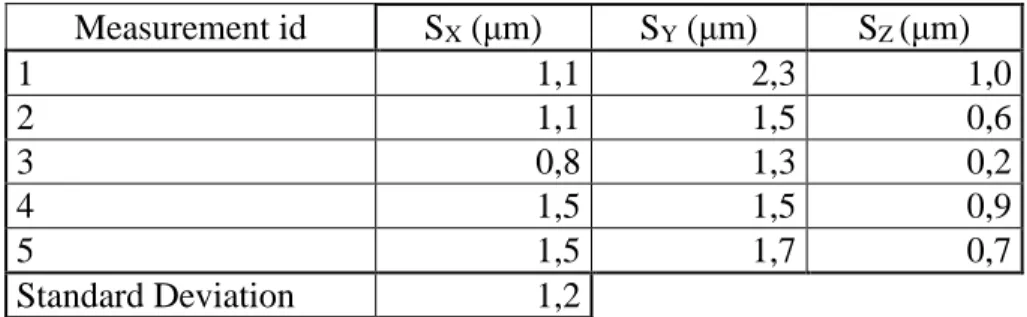
Table 4.5 : Repeatability of the table removal and remounting process with no load (mm) Measurement id SX (μm) SY (μm) SZ (μm) 1 1,1 2,3 1,0 2 1,1 1,5 0,6 3 0,8 1,3 0,2 4 1,5 1,5 0,9 5 1,5 1,7 0,7 Standard Deviation 1,2
Table 4.5 shows that the repeatability in the Z-axis is better than the repeatability in the X- and Y-axis. The Y-axis is the least repeatable. The value of 1,2 μm has been set as critical value. This value quantifies the limit in the loaded test data precision. A particular attention will be given to this value when analysing the loaded test results.
Figure 4.5 : Repeatability diagram
4.5 Loading system
The load tests consist in applying one of the previously described load system, changing the B- and C-axis indexations and probing the accessible spheres. The loading and reference artefact system consists in three parts: the blocs and spacers shown in Figure 4.6, Figure 4.7 and Figure 4.8 and the spheres mounted on rods of various lengths as shown in Figure 4.9 and Figure 4.10.
0 0,0005 0,001 0,0015 0,002 0,0025
Rep_X Rep_Y Rep_Z
Repetability (mm) Ball_1 Ball_2 Ball_3 Ball_4 Ball_5
Figure 4.6 : Bloc (left) and spacer (right)
Figure 4.8 : Drawing of the spacer with nominal dimensions
Figure 4.9 : Rod mounted sphere
Then everything is fixed on the machine table using threaded bars and nuts. The maximum load accepted by the machine is 100 kg, so a maximum of 12 blocs could be fixed on the table. Also, the maximum height acceptable (in z) is 300 mm, which limits the amount of blocs to 6 blocs piled up. Then the center of the four spheres attached to the rods (as shown in Figure 4.9) is at a height of 280 mm from the table top. In order to keep space for the probe to reach the spheres a maximum of 5 blocs piled up will be used at once. All configurations shown in Table 4.1and Table 4.2 fulfil these two criteria.
The rods are 280 mm long, from the table to the centre of the sphere, which could deviate under their own weight or under the probe force during the probing. This possibility was tested and the deviation was estimated to be 0,012 mm on average. This is a large value compared to the measured volumetric errors In order for the analysis not to be affected by this effect, reference values from the unloaded test, ‘’Test_0’’ are subtracted to all results to remove such effects from the measured sphere centre coordinates under load.
Then, for a particular set of indexations and load, every accessible sphere is probed to collect its centre position. Depending on the indexations and loading configurations some spheres may not be measurable due to interference or collision risks between the probe stylus or body and the other spheres or blocs or with the machine table.
Each test lasts two hours, including the assembly and the disassembly of the blocs and spacers. A particular attention was given to the position of the spheres avoiding physical contact with the rods or spheres during changes to the loading system to avoid altering the ball positions. That way, we are able to compare results between different loading configurations.
4.6 Data acquisition
Figure 4.11 shows the acquisition of sphere 2 X-, Y- and Z-coordinate during test 4 for indexation (0°;30°;45°).
Figure 4.11 : Data acquisition during test 4
Every test conducted on the machine produced a txt file in which spheres X, Y and Z coordinates, spheres id and indexations are listed. These data were organized in a table such as the one presented in Table 4.6 (Table 4.6 is a subset of the complete table).
Each line of Table 4.6 represents the volumetric errors in the R1 system (See Figure 4.12) for a particular loading configuration. The first identification number aside from X, Y and Z is the sphere identifier and the second is the indexation identifier. In total there are 16 loading configurations, 19 indexations and the number of spheres probed in each indexation depends on their accessibility. Using the unloaded state as reference, the initial unloaded volumetric error as well as errors due to the probing process such as small bending of the stem holding each ball and any probe lobbing effect is removed. The remaining volumetric error changes are not null which supports the hypothesis that deformations occur while working under load. However it cannot be certified at this point that all deviations come from load, other deviation sources can play a role such as thermal effects.
Table 4.6 : Spheres deviations (sample) Test id Test_ball_indexation Δx1,1* (μm) Δy1,1 (μm) Δz1,1 (μm) Δx2,1 (μm) Δy2,1 (μm) Δz2,1 (μm) 0 0 0 0 0 0 0 1 9,0 1,0 1,0 9,7 15,2 2,5 2 9,0 11,0 3,5 3,2 7,2 7,5 3 7,5 5,5 3,0 1,7 9,2 3,5 4 6,5 3,5 3,0 1,7 10,2 1,5 5 6,5 3,5 3,0 2,0 9,0 0,5 6 3,7 4,2 3,0 1,7 2,2 9,5 7 6,5 7,5 3,0 4,2 1,7 10,0 8 1,2 3,2 8,0 0,2 5,7 7,5
*In Δxi,j, i is the ball identifier and j is the indexation identifier
These values are over 10 times larger than the critical value of 1,2 μm presented in the repeatability test part, which confirms that they are significant.
Figure 4.12 : R1 system when the machine axis positions are x=b=c=0. The frame does not move with the table translation in X or rotation around B or C.
The R1 system is set as presented in Figure 4.12. It does not rotates or translate when the B- and C- axis rotate. Every data of this study is set according to this system of axis.
4.7 Experimental and additional data
4.7.1 Experimental data
As presented above, every test conducted on the machine provides the machine tool X-, Y- and Z-axis readings corresponding to the centre of each probed sphere for a specific B- and C-Z-axis indexation set as well as the sphere id probed.
4.7.2 Additional data
The difference between the X, Y and Z coordinates from test 1 to 16 relative to test 0 (unloaded) are calculated as Δx, Δy and Δz and represent the change in volumetric errors of the machine with loading. Then, forces and torques due to the load are computed for each indexations in the R1 reference frame as Fx, Fy Fz, Mx, My and Mz. (See Figure 4.14). Thanks to the CAD software CATIA V5R21 the total weight and the centre of gravity of every bloc and spacer mounted on the table, is known in the R2 system described on Figure 4.13.
Figure 4.13 : R2 system definition
Then the software Matlab was used to compute values of forces and torques for every loading system at every indexation in the R1 reference frame. Equation (4-1) was used to calculate the coordinate of the center of gravity of every loading system in the R1 reference frame:
[𝐺𝑥𝐺𝑦 𝐺𝑧 ] 𝑅1 = 𝑀𝐵. 𝑀𝐶. [𝐺𝑥𝐺𝑦 𝐺𝑧 ] 𝑅2 (4-1)
where Gx, Gy and Gz are the coordinate of the center of gravity of a loading system. MB and MC are the rotation matrices ((4-2) and (4-3)) for the coordinate transformation from the R2 system to the R1 system.
𝑀𝐵 = [
cos(𝐵) 0 sin(𝐵)
0 1 0
−sin(𝐵) 0 cos(𝐵)] (4-2)
𝑀𝐶 = [cos(𝐶) −sin(𝐶) 0sin(𝐶) cos(𝐶) 0
0 0 1
] (4-3)
Table 4.7 gives for every loading system the values of forces, weight and torque in the R1 system. Table 4.7 : Table setting, forces and torques in the R1 system for B=C=0°.
Loading
system id Force (N) Weight (kg)
Torque (Nm) 1 320,5 32,0 8,0 2 641,0 64,1 31,9 3 160,2 16,0 4,0 4 320,5 32,0 15,9 5 480,7 48,1 35,8 6 641,0 64,1 63,6 7 801,2 80,1 98,6 8 173,5 17,4 3,1 9 333,8 33,4 40,6 10 494,0 49,4 72,5 11 186,8 18,7 30,2 12 347,0 34,7 66,3 13 173,5 17,4 16,6 14 333,8 33,4 40,6 15 186,8 18,7 30,2 16 347,0 34,7 66,3
Figure 4.14 : Forces and torques in the R1 reference frame
All test data (order of test, X, Y, Z coordinates, Δx, Δy and Δz and Fx, Fy Fz, Mx, My, Mz) are concatenated in a single matrix, Mall, of 496 column and 17 lines. Each line represents the results for a particular loading configuration.
The main additional data generated for this analysis is the apparent rigid body motion of the table associated to the probed spheres and which, in principle, reflect the work table shift provided the X, Y and Z measurements are not themselves degraded. In the R1 system, the linear deviations along each axis are named δx, δy and δz and the angular deviations around each axis are named α, β and γ.
However, this calculation can be conducted only if three or four spheres are probed. A subset of 12 of the 19 indexations met this requirement.
Based on [24], equation (4-4) is used to compute in the R1 frame (machine frame) linear and angular apparent deviation of the machine table plane (the rigid body motion of the table):
[ΔxΔy Δz ] = [δxδy δz ] + [ α β γ] ⋀ [ 𝑋 𝑌 𝑍 ] (4-4)
Δx, Δy and Δz represent the change in volumetric errors of the machine.
X, Y and Z are the coordinate of the spheres probed for a specific load and indexation
δx, δy and δz are the linear deviations of the table plane
α, β and γ are the angular deviations of the table plane
Unknown are δx, δy, δz, α, β and γ. In order to solve this Equation (4-4) the matrix form is used (4-5): [ΔxΔy Δz ] = [𝑀] ∗ [ δx δy δz α β γ ] (4-5)
The linear and angular deviations are calculated and then the residues, or unexplained coordinate variations, are computed.
The work table deviation results as a rigid body are shown in Table 4.8. Table 4.9 lists residuals from this calculation. It can be seen that some residual values have the same order of magnitude as the estimated work table deviations (highlighted in yellow in Table 4.9). That could have at least two possible causes: either the table becomes distorted under its own weight or under the weight of the loading system or residues could be explained by distortions of the X-, Y- or Z-axis that occurs under the added weight, which affect their ability to correctly measure the sphere center coordinate or a combination of both.
The hypothesis that claims that the table could become distorted under its own weight or under the weight of the loading system could be invalidate by a simple calculation of the highest value of deflection caused by the most heavy loading system put on the table during these tests. The
maximum weight put on the table is 801,2 N (See Table 4.7). The machine table has a section of 76,6 mm x 400 mm.
Equation (4-6) was used for the calculation:
𝑓 =𝑃𝐿3
3𝐸𝐼 (4-6)
P : The force put on the table
L : The length of the lever arm
E : The Young’s modulus
I : Second moment of area
Equation (4-6) yields a maximum deflection of the table of 0,0011mm. This is the same order of magnitude as the position repeatability of the table traveling from the working area to the loading area and is much less than the average value of volumetric errors or rigid body motion of the table. This suggests that the residuals are likely due to distortion of the X-, Y- and Z-axis which inhibits their ability to correctly measure the balls position.
Table 4.8 : Rigid body motion of the table reference balls for tests 0, 1 and 2 for B=0° and C=0°
Test_id 0 1 2 δx (m) 0 2,2 1,3 δy (m) 0 0,9 -9,8 δz (m) 0 -3,7 3,8 α (rad) 0 9,4 21,8 β (rad) 0 15,6 -1,5 γ (rad) 0 -16,1 -19,9
Table 4.9 : Apparent rigid body motion volumetric residues (apparent distortion of the relative position of the table reference balls) for tests 0, 1 and 2 for B=0° and C=0°
Test_id 0 1 2 Δx1,1 (m) 0 -15,7 -1,0 Δy1,1 (m) 0 0,1 1,8 Δz1,1 (m) 0 0,3 -0,1 Δx2,1 (m) 0 0,5 -0,9 Δy2,1 (m) 0 16,9 8,7 Δz2,1 (m) 0 -0,3 0,1 Δx3,1 (m) 0 13,6 9,6 Δy3,1 (m) 0 -1,0 -0,4 Δz3,1 (m) 0 0,3 -0,1 Δx4,1 (m) 0 1,7 1,3 Δy4,1 (m) 0 -16,0 -10,1 Δz4,1 (m) 0 -0,2 0,1
4.8 Data analysis
The data analysis approach will focus on the detection of significant correlations between all variables. Because this work focuses on the effect of load on the machine tool volumetric errors, attention has been concentrated on the potential correlations between forces and torques with volumetric errors (Δx, Δy and Δz) and rigid body motion of the table plane (δx, δy, δz α, β and γ) in order to detect whether volumetric errors and rigid body motion of the table are function of the load.
This search for significant correlations has been conducted using statistical tests such as p-values and the correlation coefficients R.
Correlation coefficients are between -1 and 1. The closest it gets of -1 or 1 the strongest the correlation. A high correlation coefficient is between 0,7 and 1 or between -0,7 and -1 [25]. The p-value test informs us on the significance of a correlation. It represents the probability that the correlation is due to luck. Thus, we are looking for a small p-value, between 0 and 0,05 [26], which correspond to a probability of 95% that the correlation is not due to the luck. As an example of its use in manufacturing, p-values were used in the work of Özel and Karpat (2005) [27] to determine which manufacturing factors were linked to the surface roughness of the machined part.
In this paper, the search for correlations has been conducted for the volumetric errors (Δx, Δy and Δz) and the rigid body motion of the table (δx, δy, δz α, β and γ).
4.8.1 Correlations analysis
4.8.1.1 Correlation between load and volumetric errors (Δx, Δy and Δz)
Table 4.10 summarises the significant correlations between volumetric errors and the load. It can be observed that for every indexations, significant correlations occur linking Fy and Δx, Δy and Δz.. The other indexations show similar trends and correlations appear between Mcx, Mcz and Δx, Δy and Δz. As an example, Table 4.10 shows significant correlations between Fy and Δy3, Δy4 and Δz3 for B=30° and C=0° and Figure 4.15 shows the evolution of Δy3, Δy4 and Δz3 versus Fy. For a good part of this paper and in order to keep figures readable and explanations understandable, tests 3 to 7 will be taken as examples as they are the best suited to show the behaviour under load. Indeed, they go through a vast range of load with respect of the same load position.
Table 4.10 : Correlation summary between some volumetric errors and the load (sample)
Indexation Var 1 Var 2 R p-values
(0°; 0°; 0°) Fy Δz4 0,96 0,012 (0°; 30°; 0°) Fy Δy3 0,85 p˂0,001 Fy Δz3 0,73 p˂0,001 Fy Δy4 0,87 p˂0,001 (0°; 30°;45°) Fy Δy2 0,93 p˂0,001 Fy Δy3 0,96 p˂0,001 Fy Δx4 0,77 p˂0,001 (0°; 30°; 90°) Fy Δz2 -0,72 0,001 Fy Δy3 0,95 p˂0,001 Fy Δy4 0,94 p˂0,001
Figure 4.15 : Volumetric errors (Δy3, Δy4, Δz3) versus Fy, for tests 3 to 7, for B=30° and C=0° Figure 4.15 shows that the larger the forces the larger the volumetric errors. Also, it can be observed that Δy evolves in the negative direction of the graph, which corresponds to the direction of gravity. On the other hand, Δz increases in the positive direction as the weight increases. This is also an expected behaviour because the table is vertical and the load is eccentric towards z+ causing a positive moment around the x-axis that tends to decrease the distance between the spheres and the probe on the Z-axis. Even though the load is within manufacturers limits Figure 4.16 shows values up to 0,025 mm, which is significant for a five-axis CNC machine tool with micrometer resolution scales.
Furthermore, a linear regression is shown in Figure 4.16 between Δy4 and Fy to estimate compliance, to compare with values in [11] on the testing of machine tools under load conditions. The reported values of stiffness are between 10 and 12 N/m while Figure 4.16 indicate a value of 25 N/m (a compliance of 5x10⁻⁵ for this specific test). As we can see on Figure 4.15 the slope of the curve Δy3 = f(Fy) is smaller than the one of Δy4 = f(Fy) and is closer to the value of A. Archenti. These values seem coherent and the difference could be explained by the fact that Archenti used a different machine with a horizontal table under different test conditions.
-0,03 -0,025 -0,02 -0,015 -0,01 -0,005 0 0,005 0,01 0,015 -1000 -800 -600 -400 -200 0 Δ (m m ) Fy (N)
Δy3, Δy4, Δz3 versus Fy
Δy3 Δy4 Δz3
Figure 4.16 : Δy4 versus Fy, with linear regression, for tests 3 to 7 and indexations (0°; 30°; 0°), (0°;30°;45°), (0°;30°;90°), (0°;60°;135°)
It was noticed that the slope changes depending on the indexation (See Figure 4.16). For B=0° or B=90° moments are not oriented according to the same machine axis. The load is not mechanically supported the same way, which could explain the changes in compliance values.
4.8.1.2 Correlation between load and the apparent rigid body motion of the table (δx, δy, δz α, β and γ)
Following the same method to find significant correlations between volumetric errors and the load, correlations between load and the apparent rigid body motion of the table have been studied and a sample of the significant correlation found is presented inTable 4.11.
y = 4E-05x + 0,0045 R² = 0,9747 y = 4E-05x + 0,006 R² = 0,9804 y = 3E-05x + 0,0105 R² = 0,9725 y = 2E-05x + 0,0103 R² = 0,923 -0,03 -0,025 -0,02 -0,015 -0,01 -0,005 0 0,005 0,01 -1000 -800 -600 -400 -200 0 Δy ( m m ) Fy (N)
Δy4 = f(Fy)
Δy4 (0°;30°;0°) Δy4 (0°;30°;45°) Δy4 (0°;30°;90°) Δy4 (0°;60°;135°) Linéaire (Δy4 (0°;30°;0°)) Linéaire (Δy4 (0°;30°;45°)) Linéaire (Δy4 (0°;30°;90°)) Linéaire (Δy4 (0°;60°;135°))Table 4.11 : Correlation summary (apparent rigid body motion of the table and load) (sample)
Indexation Var 1 Var 2 R p-values
(0;0;0) Fy α -0,832 p˂0,001 Mcx δx 0,782 p˂0,001 Mcx α 0,839 p˂0,001 (0;30;0) Fy α -0,881 p˂0,001 Mcx α 0,751 p˂0,001 Mcz α 0,751 p˂0,001 (0;30;45) Fy α -0,830 p˂0,001 (0;30;90) Fy α -0,916 p˂0,001 (0;60;135) Fy -0,738 p˂0,001 (0;60;180) Fy δy 0,807 p˂0,001 Mcx -0,719 0,002 Mcz -0,719 0,002
Table 4.11 shows less significant correlations between the load and the rigid body motion of the table. Thus the correlation coefficient is not as high as the one computed in the previous study on the link between load and volumetric errors. The majority of significant correlation is here between Fy and α they are represented in Figure 4.17.
Figure 4.17 : Load effect on the rigid body motion of the table
A correlation exists between the load and the rigid body motion of the table. According to Table 4.11 it seems that this correlation concerns more the angular deviation than the linear deviations. The fact that for the first four indexations the correlation is between Fy and α and not another axis
0,00E+00 5,00E-06 1,00E-05 1,50E-05 2,00E-05 2,50E-05 3,00E-05 3,50E-05 4,00E-05 -1000 -800 -600 -400 -200 0 α (r ad ) F (N) α = f(Fy), Tests 3 to 7 indexation (0°;0°;0°) Indexation (0°;30°;0°) Indexation (0°;30°;45°) Indexation (0°;30°;90°)
is a coherent behaviour. Then as the B axis moves to higher values such as 60° the correlation moves to the γ axis, which is also a coherent behaviour because the moment then gradually becomes around the machine Z-axis.
4.8.2 The influence of the indexations
The influence of the indexation will be studied while the load will stay unchanged, which correspond to an entire test. Test 7 is used to illustrate observations as it was used previously in the document.
The machine indexations change the X-axis positions used for probing because the balls are translated in X by the action of the B- and C-axis indexations. That means that if B rotates the X-axis has to travel in order for the probe to take its measurement of a specific sphere. That means that the B- and X-axis are related. Here we will investigate the connection between the table position and the rigid body motion of the table as well as volumetric errors.
As an example it has been possible to observe that during an entire test (the load stays the same, only indexations change) the rigid body motion of the table do not stay constant as shown in Figure 4.18 and Figure 4.19.
Figure 4.18 : δ versus X3, for test 7, influence of the table position on the rigid body motion of the table; tot is the total linear rigid body motion
-0,01 -0,005 0 0,005 0,01 0,015 -400 -200 0 200 400 δ (mm ) Table position (mm) δ versus X3, Test 7 δtot = f(X3) δx = f(X3) δz = f(X3) δy = f(X3)
Figure 4.19 : Angular deviation versus X3, influence of the table position on the table angular deviation
θtot is the total angular rigid body motion of the table.
Figure 4.18 shows that the rigid body motion of the table are not constant during a test. That means that one or more axis is responsible for these variations. During a test, every axis of the machine changes position. It is possible to observe that linear deviations in the X and Y directions are positive while linear deviations in the Z direction are negative. That could be explained by the effect of the loading systems on the table. The load stacks tend to make the table rotate around the X-axis, which reduces the relative distance between the spheres and the probe in the Z direction. Figure 4.19 shows a similar behaviour. However, we are able to observe that deviations around the Y-axis (β) stay almost null while the other ( and ) go up to 0,000045 rad. This is consistent with the loading, which produced no moment around this axis.
Furthermore significant correlations have been found between the table position, the volumetric errors and the rigid body motion of the table as shown in Table 4.12 and Table 4.13.
-5,00E-05 -4,00E-05 -3,00E-05 -2,00E-05 -1,00E-05 0,00E+00 1,00E-05 2,00E-05 3,00E-05 4,00E-05 5,00E-05 6,00E-05 -400 -200 0 200 400 A n gu la r d e via ti on (r ad ) X3 (mm)
Angular deviation versus X3
α = f(X3) β = f(X3) γ = f(X3) θtot = f(X3)
Table 4.12 : Correlation summary for test 7 (Rigid body motion of the table and table position)
Test_Id Var 1 Var 2 R p-values
7 X3 δx 0,792 0,002 X1 γ -0,757 0,005 X2 γ -0,923 p˂0,001 X3 γ -0,961 p˂0,001 X4 γ -0,956 p˂0,001 X1 αtot 0,813 0,001 X4 αtot 0,714 0,009
Even though it is not possible to specify what specific axis is behind the errors measured, Table 4.12 shows strong and numerous correlations between the table position and γ.
Table 4.13 : Correlation summary for test 7 (volumetric errors and table position)
Test_Id Var 1 Var 2 R p-values
7 X1 Δy1 -0,85 0,008 X1 Δx4 0,73 0,038 X3 Δx3 0,9 0,002 X3 Δx4 0,76 0,028 X3 Δy4 -0,75 0,030 X4 Δy1 -0,82 0,013 X4 Δy3 0,89 0,004 X4 Δx4 0,94 p˂0,001
The other tests also show significant correlations between the table position and the rigid body motion of the table. All these correlation are high. This suggests the possibility to model these deviations and errors with an elastic model and eventually predict the behaviour of the machine under load.
4.9 Conclusion
This study presented a test protocol which made it possible to investigate the existence of significant volumetric errors correlated with the load. The goal was to observe the influence of the weight of a workpiece on the precision of a specific machine. Even though tests stayed in the specifications of the machine (100 kg maximum), volumetric errors up to 0,03 mm were observed. Moreover, volumetric errors show a coherent evolution with the load.
According to the p-value test applied to the data, it is possible to claim that significant correlations exist between the load, the volumetric errors and the rigid body motion of the table. This conclusion
is also supported by graphs showing the correlation between variables such as the forces and volumetric errors. Regressions have been computed between volumetric errors and forces yielding compliance values similar to those found in other studies.
Strong correlations were observed between the force in Y and moment around X, induced by the load stacks, and the volumetric errors in Y and Z and on the rigid body motion of the table as α and γ rotations. Those correlations are coherent with the effect of a negative vertical force on a vertical table. Significant correlations also appear between the table position, the indexation, volumetric errors and the rigid body motion of the table.
The method presented in this paper is applicable to other machine geometries and further the understanding of the effect of load on volumetric errors, which should eventually lend to the development of prediction and compensation models.
4.10 Acknowledgments
CHAPITRE 5
DISCUSSION GÉNÉRALE
Le but de cette étude est de démontrer ou non l’existence de liens significatifs entre le chargement de la table de la machine et les erreurs volumétriques engendrées. Pour se faire, un protocole de test a été proposé. Il utilise un test nommé « test_0 » qui a pour but d’annuler les erreurs propres à la machine comme les erreurs géométriques. Ainsi, chaque test en charge est comparé (par une opération de soustraction des coordonnées de palpage) à ce test 0, ce qui rend possible une comparaison précise entre les données de chaque test. Cette décision a été prise suite au travail de Asadishad, B. [1] qui a positionné les sphères de son test sur les empilements de blocs. Un calcul lui a permis d’affirmer que les empilements présentaient une valeur de déflection non négligeable qui changeait la position de la sphère qui y était fixée. Néanmoins, le choix de positionner les sphères directement sur la table a nécessité l’utilisation de longues tiges (chaque sphère est à une hauteur de 280mm par rapport à la surface de la table). Sous l’effet de la force engendrée par le palpeur lors d’une opération de palpage, la tige fléchit et affecte la position réelle de la sphère. L’utilisation du test « 0 » permet de se soustraire de ce problème. D’autre part, le protocole de test ne fait pas appel à de l’équipement spécifique comme une « double ball bar » ou une « loaded double ball bar » comme ce qu’utilise Archenti, A. [11] dans ses travaux, ce qui rend le protocole moins couteux et plus facile à mettre en place. Le seul équipement couteux pour ce test est le palpeur.
Ce test présente néanmoins des limitations dans la mesure où chaque bloc pesant 8,168 kg et mesurant 50 mm d’épaisseur, le nombre de bloc se voit limité par les spécifications de la machine à savoir 100 kg maximum de charge et 300 mm de hauteur sur table. La masse des blocs, qui définit le pas du chargement, est donc importante par rapport à la plage de masse étudiée. La précision du protocole de test est ainsi limitée par ce pas.
De plus, le volume occupé par le chargement entre parfois en conflit avec les trajectoires que doit prendre l’outil pour palper une sphère donnée (fonction de l’indexation). Certain tests se retrouvent avec uniquement une sphère palpée, ce qui réduit le nombre de test utilisable pour l’analyse et notamment au niveau de l’étude des déviations du plan de la table.
Quant à l’utilisation des tests statistiques, les seuils de valeur pour le coefficient de corrélation et la valeur p ont été choisis en fonction de ceux utilisés couramment dans des travaux ultérieurs. Ainsi une valeur de coefficient de corrélation de 0,7 et de p-value de 0,05 aura été retenue. La
![Figure 4.1 : Kinematic chain of the five-axis machine tool studied [1]](https://thumb-eu.123doks.com/thumbv2/123doknet/2344035.34462/24.918.217.703.321.850/figure-kinematic-chain-axis-machine-tool-studied.webp)
![Figure 4.2 : Spheres mounted on blocs of the loading system in [1]](https://thumb-eu.123doks.com/thumbv2/123doknet/2344035.34462/25.918.368.557.268.466/figure-spheres-mounted-blocs-loading.webp)