HAL Id: hal-01065852
https://hal.archives-ouvertes.fr/hal-01065852
Submitted on 22 Sep 2014HAL is a multi-disciplinary open access archive for the deposit and dissemination of sci-entific research documents, whether they are pub-lished or not. The documents may come from teaching and research institutions in France or abroad, or from public or private research centers.
L’archive ouverte pluridisciplinaire HAL, est destinée au dépôt et à la diffusion de documents scientifiques de niveau recherche, publiés ou non, émanant des établissements d’enseignement et de recherche français ou étrangers, des laboratoires publics ou privés.
Philippe Glenat
To cite this version:
Aline Melchuna, Ana Cameirão, Yamina Ouabbas, Jean-Michel Herri, Philippe Glenat. Transport of hydrate slurry at high water cut. The 8th International Conference on Gas Hydrates, Jul 2014, Pékin, China. pp.T5-16. �hal-01065852�
TRANSPORT OF HYDRATE SLURRY AT HIGH WATER CUT
Aline MELCHUNA, Ana CAMEIRAO*, Yamina OUABBAS, Jean-Michel HERRI
Gas Hydrate Dynamics Centre, Ecole Nationale Supérieure des Mines de Saint-Etienne, 158
Cours Fauriel, Saint-Etienne 42023, FRANCE
Philippe GLENAT
TOTAL S.A. – CSTJF, Avenue Larribau, PAU Cedex 64018, FRANCE
ABSTRACT
Oil transportation in pipelines at the end of field production life implies to flow high quantities of water which represents the dominant phase. The process of crystallization of gas hydrates in this system needs to be studied and compared to the opposite one widely studied in the literature where water is the dispersed phase. The laboratory is equipped with the Archimede flow loop where the hydrate crystallization and transport are monitored. The flow loop is equipped with pressure and temperature probes, to observe the transport with differential pressure drop probes, with an FBRM probe (Focused Beam Reflectance Measurements), an ATR probe (IR measurement) and a PVM probe (Particle Video Microscope). We have performed a parametric study based on the water content (60% - 90%), and liquid flow rates (200L/h and 400L/h) in order to observe the crystallization of methane hydrates from an emulsion of liquid Kerdane (C11 – C14) and liquid water. A set of experiments without and with commercial AA-LDHI (Anti-Agglomerant - Low Dosage Hydrate Inhibiter) were compared. For experiments without AA-LDHI, when the amount of hydrates reaches a critical zone, flow is stopped by either impossibility to transport (too viscous slurry) or hydrates sticking to the flow loop walls. In experiments with AA-LDHI we observe the benefice of adding a chemical dispersant to maintain flow and prevent instabilities.
Keywords: gas hydrates, flow assurance, pipelines, high water cut, dispersant, AA-LDHI
NOMENCLATURE f friction factor [-] Re Reynolds’ Number [-] ∆P pressure drop [bar] D diameter [m] L length [m] ρ density [kg.m-3] v fluid velocity [m.s-1] μ viscosity [mPa.s] η conversion [-]
n0 initial quantity of methane [mol]
mw initial mass of water [g]
Mw water molar mass [g.mol -1 ] ρw water density [kg.m -3 ] ρo oil density [kg.m -3 ] xw water mass fraction [-]
INTRODUCTION
The offshore extraction of petroleum in deeper conditions increases day after day and favors the conditions of hydrate formation (low temperature and high pressure).
Hydrates are ice-like structures; formed by a process of crystallization, due to the union of water molecules around a “guest molecule”, at the cited case, probably, a natural gas. When they form at the pipeline, they often lead to large pressure drops and in some cases to an impermeable plug [1], representing a great concern in flow assurance.
There are some methods used to deal with the hydrate formation. The most common among them is the use of thermodynamic hydrate inhibitors (THIs), which act at the hydrate equilibrium conditions, shifting it to higher pressure and lower temperature. The proportion of THIs injected is designed from the necessary shift to prevent hydrate formation, and the quantities of THI can be too much important and in consequent costly. It is pushing the researchers to find other ways to handle the problem. Thus the focus changed from preventing the hydrate formation, and moved to avoiding the pipeline blockage, by the use of low dosage hydrate inhibitors (LDHIs) including kinetic hydrate inhibitors (KHIs) and anti-agglomerants (AAs). The first acts by delaying or slowing the first steps of the crystallization (nucleation and growth), and the second works by preventing agglomeration then acting as dispersant.
As an oil/gas field matures, the fraction of water increases. Another parameter come into play, since the cost of THIs injection is increased and the benefice of LDHIs is not well known. The development of new hydrate management strategies is limited by the understanding of hydrate plug formation mechanism. Also, the system, where the oil is the dispersed phase (oil-in-water emulsion), is poorly studied [2]. Therefore, exploring the hydrate formation at high water cut shows a real interest.
In the past, our contribution was first to model the agglomeration and its relationship with the viscosity of the suspension in a batch reactor [3]. Later, the Archimedes flow-loop was constructed to fit better with industrial conditions. Then we added a Focused Beam Reflectance Measurements (FBRM) to follow the agglomeration phenomenon (2005). Also an ATR-IR probe was added to follow the concentration of gases in the oil phase. And finally, in 2012, an in line and in-situ PVM probe (Particle Video Microscope) was added. Experimental studies of hydrate formation with flow loop require elaborated high pressure equipment (i.e. difficult to install and operate), but they can lead to relevant information about the hydrate slurry rheology. The rheology can be correlated to the size of particles via the measurement of the average chord length [4] that
is an indirect measurement of the Particle Size Distribution.
The objective of this work is to present the preliminary results of a parametric study of methane hydrate formation at high water cut and to observe the influence of a dispersant additive in this kind of system.
EXPERIMENTAL METHOD
The hydrate formation at high water cut has been studied, with and without anti-agglomerants (AAs). Experiments were performed, at controlled conditions of temperature (3°C) and pressure (80 bar), with varying 1) the amount of water, and 2) the flow rate.
The experiments are realized with a mixture of water and Kerdane in an atmosphere of methane – with and without the dispersant additive.
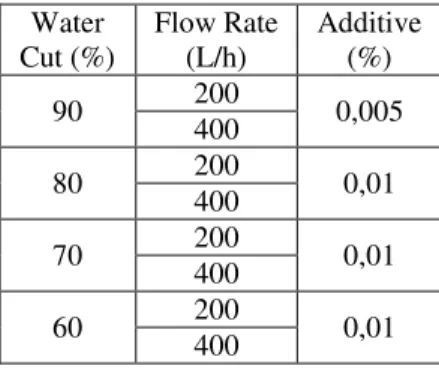
The experimental conditions are shown in Table 1 with additive. Experiments without additive were performed in the same conditions of water cut and flow rate. Water Cut (%) Flow Rate (L/h) Additive (%) 90 200 0,005 400 80 200 0,01 400 70 200 0,01 400 60 200 0,01 400
Table 1 Experiments conditions. Materials
Kerdane is the commercial denomination for an organic liquid phase (C11 – C14) supplied by TOTAL FLUIDES, while the pure methane (99.99%) is supplied by AIR LIQUIDE. The dispersant additive is a commercial anti-agglomerant (water soluble) provided by TOTAL. Experimental Apparatus
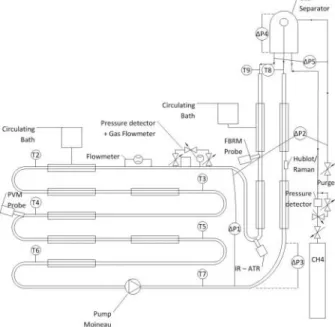
The Archimede flow loop (Figure 1) installed is composed by a horizontal section of 30 m, a riser of 12 m and a top gas-liquid separator. The total volume is 11.5 L. The Archimedes flow loop allows reproducing the thermodynamic conditions of the deep-sea, with temperature between (0°C –
14°) and a constant pressure until 100 bar. The pressure is controlled through a system of gas injection that compensates the gas solubilization and crystallization. The flow loop is equipped with a Moineau Pump that keeps the flow rate at a constant value between 72L/h and 500L/h.
The apparatus presents several temperature and differential pressure probes, a Coriolis flowmeter with a densimeter, and two in situ probes for particle characterization (FBRM and PVM) to support the understanding, especially of the emulsification, the crystallization, and the flow pattern.
Figure 1 Experimental Apparatus
The Focused Beam Reflectance Measurements probe (FBRM) is an in-situ particle analyzer provided by Mettler-Toledo Lasentec®. For more information about the FBRM probe, the reader is referred to [5].
The Particle Video Microscope probe (PVM) is an in-situ particle analyzer also provided by Mettler-Toledo Lasentec®. For more information about the PVM probe, the reader is referred to [6]. EXPERIMENTAL PROCEDURE
The Archimedes flow loop is charged with the desired amount of Kerdane and water (with or without additive), changing the proportions at each experiment, as shown in Table 1. The mixture is circulated in the flow loop until the emulsion is
formed. Then a rheological study is made. After the flow loop is pressurized with methane gas until the pressure of 80 bar and maintained at constant value by gas injection.
Emulsification
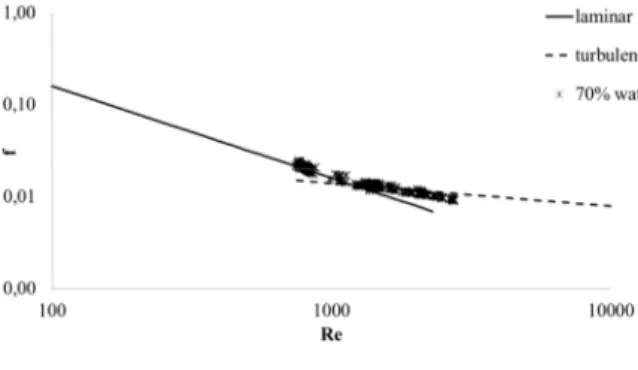
With the purpose of evaluating the formation of the emulsion, the mixture is circulated. Before crystallization, it is necessary to form an emulsion homogeneous and stable. The pressure drop and the average chord length were monitored and we can control that both signals are stable. So far, we can consider that the emulsion is homogeneous. Later, we perform a rheological study to know if the emulsion is stable, in laminar, transient or turbulent regimes depending of the flow rate. The flow regime is evaluated from a Moody scheme [7], which plots the friction factor as a function of the Reynolds’ Number, as shown in Figure 2.
Figure 2 Moody scheme for laminar and turbulent flow.
The friction factor for a laminar flow is calculated by Eq. 1. For a turbulent flow, the correlation of Blasius is used (for smooth pipe, Eq. 2). The Fanning empirical friction factor is calculated by Eq. 3, and is used to determine if the flow is laminar or turbulent. For Eqs. 1 and 2, the Reynolds’ number is calculated by Eq. 4.
16 (1)
0.079 .
(2) ∆
(4)
Crystallization
To achieve the thermodynamic conditions of the hydrate formation, the temperature of the system is reduced until3°C and the flow loop is pressurized until 80 bar by methane injection.
The beginning of crystallization is determined by a peak in the temperature and/or a peak in the pressure drop. Then we monitor the pressure drop, the chord length, the pictures from the PVM, and the gas injection rate.
To determine the conversion rate, the stoichiometry of the methane hydrate is fixed by Eq. 5. Thus the conversion rate is calculated by Eq. 6. CH4(g) + 5.75H2O(l)→ CH45.75H2O(s) (5) 5.75 ⁄ 100 (6) EXPERIMENTAL RESULTS
The mixture of water and Kerdane was submitted to a process of emulsion formation, to obtain a homogeneous and stable emulsion to avoid any influence in crystallization.
The emulsification is achieved when the pressure drop and the average chord length are approximately constants; an example is shown in Figure 3.
If we compare experiments with and without AA, we observe that the average chord length is clearly smaller (see Table 2) with AA, and that the emulsion is formed faster (Figure 3).
Figure 3 Pressure drop (entire line) and average chord length (dashed line) variation during the process of emulsion formation at 70% water cut
with and without AA.
Water Cut (%) Flow Rate (L/h) Average Chord Length (µm) Average Chord Length (µm) – with AA 90 200 25 8 400 26 9 80 200 22 10 400 19 9 70 200 28 8 400 23 10 60 200 27 9 400 23 9
Table 2 Average chord length at the end of emulsification experiments with and without AA. Once the emulsion is formed, a rheological characterization is performed, to determine the flow regimes and the stability by varying flow rates. At a flow rate less than 200L/h, the regime is laminar, and turbulent above. This transition of regime at the value of 200L/h is the same, with or without additive (Figures 4 and 5).
Figure 4 Theoretical friction factor for the experiment with 70% of water without AA.
0 5 10 15 20 25 30 35 0 0,1 0,2 0,3 0,4 0,5 0,6 0 10 20 30 40 50 60 A ve r age C h or d L e n gt h ( µ m ) P r e s s u r e D r op ( b ar ) Time (min) 70% - with AA 70% - without AA 70% - with AA 70% - without AA
Figure 5 Theoretical friction factor for the experiment with 70% of water with AA.
By varying the flow rate, the pressure drop is reproducible, even by increasing or decreasing the flow rate. It shows that emulsions are not modified and can be considered as stable.
The density of the emulsion was measured and compared with the theoretical density calculated by Eq. 7. The results (Table 3) show a good agreement in both cases (with and without additive). However, it can be seen that the use of additive minimizes the differences between the measured and calculated values, due to the better homogenization of the emulsion.
! ! (7) Water Cut (%) ρ ρ Calculated ρ – with AA ρ Calculated – with AA 90 992 981 983 980 80 990 962 961 962 70 970 945 951 945 60 944 927 935 929
Table 3 Experimental and calculated densities for experiments with and without AA.
From Eqs. 1 and 3 we calculate the experimental viscosity, shown in Table 4. The expected behavior is to observe an increase of the viscosity as the fraction of water decreases. In fact, the Kerdane viscosity is higher than the water viscosity. Not surprisingly, we observe this behavior for experiments with additive. It confirms the benefice of the additive in the emulsion formation. Water Cut (%) µ µ - with AA 90 4.84 3.05 80 4.85 3.76 70 5.05 5.33 60 4.82 6.54 Table 4 Experimental Viscosity.
Once the emulsion is stable and the system is cooled down to a stable temperature around 3°C , the pressure is increased until 80 bar and maintained constant. Tables 5 and 6 show a resume of the results.
Water Cut (%) Flow Rate (L/h) Average Chord Length (µm) Conversion (%) ρ 90 200 23.4 0.8 994 400 27.3 5.1 991 80 200 21.2 7.8 985 400 26.4 17.5 965 70 200 27.6 1.3 973 400 24.5 7.1 960 60 200 28 2,7 934 400 23.5 2.6 933
Table 5 Data from the experiments at the end of the crystallization without AA.
Water Cut (%) Flow Rate (L/h) Average Chord Length (µm) Conversion (%) ρ 90 200 9 1.1 986 400 9 1.0 977 80 200 10 0.0 978 400 9 0.0 965 70 200 11 1.6 953 400 10 6.5 954 60 200 12 1.3 939 400 9 4.8 933
Table 6 Data from the experiments at the end of the crystallization with AA.
Figures 6 to 9 show the evolution of the water conversion with time. We notice first that crystallization begins early and evolves faster at systems with less quantity of water (except for
experiments at 80% water). In fact, the methane is going to solubilize easier in the oil phase rather than in the water phase and crystallization can start earlier once the mixture is saturated enough. Another fact is that experiments without additive evolve to a higher conversion and, in some cases, the pipeline was plugged. This behavior was not observed in any experiment with additive. These evidence lies in the additive effect during crystallization.
Experiment without additive at 80% water cut present a behavior different from the other ones because it is the transition zone between o/w and w/o emulsion.
Figure 6 Conversion for the experiments without AA at 200L/h.
Figure 7 Conversion for the experiments without AA at 400L/h.
Figure 8 Conversion for the experiments with AA at 200L/h.
Figure 9 Conversion for the experiments with AA at 400L/h.
The FBRM probe provides chord length distributions, hereafter called CLD of the emulsion droplets and formed hydrates, shown in Figures 10 and 11. Before crystallization, it can be observed a single peak for experiments without AA. After the beginning of crystallization, the single peak increases in all experiments, and in some cases (Figure 10 c, d, e and h) a secondary peaks appears due to agglomeration. For experiment at 90% water cut and 200 l/h (Figure 10a) there are two peaks before crystallization, probably because the emulsion is water in oil in water. The peak at smaller chord length is due to droplets of oil and the peak at higher chord length is due to water in oil droplets. At 90% water cut, and higher flow rate, the CLD is composed of a single peak (Figure 10b), probably in respect of the high level of turbulence generated by the pump.
For experiments with AA shown in Figure 11, the distributions are clearly more stable because the CLD before crystallization are mostly the same for all experiments. CLD show a peak between 6 and 10 µm, with smaller droplet chord length compared with CLD without AA (Figure 10). After the beginning of crystallization for experiments at 60% and 70% water cut, and 200L/h (Figure 11 e and g), a peak in the range between 20µm and 40µm appears due to formation and agglomeration between two droplets of hydrate [8]. This peak does not appear at experiments at higher flow rate due to the turbulent regime (Figure 11 f and h.) Experiments at 80% (Figure 11 c and d) do not form hydrate (Table 6). Experiments at 90% form only around 1% of hydrate (Table 6) and the CLD peaks remain almost the same (Figure 11 a and b).
0 1 2 3 4 5 6 7 8 9 0 100 200 300 400 500 C o n v er si o n ( % ) Time (min) 90% - 200L/h 80% - 200L/h 70% - 200L/h 60% - 200L/h Plug 0 2 4 6 8 10 12 14 16 18 20 0 100 200 300 400 500 C o n v e rs io n ( % ) Time (min) 90% - 400L/h 80% - 400L/h 70% - 400L/h 60% - 400L/h Plug
Comparing experiments, the agglomeration peak of experiments with AA is not as intense as the one observed in experiments without AA, giving evidence of the benefice of the additive which acts mainly as an anti-agglomerant. (a) 90% 200 L/h (b) 90% 400 L/h (c) 80% 200 L/h (d) 80% 400 L/h (e) 70% 200 L/h (f) 70% 400 L/h (g) 60% 200 L/h (h) 60% 400 L/h Figure 10 (a) to (h) Chord Length Distribution during experiments without AA.
(a) 90% 200 L/h (b) 90% 400 L/h
(c) 80% 200 L/h (d) 80% 400 L/h
(e) 70% 200 L/h (f) 70% 400 L/h
(g) 60% 200 L/h (h) 60% 400 L/h
(a)
(b)
(c)
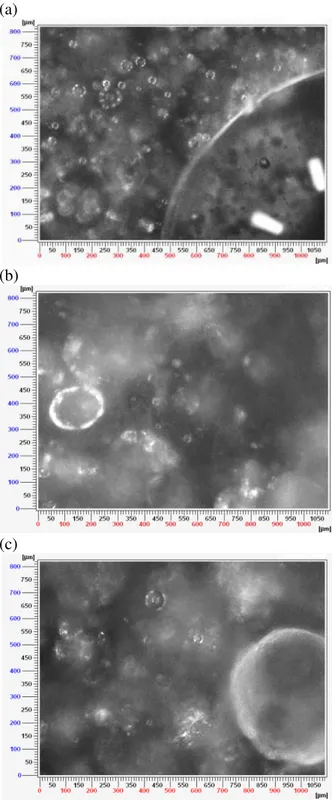
Figure 12 PVM images from the experiment with 60% water and flow rate of 200L/h: (a) initial
emulsion, (b) first hydrate crystals and (c) agglomeration.
(a)
(b)
(c)
Figure 13 PVM images from the experiment with 90% water and flow rate of 400L/h: (a) initial
emulsion, (b) first hydrate crystals and (c) agglomeration.
The images provided by the PVM probe allow observing the differences in the emulsion and crystallization with different water cut. From them we can better visualize the process of crystallization. The images show that the crystallization generally begins at the interface of the droplets. When the additive is added to the system, the droplets are smaller and it is impossible to obtain good images because of the light diffusion which gives white color to the picture. In consequence in this work, only PVM results without AA are shown.
Figures 17 and 18 show images taken with the PVM probe. Figures 17a and 18a show the emulsion before the hydrate formation, where we can easily distinguish the droplets of the dispersed phase. In both cases, the well distributed droplets, meaning a sparse packing implies that the lower oil content is dispersed better rather than the higher content water phase [9].
Figures 17b and 18b show the hydrates crystals after the beginning of the crystallization. As it has been said before, in systems with lower water cut, the hydrate formation seems to occur more intensely as we can see in Figure 17b at 60% water cut which presents more crystals and probably also an early agglomeration (observed by the opacity on the image background), when compared to Figure 18b where we see the initial formation at the droplet interface, but we still continue to observe droplets which are not converted.
In Figure 17c we can confirm the agglomeration by the opacity at the image background and we can see an entirely converted droplet. For the image 18c, as the crystallization in this system is less intense, at the end of the experiment is still possible to see droplets which are not converted. There is also some agglomeration, noticed from a pack of hydrates in the image background.
CONCLUSIONS
The first results of the parametric study realized at the Archimede flow loop are important to help the understanding of the hydrate formation in systems with high water cut. It was observed that the higher is the water cut, the more difficult to begin the crystallization because the methane dissolution rate is smaller due to the smaller oil cut.
The commercial anti-agglomerant additive tested had an effect in every step of the experiment, initially by making a more homogeneous and stable emulsion and after by preventing the agglomeration and somehow decreasing the conversion of the water into hydrate. The FBRM probe has allowed observing the difference between the two sets of experiments during the emulsification and the crystallization process, showing a more stable distribution when the additive is used and confirming less agglomeration.
The images from the PVM probe confirms our understanding of the crystallization and show a really interest on the determination of the hydrate shape during the process of crystallization from different emulsion water cuts.
REFERENCES
[1] Hill T, Johnson T, Nicol HV. Steady-state, and
interrupted, production through a deep water
black oil system. In: Seventh North American
Conference on Multiphase Technology. Canada. 2010.
[2] Joshi SV, Grasso GA, Lafond PG, Rao I, Webb E, Zerpa LE, Sloan ED, Koh CA, Sum AK.
Experimental flow loop investigations of gas
hydrate formation in high water cut systems.
Chemical Engineering Science, vol. 97. 2013. p. 198-209.
[3] Pic JS, Herri JM, Cournil M. Experimental
influence of kinetic inhibitors on methane hydrate
particle size distribution during batch
crystallization in water. Canadian Journal of
Chemical Engineering, vol. 79. 2001. p. 374-383. [4] Balakin BV, Hoffmann AC, Kosinski P, Hoiland S. Turbulent Flow of Hydrates in a
Pipeline of Complex Configuration. Chemical
Engineering Science, vol. 65. 2010. p. 5007 – 5017.
[5] Mettler-Toledo Lasentec® Product Group.
Lasentec® D600 Hardware Manual.
Mettler-Toledo AutoChem, Inc., Redmond, WA. 2001. [6] Mettler-Toledo Lasentec® Product Group.
PVM® V819 Hardware Manual. Mettler-Toledo
AutoChem, Inc., Redmond, WA. 2011.
[7] White FM. Fluid Mechanics, 4th ed. New York: McGraw Hill Book Company, 1998.
[8] Leba H, Cameirao A, Herri JM, Darbouret M, Peytavy JL, Glenat P. Chord length distributions
measurements during crystallization and
emulsion: Simulation and experimentation. Chemical Engineering Science, vol. 65. 2010. p. 1185-1200.
[9] Greaves D, Boxall J, Mullingan J, Sloan ED, Koh CA. Hydrate Formation from High Water
Content-Crude Oil Emulsions. Chemical
Engineering Science, vol. 63. 2008. p. 4570-4579.
ACKNOWLEDGEMENTS
The authors would like to acknowledge TOTAL S. A. for the financial support in the framework of the project ARCHIMEDE-3.We also would like to thank the technical support provided by the members of TOTAL and the Gas Hydrate Dynamics Centre team at EMSE which allowed the development of this project.