HAL Id: tel-02391662
https://tel.archives-ouvertes.fr/tel-02391662
Submitted on 3 Dec 2019HAL is a multi-disciplinary open access archive for the deposit and dissemination of sci-entific research documents, whether they are pub-lished or not. The documents may come from teaching and research institutions in France or abroad, or from public or private research centers.
L’archive ouverte pluridisciplinaire HAL, est destinée au dépôt et à la diffusion de documents scientifiques de niveau recherche, publiés ou non, émanant des établissements d’enseignement et de recherche français ou étrangers, des laboratoires publics ou privés.
Automatic segmentation of the cortical surface in
neonatal brain MRI
Carlos Tor Diez
To cite this version:
Carlos Tor Diez. Automatic segmentation of the cortical surface in neonatal brain MRI. Medical Imag-ing. Ecole nationale supérieure Mines-Télécom Atlantique, 2019. English. �NNT : 2019IMTA0152�. �tel-02391662�
T
HESE DE DOCTORAT DE
L
’É
COLEN
ATIONALES
UPERIEUREM
INES-T
ELECOMA
TLANTIQUEB
RETAGNEP
AYS DE LAL
OIRE-
IMT
A
TLANTIQUEC
OMUEU
NIVERSITEB
RETAGNEL
OIRE ECOLE DOCTORALE N°601Mathématiques et Sciences et Technologies de l'Information et de la Communication Spécialité : Signal, Image, Vision
Par
Carlos TOR DÍEZ
Segmentation automatique de la surface corticale dans des IRM
cérébrales de nouveau-nés
Thèse présentée et soutenue à Brest, le 23/09/2019 Unité de recherche : LaTIM INSERMU1101
Thèse N° : 2019IMTA0152
Rapporteurs avant soutenance :
Miguel Angel GONZÁLEZ BALLESTER Professeur, Universitat Pompeu Fabra
Grégoire MALANDAIN Directeur de recherche, INRIA
Composition du Jury :
Présidente :
Isabelle BLOCH Professeure, Télécom ParisTech
Examinateurs :
Miguel Angel GONZÁLEZ BALLESTER Professeur, Universitat Pompeu Fabra
Grégoire MALANDAIN Directeur de recherche, INRIA
Meritxell BACH CUADRA Maître d’enseignement et recherche, Université de Lausanne
Elodie PUYBAREAU Maître de conférence, EPITA
Directeur de thèse :
François ROUSSEAU Professeur, IMT-Atlantique
Co-directeur de thèse :
Acknowledgements
This work was supported by the ANR MAIA project, grant ANR-15-CE23-0009 of the French National Research Agency (project MAIA, "Multiphysics image-based analy-sis for premature brain development understanding",recherche.imt-atlantique.fr/maia), INSERM and Institut Mines Télécom Atlantique (Chaire "Imagerie médicale en thérapie interventionnelle"), Fondation pour la Recherche Médicale (FRM grant DIC20161236453) and the American Memorial Hospital Foundation.
I am especially grateful to Prof. Miguel Angel González Ballester and Prof. Grégoire Malandain for reviewing this manuscript. I appreciate their interest in my work as all of their insightful comments and suggestions. It was an honor and a privilege to have in my PhD jury Prof. Isabelle Bloch, Prof. Meritxell Bach Cuadra and Dr. Elodie Puybareau. I want to make a special mention to Isabelle who was always there since my first experience in the research area. "Merci beaucoup Isabelle, tu m’as donné envie de continuer dans la recherche".
In particular, I would like to express my special thanks to my supervisors Prof. François Rousseau and Prof. Nicolas Passat. They were very patient with me and they offered their help and support when I most needed it. For both: "merci beaucoup pour votre temps et vos leçons de recherche, vous êtes les meilleurs encadrants de thèse qu’un doctorant comme moi pouvait avoir". In particular François who was more in the first line of the supervision. His effort not only in commanding my scientific vision but also in taking care of the formation of his students, doing courses adapted to the current demand, organizing reading groups between students and teachers for giving a better criteria and facilitate the scientific discussion, being near his PhD students in their code and an endless number of other activities. "Trugarez dit Fañch !".
Naturally, my travel to the research world did not start with my PhD, but 5 years ago in Paris with an internship in Télécom ParisTech. I want to say thank you to my friends and colleagues that I met in this beautiful city. On the one hand the PhD students (now, almost all are doctors) at Télécom ParisTech: Cristian (my Colombian brother), Sylvain (we did our first marathon together), Alessio (the best Italian man), Sonia (the sweetest person in the world), Hélène (crazy and the best fan of "Friday beer"), Yifan (excellent person as well as football soccer player) ... On the other hand, my Hispanic group the "Cuisiniers" mainly composed of Moni, Luis, Carmen (now doctor and mother), Laura and Cristian (again). Thank you to all of them, you make me proud of taking the decision to have an experience in Paris. And also thank you for my friends in Barcelona: Antonio, Jorge, Holmes ...
In Brest, I met a lot of people who became important for me too: Oscar, Mathieu, Julien, Mathilde, Lucas, Nathalie, Reda, Paul, Pierre, Nicolas, Ibtissem, and all the PhD students and Postdoc in the ITI department. Specially to "rugby touché" group, "les 6 de toujours" and "nounours" team. And special mention to Blanca and Amadeo, our little Spanish group in Brest. "Gracias amigos, sin vosotros Brest no hubiese sido lo mismo, sois un amor de personas y me alegro de haberos conocido".
Now I want to say thank you to my family. To my parents, who provided me a great education and encouraged me to take my own decisions, helping me in all they could. To my brother, the person that most admired in the world and who inspired me in every important moment of my life (specially to become an engineer and go abroad in order to have another experience and meet new people, so far the best decision I took). And last but not least, to Sonia, my best friend, my girlfriend and, now, my wife. The person who most deserves to be mentioned in this work. You were always near me, giving me a life out from work, avoiding to going crazy. "Sin duda, eres la persona que más merece ser mencionada en este documento: te sacrificaste mudándote a vivir conmigo en Brest. Al lado tuyo no solo he acabado siendo doctor sino que además soy más tolerante y mejor persona. Eres la mejor, t’estimo!".
Contents
Acknowledgments i
List of Figures ix
List of Tables xi
Résumé étendu xiii
Acronyms xix
Image datasets xxi
1 Introduction 1
1.1 Motivation . . . 1
1.1.1 Segmentation in Neonatal MRI: an image processing challenge . 2 1.1.2 Segmentation of cortical surface: application to surface meshing 4 1.2 Thesis overview . . . 6
1.3 Thesis organisation . . . 6
2 Multi-Atlas Segmentation Approach for Neonatal MRI 9 2.1 Introduction. . . 9
2.1.1 Overview of neonatal segmentation methods. . . 10
2.1.2 Multi-atlas segmentation . . . 11
2.1.3 Patch-Based approaches . . . 12
2.2 Analysis of label fusion. . . 14
2.2.1 Common hypotheses . . . 14
2.2.2 Existing label fusion methods . . . 16
2.2.3 Optimization of patch-weights computation . . . 17
2.3 Iterative Multi-Atlas Patch-based approach . . . 19
2.3.1 Introduction to the methodology . . . 19
2.3.2 Initialization . . . 20
2.3.3 Iterations . . . 21
2.3.4 Weighting . . . 21
2.4 Experiments. . . 22
2.4.1 Data . . . 22
2.4.2 Patch fusion analysis . . . 22
2.4.3 Test of new approach . . . 24
2.5 Discussion . . . 27
2.5.1 Evaluation of hypotheses . . . 27
Contents 3 Application of Segmentation Pipelines on Clinical Datasets 31
3.1 Introduction. . . 31
3.1.1 Clinical datasets . . . 31
3.1.2 Pipeline for cortical segmentation. . . 33
3.2 Low-Resolution Neonatal Cortex Segmentation Pipeline . . . 34
3.2.1 HR Image Estimation . . . 35
3.2.2 Cortex Segmentation . . . 35
3.3 Experiments and Results. . . 36
3.3.1 Data . . . 36
3.3.2 Evaluation . . . 41
3.3.3 Results . . . 43
3.4 Discussion . . . 43
3.5 Conclusion . . . 48
4 Topology modeling of segmentation maps 51 4.1 Introduction. . . 51
4.1.1 Topological correction . . . 52
4.1.2 Topology-preserving methods . . . 54
4.2 Multilabel, Multiscale Topological Modeling . . . 56
4.2.1 Theory of multilabel strategy . . . 56
4.2.2 Application of multilabel strategy . . . 56
4.2.3 Multiscale topological modeling . . . 57
4.3 Multilabel, Multiscale Topology-Controlled Deformation . . . 58
4.3.1 Grid refinement. . . 58
4.3.2 Simple points . . . 59
4.3.3 Metrics . . . 59
4.3.4 Initialization and optimization process . . . 60
4.4 Experiments and Results. . . 60
4.5 Discussion . . . 65
4.6 Conclusion . . . 65
5 Conclusion and Perspectives 71 5.1 Conclusion . . . 71
5.2 Perspectives . . . 72
5.2.1 Generalization of the contributions . . . 72
5.2.2 Enhancing label fusion . . . 74
5.2.3 Deep learning solutions . . . 74
5.2.4 Toward high-resolution segmentation maps . . . 75
5.2.5 Cortical thickness . . . 75
A Correction of intensity irregularities on MAIA dataset 79 A.1 Introduction. . . 79
A.2 Correction . . . 79
A.3 Results. . . 80
A.4 Conclusion . . . 82
B Segmentation of brain anatomy: application of IMAPA 85 B.1 Introduction. . . 85
B.2 Results. . . 85
Contents
C Publications 89
C.1 Articles in international journals . . . 89 C.2 Articles in international conferences proceedings . . . 89 C.3 Communication in national conference . . . 89
List of Figures
1 IRM cérébrales de nouveau-nés pondérées en T2 présentant la probléma-tique particulière de la segmentation automaprobléma-tique chez le nouveau-né. Les images de (a)-(c) présentent la variabilité entre sujets où les différences entre âges de gestation sont visibles entre (a) et (b) et les différences morphologiques entre (b) et (c), qui ont tous les deux le même âge de gestation. L’image (d) présente le problème de volume partiel au niveau de la surface corticale. . . xiv 2 Images de différents sujets recalés à une même image qui mettent en
évidence les erreurs de recalage. En haut, les IRM pondérées en T2 recalées et, en bas, leurs segmentations par recalage. . . xv 3 Visualisation d’images utilisées à des fins différentes. En haut, un exemple
d’acquisition IRM orientée recherche et, en bas, une acquisition clinique. Les images de gauche correspondent à la pondération T2 et, à droite, à la T1. . . xvi 4 Visualisation de deux coupes d’images 3D dans le plan sagittal : à gauche,
une sphère creuse; à droite, la même image après une déformation homo-topique qui s’adapte à la forme d’un cortex. . . xvii 1.1 Representation of differences in terms of shape and size in neonatal T2
weighted MRI depending on the gestational age. . . 3 1.2 Representation of inter-subject variability in neonatal T2 weighted MRI. 3 1.3 Visual representation of the differences between neonatal and adult MR
images. . . 4 1.4 Two examples of cortex segmentation from two different datasets.. . . . 5 2.1 Analysis of weights computed following Equations (2.14) and (2.21) in
four different patches. . . 23 2.2 Slices of output segmentation maps of the same subject through the
iter-ative process . . . 25 2.3 Segmentation results on a T2-weighted brain MRI (axial slice). . . 26 2.4 Zoom on a region, false positives and false negatives provided by the
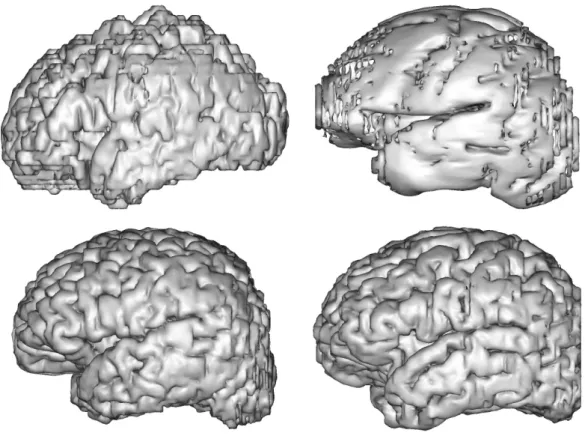
different methods. . . 28 2.5 3D visualization of mesh surfaces computed from the segmentation results
obtained with different methods. . . 29 3.1 A flowchart of the overall pipeline proposed. . . 34 3.2 Two examples of different dataset for NeoBrainS12 study. . . 38 3.3 Representation of surface meshes generated by the manual segmentations. 39 3.4 Visualization of the denoised effect on ANR MAIA dataset. . . 39 3.5 Two subjects from the ANR MAIA dataset. . . 40
List of Figures 3.6 A visual summary of the different estimations of HR input of subject
MAIA #1 and subject NeoBrainS12 #1. . . 44 3.7 A visual summary of the different estimations of segmentations using
different HR reconstruction for subjects MAIA #1 and NeoBrainS12 #1 in the LR T2w space. . . 45 3.8 A visual summary of the different estimations of segmentations using
different HR reconstruction for subjects MAIA #1 and NeoBrainS12 #1 in the HR T2w space. . . 46 3.9 A visual summary of the segmentation results for subjects MAIA #1 and
NeoBrainS12 #1 in the LR T1w space.. . . 47 3.10 Errors in manual segmentations in NeoBrainS12 at coronal 30w dataset. 49 4.1 Visualization of topological errors. . . 52 4.2 Discontinuities on cortical surface segmentation located out of a sulcus
or gyrus. . . 54 4.3 The power lattice Λ = 2L for the set of labels L = {α, β, γ} of the three
considered classes of cerebral tissues. . . 57 4.4 Topological modeling of the classes of brain tissues, at the coarse /
inter-mediate and interinter-mediate / fine scales. . . 58 4.5 Visualization of input images for the topological correction algorithm. . 62 4.6 Intermediate results obtained by the successive steps of the process for
IMAPA segmentation maps. . . 67 4.7 Intermediate results obtained by the successive steps of the process for
dHCP segmentation maps. . . 68 4.8 Surface meshes generated from Gi, i.e. the crisp classification maps of the
reference segmentation (explained in Section 4.3.3), and the final topo-logical segmentation map T . . . . 69 4.9 A comparison between monolabel vs. multilabel and monoscale vs.
mul-tiscale strategies. . . 70 5.1 Application of IMAPA in a subject of dHCP dataset for segmenting
dif-ferent brain structures. . . 73 5.2 A visual comparison between the best result of our evaluation pipeline in
terms of Dice and the GAN results.. . . 75 5.3 Preliminary result for a higher scale than the reference segmentation using
a subject from dHCP dataset. . . 76 5.4 Examples of cortical thickness map computed by two different methods. 77 A.1 Visualization of a subject from MAIA dataset in coronal and sagittal planes. 79 A.2 Visualization of the affected slices. . . 80 A.3 Cumulative histograms of each axial affected slice by the hyperintensities
and both neighbor slices.. . . 81 A.4 The intensity mean (y-axis) per axial slice (x-axis). . . 81 A.5 Result of the normalization correction by comparing its neighbor slices. 82 A.6 Result of the histogram matching correction by comparing its neighbor
slices. . . 83 A.7 Visualization of the original and corrected data in coronal and sagittal
List of Figures
B.1 Representation of surface meshes generated using reference segmentation and IMAPA results. . . 86 B.2 Overall application of IMAPA to a subject from dHCP dataset. . . 87
List of Tables
2.1 Performances of IMAPA, compared to three other segmentation methods (NLM, JLF, MANTIS) applied on 10 subjects, with a learning dataset of 30 subjects. . . 27 3.1 Details of neonatal and fetal datasets used for testing and validating brain
segmentation. . . 32 3.2 Dice scores (%) for the 12 combinations of upsampling and segmentation
methods on MAIA and NeoBrainS12 testing datasets. . . 42 4.1 Meta-parameters for the successive steps of the process. . . 63 4.2 Dice scores of the reference input reference segmentations F and the result
T for each label (GM, WM and CSF). . . . 63 4.3 Betti numbers (b0, b1 and b2) at the end of a step depending on the
topological model chosen. . . 64 B.1 Dice scores of the reference input segmentations F and the result T for
Résumé étendu
L’analyse et la modélisation d’images sont devenues des domaines prépondérants pour le développement de méthodes et d’outils impliqués dans de nombreux domaines tels que la géographie, l’astronomie ou la médecine. Au demeurant, l’imagerie médicale a permis, au cours des dernières décennies, d’accroître considérablement la compréhen-sion fonctionnelle et anatomique du corps humain in-vivo. Dans ce contexte, l’usage de méthodes d’analyse d’images a participé à l’obtention de résultats que n’auraient pas permis la seule imagerie médicale.
Un exemple permettant de mettre en contexte les problématiques cliniques liées à l’imagerie médicale est le cas des enfants prématurés. En France, ils constituent 6% des naissances. Parmi eux, 55.000 par an sont de grands prématurés nés après moins de 36 semaines d’aménorrhée. Différentes études attestent que la moitié des grands prématurés présenteront des troubles cognitifs, moteurs et comportementaux. Il existe donc un besoin réel d’améliorer la prise en charge des enfants prématurés, en améliorant l’étude du développement cérébral humain.
Cette thèse se focalise sur une solution basée sur l’Imagerie par Résonance Ma-gnétique (IRM), capable de produire des données morphologiques 3D. Ses propriétés non-invasives et non-ionisantes sont notamment bien adaptées à l’acquisition d’images du cerveau néonatal. Parmi les différentes techniques de traitement d’image, la segmen-tation permet d’extraire des informations quantitatives et/ou qualitatives sur différentes structures anatomiques, par exemple leur volume ou leur forme. La segmentation est une opération quasi-impossible à mener manuellement, dans le cas du traitement de plusieurs sujets ou de cohortes d’images, du fait du coût extrêmement élevé en temps nécessaire à un opérateur humain. Sous ces hypothèses, automatiser la segmentation s’avère cru-cial. Néanmoins, une telle automatisation fiable de la segmentation constitue un défi en traitement d’images.
En effet, la segmentation automatique des IRM cérébrales n’est pas un sujet nouveau. Depuis plusieurs décennies, de nombreux algorithmes performants ont été développés pour la segmentation cérébrale, principalement chez l’adulte. Cependant, ces succès chez les sujets et patients adultes ne se transposent pas directement dans le cas des nouveau-nés. À des problématiques liées à la difficulté d’acquérir des images 3D dans de bonnes conditions (temps d’acquisition réduits, risques de mouvements), s’ajoutent :
• des difficultés d’interprétations liées à l’immaturité de certaines structures céré-brales ; par exemple, myélinisation partielle de la substance blanche menant à des inversions de contrastes ;
• la grande variabilité inter-sujet, à cause des différents temps de gestation au mo-ment de la naissance ou les déformations physique dues, par exemple, au caractère non-rigide du crâne des nouveau-nés ;
• la taille réduite des structures d’intérêt, comme celle de la substance grise au niveau du cortex.
Résumé étendu Ces facteurs (Fig.1) vont, par exemple, se traduire dans les effets de volume partiel, liés à la résolution des images, où certains points (principalement localisés aux frontières entre différentes structures) vont présenter une intensité moyennée par les structures présentes dans les voxels.
(a) Sujet a (38 semaines de gestation) (b) Sujet b (44 semaines de gestation)
(c) Sujet c (44 semaines de gestation) (d) Zoom de la zone corticale
Figure1 – IRM cérébrales de nouveau-nés pondérées en T2 présentant la problématique particulière de la segmentation automatique chez le nouveau-né. Les images de (a)-(c) présentent la variabilité entre sujets où les différences entre âges de gestation sont visibles entre (a) et (b) et les différences morphologiques entre (b) et (c), qui ont tous les deux le même âge de gestation. L’image (d) présente le problème de volume partiel au niveau de la surface corticale.
L’analyse des structures cérébrales chez le nouveau-né peut s’avérer déterminante. En effet, les résultats d’une telle analyse peuvent être utilisés comme biomarqueurs de lésions quantitatives (un défaut de croissance est susceptible d’être mis en lien avec des troubles cognitifs), pour l’évaluation des effets neuroprotecteurs des essais théra-peutiques utilisés en néonatalogie (par exemple, neuroprotection par mélatonine), ou encore pour mettre en place une prise en charge rééducative personnalisée pour stimuler la plasticité cérébrale. Parmi ces structures, le cortex, qui se caractérise par une faible épaisseur, demeure difficile à segmenter dans les images IRM de nouveau-nés, mais fait néanmoins partie des structures d’intérêt crucial [Kim et al., 2016].
Figure2 – Images de différents sujets recalés à une même image qui mettent en évidence les erreurs de recalage. En haut, les IRM pondérées en T2 recalées et, en bas, leurs segmentations par recalage.
L’objectif de cette thèse est de proposer une méthode de segmentation automatique pour la surface corticale dans des IRM de nouveau-nés. De plus, les résultats de seg-mentation devront atteindre un niveau de qualité suffisant pour pouvoir être traités de manière subséquente par une autre technique d’analyse d’image et de modélisation (par exemple la génération de maillage surfacique).
Plusieurs méthodologies ont été explorées dans l’état de l’art (morphologie ma-thématique [Gui et al., 2012,Morel et al., 2016], modèles déformables [Leroy et al., 2011,Schuh et al., 2017], classification [Beare et al., 2016,Moeskops et al., 2015]). Au-delà des techniques de traitement d’images mises en jeu, l’utilisation d’approches dites multi-atlas [Makropoulos et al., 2014,Cardoso et al., 2013,Weisenfeld and Warfield, 2009,Iglesias and Sabuncu, 2015] a démontré une bonne capacité à tirer parti du maxi-mum d’information disponible à partir de bases de cas, dans un contexte où les connais-sances a priori permettent de compenser la faible qualité et la complexité des données acquises.
Suivant le schéma de l’article d’état de l’art [Iglesias and Sabuncu, 2015], les mé-thodes multi-atlas comportent trois étapes principales : (1) recalage, (2) propagation des segmentations et (3) fusion des segmentations. Cette thèse se focalise sur la troisième étape, la fusion de labels, en utilisant les atlas suivant un paradigme non-local. Ce pa-radigme utilise la notion de patch (petit fragment d’image, généralement sous forme de carré ou de cube) pour déterminer la similarité des atlas avec l’image à segmenter. Pour être robuste aux erreurs de recalage (Fig. 2), une extraction de tous les patchs, limitée par une fenêtre de recherche, est utilisée dans chaque atlas pour évaluer la similarité entre les structures observées [Rousseau et al., 2011,Coupé et al., 2011].
Résumé étendu
Figure 3 – Visualisation d’images utilisées à des fins différentes. En haut, un exemple d’acquisition IRM orientée recherche et, en bas, une acquisition clinique. Les images de gauche correspondent à la pondération T2 et, à droite, à la T1.
En général, la problématique de la segmentation cérébrale du nouveau-né dans l’état de l’art, est traitée à partir de données garantissant une certaine qualité d’image (résolu-tion quasi-isotrope, bon rapport signal sur bruit, etc.) pour simplifier la problématique. Par contre, ces données, loin d’être nombreuses, ont des spécificités bien différentes de celles utilisées dans le milieu hospitalier (Fig.3). Cette thèse évalue l’impact de l’état de l’art en segmentation automatique d’IRM cérébrale néonatale dans le contexte clinique. La plupart des méthodes développées pour la segmentation des structures anato-miques, et notamment celles dédiées au cortex cérébral, commettent des erreurs liées à la topologie des objets observés : régions isolées, connexions ou déconnexions erronées... Une manière de résoudre ce problème consiste à corriger la topologie des structures ex-traites. Pour cela, il existe principalement deux types de stratégies : une correction locale et une correction globale de la topologie. La première localise les zones conflictuelles où se situent probablement les erreurs topologiques, puis classifient ces erreurs pour ap-pliquer une correction adaptée [Shattuck and Leahy, 2001,Han et al., 2002,Sun et al., 2019]. Pour leur part, les méthodes globales visent à contrôler la topologie de l’objet binaire et être sûr de sa topologie tout au long du processus [Mangin et al., 1995,Fischl et al., 2001,Ségonne et al., 2007]. Cette thèse s’est focalisée sur les méthodes de défor-mations homotopiques basées sur la modification des points simples [Malandain et al., 1993,Bazin and Pham, 2007a,Mazo et al., 2012b]. Ce type de déformations permet de préserver une topologie initiale du début à la fin de l’application de la méthode. L’idée est d’utiliser cet outil pour faire évoluer une structure topologiquement correcte et géo-métriquement simple (ex. une sphère creuse) vers un objet final plus complexe (tel que le cortex) tout en préservant sa topologie (Fig.4).
Cette thèse est organisée de la façon suivante.
Le chapitre 2 propose un nouvel algorithme de segmentation itératif automatique basé sur les multi-atlas et les patchs. L’état de l’art en matière de segmentation céré-brale néonatale est présenté, avec un accent particulier sur les méthodes multi-atlas. Une analyse des hypothèses couramment utilisées dans la littérature est discutée, en présen-tant des expériences. Cette discussion justifie le choix de notre première contribution.
Figure 4 – Visualisation de deux coupes d’images 3D dans le plan sagittal : à gauche, une sphère creuse ; à droite, la même image après une déformation homotopique qui s’adapte à la forme d’un cortex.
Le chapitre 3 présente la problématique du traitement d’une véritable IRM clinique au lieu d’acquisitions spécifiquement conçues à des fins de recherche. Un pipeline entière-ment automatique est proposé, principaleentière-ment basé sur une combinaison de méthodes de super-résolution (SR) et d’approches multi-atlas. Différentes combinaisons de méthodes existantes sont évaluées en termes de robustesse et de performance.
Le chapitre 4 présente la nécessité de fixer une topologie spécifique aux structures anatomiques segmentées afin d’éviter des erreurs dans la segmentation. Les algorithmes de pointe utilisant la préCette thèse s’est focalisée sur les méthodes de déformations homotopiques basées sur la modification des points simples [Malandain et al., 1993,Bazin and Pham, 2007a,Mazo et al., 2012b].
servation topologique à des fins de segmentation sont discutés. Un algorithme de post-traitement est proposé pour ajouter une cohérence topologique à la surface corti-cale.
Le chapitre 5 conclut cette thèse et présente les perspectives de travaux futurs tels que la généralisation de différentes structures ou l’application à différents domaines du traitement d’images, des alternatives au pipeline de segmentation pour des IRM cliniques néonatales et des améliorations pour l’algorithme de segmentation topologique.
Acronyms
2D two-dimensional3D three-dimensional T1w T1-weighted T2w T2-weighted
MRI Magnetic Resonance Imaging MR Magnetic Resonance
CT X-ray Computed Tomography
US Ultrasounds
WM white matter
GM grey matter
CSF cerebrospinal fluid GA gestational age PVE partial volume effect SNR signal-to-noise ratio INU intensity inhomogeneity CNR contrast-to-noise ratio SR Super-Resolution LR low-resolution HR high-resolution dof degree of freedom GMM gaussian mixture model EM Expectation Maximisation NLM non-local means
N3 nonparametric nonuniform normalisation CNN convolutional neural networks
BET brain extraction tool KNN k-nearest neighbours SVM support vector machine MAS multi-atlas segmentation MRF Markov random field SAP shape-adaptive patches JLF Joint Label Fusion
LLE Locally Linear Embedding GAN generative adversarial network SPM statistical parametric mapping FWHM with the full-width-at-half-maximum
Image datasets
This thesis presents some methods and experiments concerning the neonatal brain seg-mentation that were tested and validated using different datasets. All these datasets have T2 weighted MR images, which, to the best of our knowledge, is the best modality for segmenting brain tissues in neonatal MRI. These images were endowed with a set of reference segmentation maps, which is required for performing the evaluation of image analysis algorithms.
Dataset information
In the following paragraphs, we have collected the main information of each dataset used.
• dHCP
The Developing Human Connectome Project (dHCP)1 is provides an extensive
4-dimensional dataset focused on the connectome of early life, made available by [Hughes et al., 2017]. This has the goal to enhance the understanding of the brain development discovering new patterns in anatomical and functional modes. Infants were recruited and imaged at the Evelina Neonatal Imaging Centre, Lon-don. Informed parental consent was obtained for imaging and data release, and the study was approved by the UK Health Research Authority. This large dataset was used in [Makropoulos et al., 2018] and it collects 465 subjects between 28 and 45 weeks of gestational age (GA) in several MRI-based modalities.
In this context, a part of the whole dataset is used for testing and validating our methods. This subset consists of T2-weighted and T1-weighted MRI data with the main brain tissue segmentation map (cortex, white matter, cerebrospinal fluid, ventricles, brainstem and cerebellum). All infants were born and imaged at term age (37–44 weeks of age). Imaging was carried out on 3T Philips Achieva using a dedicated neonatal imaging system which included a neonatal 32 channel phased array head coil. The infants were imaged in natural sleep. T2w and T1w images were acquired in sagittal and axial slice stacks with in-plane resolution 0.8 × 0.8 mm2 and 1.6 mm slices overlapped by 0.8 mm. Other parameters were:
12, 000/156 ms TR/TE, SENSE factor 2.11 (axial) and 2.58 (sagittal) for T2w, and 4, 795/1, 740/8.7 ms TR/TI/TE, SENSE factor 2.27 (axial) and 2.66 (sagittal) for T1w. In this thesis, a set of 40 images with a voxel size of 0.5 × 0.5 × 0.5 mm3
is considered. • MAIA
The Multiphysics image-based AnalysIs for premature brAin development under-standing (MAIA) is a project funded by the French National Research Agency
1
Image datasets (ANR) that aims to provide algorithms and methods for image / multi-signal analysis to enhance the neurodevelopement understanding. This project collaborates with Epirmex, which is focused on researching the brain abnormali-ties in brain MRI at term age and executive and linguistic functions of very preterm infant (less than 32 weeks after amenorrhea). This thesis has been provided with a large dataset of preterm MRI scans (110 subjects) acquired at term-equivalent age.
The dataset provided consists of 110 subjects with T2w and T1w images; two of them are manually segmented by an expert. Both modalities were acquired following different configurations. T2w images were acquired in sagittal and coro-nal slice with in-plane resolution of 3.0 mm. They have a anisotropic resolution 0.7 × 0.7 × 3.0 mm3 with 3000/200 ms for TR/TE respectively. However, T1w images were acquired in sagittal and axial slice with in-plane resolution of 3.0 mm. They have a anisotropic resolution 0.8 × 0.8 × 1.2 mm3 with 2200/3.2 ms for
TR/TE respectively. Manual segmentation were created using the T1w images, which have the highest resolution of both. In this thesis, the final resolution used was a 0.45 × 0.45 × 3.0 mm3 for T2w images and 0.27 × 0.27 × 1.2 mm3 for T1w
images.
• NeoBrainS12
NeoBrainS12 was a challenge proposed in MICCAI 2012 conference in Nice. The challenge consisted of segmenting different tissues of neonatal brain using three different datasets:
– Axial 40 weeks: 7 T1w and T2w images with a resolution 0.94×0.94×2.0 mm3 and 0.54 × 0.61 × 2.0 mm3 respectively. Final resolution was 0.35 × 0.35 × 2.0
mm3 for both.
– Coronal 30 weeks: 7 T1w and T2w images with a resolution 0.93 × 0.93 × 2.0 mm3 and 0.64 × 0.53 × 2.0 mm3 respectively. Final resolution was 0.34 ×
0.34 × 2.0 mm3 for both.
– Coronal 40 weeks: 5 T1w and T2w images with a resolution 0.91 × 0.78 × 1.2 mm3 and 0.89 × 0.78 × 1.2 mm3 respectively. Final resolution was 0.78 ×
0.78 × 1.2 mm3 and 0.35 × 0.35 × 1.2 mm3 for T1w and T2w respectively.
The challenge provided comparative results for each algorithm involved in the challenge. In this thesis, we used only the Axial 40w dataset, which has the highest quality in terms of segmentation maps. The available manual segmentation maps are two of them.
Dataset index
In order to find easily the datasets in this document, we provide a list of sections where they appear.
• dHCP:
– Chapter2: data for training (atlas set with 30 subjects) and testing (with 10 subjects) automatic segmentation algorithms;
– Chapter3: data for training (atlas set with 40 subjects) most of the methods of super resolution and segmentation;
– Chapter 4: data for testing the topological correction algorithm proposed; – Chapter 5: data used to illustrate the perspective;
– AppendixB: data used to segment the CSF and WM structures with IMAPA. • MAIA:
– Chapter 3: data for testing the pipeline segmentation (with 2 subjects); – Appendix A: data corrected from the intensity irregularities.
• NeoBrainS12:
1
Ch
ap
te
r
Introduction
1.1 Motivation . . . 1 1.1.1 Segmentation in Neonatal MRI: an image processing challenge . 2 1.1.2 Segmentation of cortical surface: application to surface meshing 4 1.2 Thesis overview . . . 6 1.3 Thesis organisation . . . 6Motivation
During the last centuries, humanity has been trying to understand experimentally and theoretically the human brain mechanism. This research motivated the specialisation of science in different subfields such as the modern medicine, psychology or biochemistry. Nowadays, thanks to the improvements in research and technology (e.g. medical imag-ing), we are able to answer many questions and understand most of the human brain functionalities. However, much about the brain is still a mystery, in particular in the understanding of the brain development. Many studies have proved that brain formation starts at the earliest embryonic stages, migrating neurons to the cortical surface, and creating new neurons and connections mainly before the birth [Purves and Lichtman, 1985]. Therefore, the need to explore the brain of fetus and neonatal infants is essential. In addition, there is also a crucial interest in analysing the neonatal brain to detect or prevent possible pathologies or lesions early presented. In particular, the premature newborn has a special interest for its non-well developed brain. For instance, a french study named EPIPAGE 2 [Ancel et al., 2014] argues that each year in France 55,000 infants are born prematurely (before 37 weeks of amenorrhoea). Among them, 10,000 will be extremely premature (less than 32 weeks). Current studies [Whitfield et al., 1997,Lorenz et al., 1998,Markestad et al., 2005] predict that most of them may have motor, cognitive or behavioural diseases.
The brain morphometry provides measurements and detection changes on the differ-ent subparts of the brain in order to extract relevant information that could extrapolate to an endless number of applications. This can be translated to extract relevant biomark-ers [Filipek et al., 1994] or significant differences around spatiotemporal data [Verma et al., 2005]. In clinical routine, it may provide methodologies in order to perform an aid of diagnosis, prediction of diseases or therapy. In general, studies are performed focus-ing on a specific region or structure [Makris et al., 1997,Csernansky et al., 1998,Fearfocus-ing et al., 2008] Among the brain subparts, many recent works were focused on the cortex as a region of interest for cortical connectivity [Ball et al., 2013a], cortical
develop-Chapter 1. Introduction ment [Ball et al., 2013b,Yu et al., 2016] and brain folding [Dubois et al., 2008,Lefèvre et al., 2016,Orasanu et al., 2016].
In order to study the brain morphology in-vivo, many existing modalities in medical imaging can provide a 3D visualisation and quantification such as X-ray computed to-mography (CT), ultrasounds (US) or magnetic resonance imaging (MRI). Among those modalities, MRI and US are particularly adapted to the neonatal infant, due to their non-ionizing and non-invasive properties. However, only the MRI provides enough spa-tial resolution and a low noise level in order to achieve a study properly.
Segmentation of brain MR images is one of the most prominent tasks in order to at-tempt a brain morphology analysis. The information of a segmented structure combined with some meta-data of the MRI can provide a satisfactory approximation of its volume, depending mostly on the resolution and other properties of the MRI. However, a proper manual segmentation is a tedious and time consuming task that requires an anatomical expert, typically a radiologist. Thus, making the segmentation automatically is a major research need and, eventually, clinical purpose.
Segmentation in Neonatal MRI: an image processing challenge
During the last decades, MRI brain segmentation has received considerable advancement leading to the creation of several methods, pipelines and softwares that attempt the segmentation and parcellation of the brain and its subparts with satisfactory accuracy. However, these efficient tools cannot be applied to the newborn, whom MRI properties and acquisition context modify the issue, generating a new open question in research. In order to explain this gap, we can list the following reasons:
• The inversion of the image contrast is one of the main differences between adult and neonatal MRI. This effect is produced by the maturation process of the structures such as the myelination of the white matter (WM), which generates an acceleration of the neuron connections. The maturation myelination changes the contrast week-by-week, reaching around the 9 months that the intensity levels of the cortical grey matter (GM) and the WM are practically equal [Barkovich, 2005]. The tissue continues maturating until the first two years of the infant when it reaches the intensity level profile of an adult brain.
• Neonatal brain is clearly smaller than the adult one; thus the structures of interest are thinner too. The MRI resolution is often limited around 1mm3, which is
insufficient margin between the thinnest subparts of the brain in order to be able to distinguish them. This issue is known as the partial volume effect (PVE) and it is mainly located inside the borders between structures. In those locations, some points will belong to multiple structures, leading to a weighted average of the corresponding intensity levels, which hampers the label assignation. This effect is particularly intense in the cortical surface, where the cerebrospinal fluid (CSF), the subcortical GM and the WM are in conflict [González Ballester et al., 2002]. • The neonatal brain grows and varies with a huge speed (Figure 1.1). The
vari-ability of the gestational age (GA) in infant birth, measured in weeks after the amenorrhoea, determines a specific size and shape. A study done with 78 ba-bies [Hüppi et al., 1998] states that each week the brain grows 22 cm3. Therefore,
1.1. Motivation
Figure 1.1 – Representation of differences in terms of shape and size in neonatal T2 weighted MRI depending on the gestational age. Images are constructed from 204 premature infants [Serag et al., 2012]. From left to right: extremely preterm age (28w), preterm age (33w), term age (39w) and post term age (44w).
• The smoothness of the neonatal brain or possible diseases may introduce stronger deformations on the neonatal cerebral morphology average than in adult. This significant inter-subject variability is independent to the age-specific changes. In addition, some studies show that a preterm infant with the age of a term infant present significant differences (Figure 1.2) making the shape difficult to predict even if the age of the subject is known.
Figure 1.2 – Representation of inter-subject variability in neonatal T2 weighted MRI. Images are term and preterm subjects extracted from the ALBERT dataset [Gousias et al., 2012]. First row, a term newborn (left) and a 28w born preterm acquired at the same age (right). Second row, two premature subjects at the same age (39w).
• Motion artefacts are more common in neonatal MRI than in the adult images since the newborn baby cannot follow oral instructions coming from the MRI technician in order to provide appropriate conditions for the exam. Typically, the acquisition is done after having fed the baby, during the nap, thus time acquisition has to
Chapter 1. Introduction be shorter. This fact causes a reduction in the contrast-to-noise ratio (CNR), increasing the complexity to differentiate tissues inner the brain.
• The trade-off between CNR and time acquisition of the MRI exam is also com-pensated by obtaining less slices in a specific axis. As a result, a proper resolution in one 2D plane, orthogonal to the chosen axis, is obtained for a clinical purpose. However, the anisotropic resolution of a 3D image makes difficult the segmentation task due to the loss in details in the other two planes (Figure1.3).
Figure 1.3 – First row, a clinical T2 weighted MRI from the MAIA dataset (subject S00059). It presents a strong anisotropic resolution across the coronal and sagittal planes (0.45 × 0.45 × 3 mm). Second row, an adult T1 weighted MRI from the dataset NKI-RSS-22 (subject 1). It presents an isotropic resolution (1 × 1 × 1 mm).
In addition, the common issues in adult MR images still remain in the newborn images, such as the intensity inhomogeneity / non-uniformity (INU) or noise. The INU is produced as a consequence of the radiofrequency pulse emitted to interfere the magnetic alignment of the hydrogen spins, which is not completely homogeneous inside the body. Noise in MRI can be caused by the electromagnetic noise of the body and coils receptors.
Segmentation of cortical surface: application to surface meshing
Globally, the segmentation procedure is a step followed by one or more tasks. In clinical context, these tasks are related on modeling anatomical structures that allow us to enhance our knowledge in order to propose better treatments, aid the clinician decision or predict diseases. Therefore, the success of many applications depends on the accuracy of the segmentation step.
As explained in section 1.1.1, neonatal brain MRI is challenging for automatically extracting cerebral subparts; in particular the cortex has specific factors that deserve additional emphasis. The main factors that hinder the effectiveness of the conventional image processing methods are determined by:
1.1. Motivation
• The variability of the shape and width of the cortex, e.g. due to the cortical folding. This factor hampers the use of example based methods without any preprocessing step. These approaches are commonly preceded by a registration process that likely introduces errors such as those arising from the interpolation. Another method with issues is the feature extraction approach based on a specific pattern such as Hough transform or scale-invariant feature transform (SIFT), which will be difficult to find a generic feature set in order to determine the cortex.
• The thin thickness of the cortex, where the PVE is the main liable for misclas-sification. The application of algorithms based on intensity such as histogram profile (e.g. Gaussian mixture model), mathematical morphology (e.g. watershed) or active contours will introduce several misclassified points where the PVE is located.
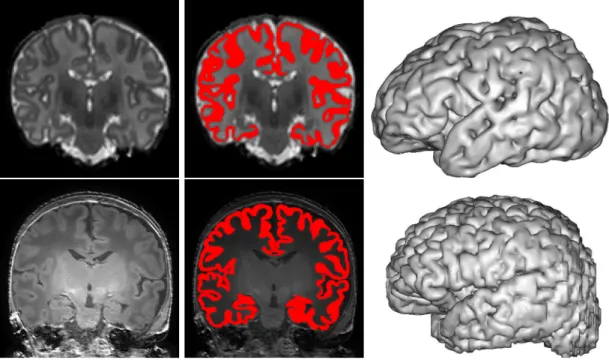
• Deformation of the whole brain as a consequence of the brain softness or a pathol-ogy. This means that there are significant differences between the appearance of each subject. As presented above, a common preprocessing step is to regis-ter one subject to another. Registration algorithm will have difficulty finding the proper deformation in order to, for example, introduce spatial priors such as in a multi-atlas method.
Figure 1.4 – Two examples of cortex segmentation from two different datasets: on top, a T2w image from ALBERT dataset and on bottom, a T1w image from MAIA dataset. From left to right: MR image, a manual segmentation of the cortex overlapping MR image and a mesh generation obtained from BrainVISA software1.
In this challenging context, one of the applications of the binary segmentation is to generate a mesh of the target brain structures, i.e. usually a 3D surface representation obtained typically with a triangular surface or tetrahedral volumes. This technique of
1
Chapter 1. Introduction computer vision provides to the clinicians a tool in order to better understand struc-tural morphology of a particular subject, locate lesions or tumours for brain surgery, or facilitate population studies.
Mostly, the mesh generation algorithms require a segmentation image with specific conditions in order to obtain a fine quality mesh. For instance, it usually helps to have the input segmentation as a closed surface. This makes challenging the mesh generation in neonatal cortical surface due to its extremely thinness which is sometimes around 2 voxels of thickness depending on the image resolution. The typical errors are the discontinuities in the segmentation or the coarse cortical foldings. This leads to undesired “holes” or “tunnels” in the mesh generation, unrealistic connections or attached cortical folding, losing details in the visualization.
Thesis overview
The aim of this thesis is to develop an efficient and robust algorithm for cortical surface adapted to the neonatal brain MRI issue. The main contributions are:
• An automatic method for cortex segmentation of a neonatal brain MRI. The al-gorithm is part of the multi-atlas segmentation family whom aim is to weight the atlas information using similarities between the target image and the atlas set. The notion of patch is used as comparison unit for computing these similari-ties [Rousseau et al., 2011,Coupé et al., 2011], which is defined as a distance. The major novelty lies in using the estimated segmentation to compute this distance as a regularisation which is introduced iteratively.
• An evaluation of the robustness of the multi-atlas methods for segmenting the cor-tex in clinical MRI. Clinical data used for this evaluation have different properties than the conventional data used for research, in particular the strong anisotropic resolution that decreases the effectiveness of 3D segmentation algorithms.
• A pipeline using a combination of a super-resolution (SR) and multi-atlas seg-mentation methods applied to the clinical neonatal brain MRI. Different existing methods of both techniques are tested in order to evaluate the performance and robustness of the proposed tool.
• A topological correction in post-processing for brain MRI segmentations. This algorithm works in multilabel taking several segmentations in binary or proba-bilistic map form as a reference segmentation. It starts with an image of labels with a desired topology. A cost function links the image of labels and the refer-ence segmentations. This cost function is iteratively optimized using a multiscale strategy. In particular for this thesis it has been studied for 3 labels: WM, cortex and CSF+background.
Thesis organisation
This thesis is organised as follows:Chapter 2 proposes new automatic iterative segmentation algorithm based on multi-atlas and patches. The state-of-the-art regarding the neonatal brain segmentation is presented, with special emphasis on the multi-atlas family methods. An analysis of the
1.3. Thesis organisation
assumptions commonly used in the literature is discussed, including experiments. This discussion leads to the creation of our first contribution.
Chapter 3 introduces the problematic of processing real clinical MRI instead of research-oriented acquisitions. A fully-automatic pipeline is proposed mainly based on a combination of super-resolution (SR) methods and multi-atlas approaches. Different combinations are evaluated in terms of robustness and performance.
Chapter 4 presents the need for fixing a specific topology to anatomical segmented structures in order to avoid errors in the segmentation. The state-of-the-art algorithms using topological preservation for segmentation purpose is discussed. A post-processing algorithm is proposed to add a topological coherence to the cortical surface.
Chapter 5 concludes this thesis and introduces perspectives for future works such as the generalisation of different structures or the application to different image processing domains such as image synthesis or high-resolution (HR) reconstruction.
2
Ch
ap
te
r
Multi-Atlas Segmentation
Approach for Neonatal MRI
2.1 Introduction. . . 9 2.1.1 Overview of neonatal segmentation methods. . . 10 2.1.2 Multi-atlas segmentation . . . 11 2.1.3 Patch-Based approaches . . . 12 2.2 Analysis of label fusion. . . 14 2.2.1 Common hypotheses . . . 14 2.2.2 Existing label fusion methods . . . 16 2.2.3 Optimization of patch-weights computation . . . 17 2.3 Iterative Multi-Atlas Patch-based approach . . . 19 2.3.1 Introduction to the methodology . . . 19 2.3.2 Initialization . . . 20 2.3.3 Iterations . . . 21 2.3.4 Weighting . . . 21 2.4 Experiments. . . 22 2.4.1 Data . . . 22 2.4.2 Patch fusion analysis . . . 22 2.4.3 Test of new approach . . . 24 2.5 Discussion . . . 27 2.5.1 Evaluation of hypotheses . . . 27 2.5.2 Comparison of methods . . . 27
Introduction
In computer vision, the segmentation is usually mistaken with the classification. Indeed, the classification is a process that grants a class to an image. The segmentation is a task that extracts an object or a region of interest form the image, providing the exact number of points (pixels for a 2D image and voxels for a 3D image) concerned. In other words, the segmentation is like classifying each point of the image, providing its membership to a class. For instance, let us suppose a picture containing a table, the classification will link the image to a class called "table" and the segmentation will provide the cloud of point belonging to the table.
The output of a segmentation process can expressed as a binary or fuzzy image. The binary output is an image that puts the high value, e.g. 1, to the target object or
Chapter 2. Multi-Atlas Segmentation Approach for Neonatal MRI region of interest and the rest to the low value, e.g. 0. However, this type of output, also called hard segmentation, does not take into account problem areas where the class membership of a point is difficult to determined. As we presented in the previous chapter, these areas can be produced by several factors that make difficult the automatic segmentation. In contrast, the fuzzy segmentation has a range of continuous values (commonly between zero and one) that provides a certain degree of class membership for each point. This kind of segmentation can be interpreted as a probabilistic map that adapts the ambiguous areas with a degree of membership.
Overview of neonatal segmentation methods
Nowadays, the wave of algorithms based on deep learning is covering every research field. Popularized by the convolutional neural networks (CNN) [LeCun et al., 1998], the emergence of big data and the outperformed score of ImageNet [Krizhevsky et al., 2012] consolidated the use of this type of methodology to computer vision and image processing. In medical imaging this tendency also took place, with an incredible amount of research papers published every year [Shen et al., 2017], creating, for instance, new specific architectures for segmentation purpose [Ronneberger et al., 2015]. Concerning the segmentation of brain MRI [Akkus et al., 2017], there are many advances in neonatal challenges, such as cortical segmentation in isointense MRI [Dolz et al., 2018,Zhang et al., 2015] or versatile algorithms robust to the subject age variability [Xu et al., 2018,Moeskops et al., 2016]. However, these techniques usually need huge datasets in order to be trained, tested and validated. In neonatal MRI, there is not a extensive data since the practice of a MRI acquisition in newborn infant is uncommon; thus MRI manually annotated by an expert are limited.
With these conditions, many other types of method were recently proposed for neona-tal brain MRI segmentation. From a technical point of view, different approaches have been explored: mathematical morphology [Gui et al., 2012,Morel et al., 2016], de-formable models [Leroy et al., 2011,Schuh et al., 2017], classification [Beare et al., 2016,Moeskops et al., 2015,Anbeek et al., 2013], patch-driven level set approaches [Wang et al., 2014], probabilistic modeling [Cardoso et al., 2013] or atlas-based approaches [Weisenfeld and Warfield, 2009,Wang et al., 2013a].
In addition to the type of segmentation (i.e. hard or fuzzy), brain segmentation can be classified in terms of the number of regions of interest provided (when it is more than one, it is usually called multilabel). Traditionally, algorithms classify the intracranial tissues in GM, WM and CSF [Xue et al., 2007,Leroy et al., 2011,Wang et al., 2013b]. Alternatively, some methods split the GM into cortical and subcortical, or the WM into myelinated and unmyelinated, or identify the ventricles, brainstem and cerebellum, extending the result to 7 or 8 classes [Gui et al., 2012,Anbeek et al., 2013]. Finally, some approaches are interested in segmenting 50 anatomical structures [Gousias et al., 2013,Makropoulos et al., 2014,Makropoulos et al., 2018].
Usually, segmentation methods need a preprocessing step in order to enhance the properties of the target image, facilitating the processing task. In the literature, the main preprocessing steps are brain extraction and intensity correction. There are several methods for brain extraction that were applied to the neonatal MRI [Serag et al., 2016, Doshi et al., 2013,Shi et al., 2012,Dai et al., 2013,Kleesiek et al., 2016,Eskildsen et al., 2012,Smith, 2002]. The brain extraction is commonly applied before tissue segmentation in order to avoid possible errors introduced by the methodology, e.g. in registration task. In contrast, the correction of MRI bias field is computed by an efficient approach
2.1. Introduction
called nonparametric nonuniform normalisation (N3) [Sled et al., 1998], which maximizes intensity distribution in a frequency space. Later, it was updated to N4 [Tustison et al., 2010], which has a later version of B-spline and a hierarchical optimization. N3 and N4 algorithms are both implemented and available in ANTs software1 [Avants et al.,
2008]. An alternative to them was introduced in [Mangin, 2000], which is focused on the minimisation of the entropy.
Multi-atlas segmentation
Among the cited techniques, the so-called atlas or multi-atlas framework [Cabezas et al., 2011,Iglesias and Sabuncu, 2015] has a relevant impact due to its performance and robustness for brain segmentation purpose. This leads to a strong trend during the last years, relying on the atlas-guided segmentation for medical imaging, in particular in neonatal brain MRI [Devi et al., 2015,Makropoulos et al., 2017]. These techniques are usually performed by registering an anatomy textbook [Miller et al., 1993] onto the image to be segmented. The main advantage of the atlas-based approaches is to provide a spatial prior (typically registered to the target image) for each region of interest that restricts the result to a more realistic anatomy.
The difference between atlas or multi-atlas varies according to the number of atlas used. Atlas-based techniques became popular in the nineties [Christensen et al., 1997, Collins et al., 1995,Lancaster et al., 1997]; they were focused on finding an efficient registration, leading to use a single atlas to simplify the registration task. More recently, the use of multiple atlas for segmentation purpose, so-called multi-atlas segmentation (MAS), is standardized due to the improvement in registration algorithms [Klein et al., 2010] and the increase in computational resources. The increase in the number of atlas enhances the robustness to strong variability in shape and size of desired structures [Doan et al., 2010].
As presented in [Iglesias and Sabuncu, 2015], there are three main steps in MAS. First, the intensity images from the atlas set are registered to the target image. This produces a transformation that maps the atlas space to the target image space. Second, the segmentation images are propagated to the target image space using the mapping obtained in the previous step. Third, the propagated segmentations are combined to obtain the target segmentation. This step is called the label fusion.
There are two types of atlases [Makropoulos et al., 2017]: the probabilistic atlas and the single-subject atlas. Probabilistic atlas is a dataset with a unique pair of images, i.e. an intensity image and a segmentation image. This pair is often the result of a pre-processing step that fuses a stack of example images with their manual segmentation. The averaged intensity image and the probabilistic segmentation map (i.e. fuzzy seg-mentation) is the result of the probabilistic atlas. Beyond the benefits of reducing atlas warping to one, the combination of these pairs was recently used [Makropoulos et al., 2014,Makropoulos et al., 2016,Schuh et al., 2015] in order to summarise a relevant fea-ture, e.g. age, disease, specific population, etc. On the other hand, the single-subject atlas is a simple pair of intensity and segmentation images from a subject. In general, the segmentation image is a hard segmentation, manually segmented by an expert, which maps each point of the intensity image to a specific class or structure.
Distinctively, MAS starts with a registration step that warps each atlas for being close in appearance to the target image, providing a mapping for each transformation. Each deformation process is made by maximizing the similarity between both images. There
1
Chapter 2. Multi-Atlas Segmentation Approach for Neonatal MRI are different kinds of deformation: linear, i.e. rigid or affine, or nonlinear depending on the strategy defined as global or local, respectively. Rigid registration uses 6 degrees of freedom (dofs), i.e. 3 for translation and 3 for rotation, being a simple method in computational terms. This approach is typically used for warp images that both input and reference come from the same subjects, e.g. for intermodality registration (i.e. T1w to T2w, etc). Affine registration has more dofs than rigid and provides finer results in order to register different subjects. As a linear transformation, whether an image has two parallel lines, after the affine warping, both lines still remain without contact. Finally, the non-rigid registration, often combined with a previous affine transformation, provides the best deformations in terms of similarity between intensity images. However, time complexity of non-rigid algorithm execution raises exponentially, creating a bottleneck issue in the MAS procedure.
Apart from the probabilistic atlas, there exit other methods that reduce the registra-tion time consuming in the MAS methods: the atlas selecregistra-tion. It consists of pre-selecting a sub-set of examples from the atlas dataset that are more similar to the target image. This similarity can be inherent to the image, e.g. intensity levels or histogram, or through metadata, such as age at acquisition, pathology or equivalent age. This reduces time consumption and regularizes the parameter learning, reducing the possibility of overfitting. Alternatively to this strategy, Roy et al. [Roy et al., 2015] avoid nonlinear registration by combining affine registration with sparse non-local approach, leading to a gain in time efficiency.
Current methods in MAS are mostly focused on the label fusion [Rousseau et al., 2011,Coupé et al., 2011,Sabuncu et al., 2010,Warfield et al., 2004,Weisenfeld and Warfield, 2009,Wang et al., 2013b,Liu et al., 2016,Benkarim et al., 2017a,Sanroma et al., 2018]. Sabuncu et al. [Sabuncu et al., 2010] introduce a generative probabilistic model that generalises label fusion methods such as local, semi-local and global weighted fusion algorithms. In [Warfield et al., 2004], Warfield et al. present their approach called simultaneous truth and performance level estimation (STAPLE). Conceived for correct-ing the manual segmentations carried out by experts, STAPLE provides an estimation of the true segmentation and a parameter of agreement between an expert segmentation and the true segmentation. This method is based on an iterative probabilistic frame-work, applying the Expectation Maximisation (EM) algorithm maximising its posterior probability. Weisenfeld et al. [Weisenfeld and Warfield, 2009] combine aligned atlases using STAPLE [Warfield et al., 2004].
Moreover, some works are focused on using the atlas set as prior in order to initialise an EM algorithm that aims to find a statistical modelling of intensity tissues, given by the GMM [Xue et al., 2007,Beare et al., 2016,Liu et al., 2016,Cardoso et al., 2013]. Among them, there are several extension such as the inclusion of a Markov Random Field (MRF) step in the EM process in order to be robust to PVE [Xue et al., 2007,Cardoso et al., 2013]. In [Cardoso et al., 2013], Cardoso et al. introduce a regularisation step in EM-MRF scheme that adapts priors. Makropoulos et al. [Makropoulos et al., 2014] add more classes to their modelling in order to separate classes with and without PVE. For those classes with PVE, knowledge-based priors are used for splitting them into the corresponding tissues.
Patch-Based approaches
In [Buades et al., 2005], Buades et al. popularised non-local approaches, publishing an efficient algorithm for image denoising. The idea of the methodology is to restore
2.1. Introduction
each point of an image finding similar points in the whole image and averaging them, contrary to the local denoising method. In order to find the relevant points for each evaluated point, the similarities are computed using a point and its neighborhood, so-called a patch. This adds contextual information that improve the robustness to the noise. Similar patches are weighted according to their degree of similarity, defined by a distance robust to a Gaussian noise. Since then, these strategies have been used to solve other cases of inverse problems. In medical image processing, they have been applied to several domains such as registration [Heinrich et al., 2012], interpolation [Manjón et al., 2010], classification [Tong et al., 2014] or segmentation [Coupé et al., 2010].
Commonly, atlas-based methods use voxel-wise strategies in order to find similarities between atlas and target image. These similarities lead to compute global or local weights in order to estimate linearly the segmentation. However, the accuracy of the estimated segmentation is sensitive to the registration process, which may introduce errors due to the inter-subject variability. In addition, this strategy is vulnerable to image noise, leading to misclassified points. Typically, those effects require a post-processing step in order to reduce the error in segmentation. Introducing non-local approaches to MAS provides a flexibility to registration errors thanks to the local search window and a noise robustness due to the use of patch.
However, the patches usually used have a square shape due to the computational simplicity. Alternatively, there are some other techniques that try to replace this default shape. Supervoxel-based approaches [Achanta et al., 2012,Huo et al., 2018] rely on splitting the image into regions with a criterion of shape and homogeneity, leading to transform the original image into small regions with different shapes. Moreover, in [Deledalle et al., 2012,Faisan et al., 2012] they vary the shape of patch according to their performance in the target image.
Concerning the MRI segmentation, the non-local approaches have been extended to the brain extraction [Dai et al., 2013], tissues segmentation [Rousseau et al., 2011] or segmentation of particular regions of interest [Coupé et al., 2010,Coupé et al., 2011]. Rousseau et al. [Rousseau et al., 2011] perform a non-local approach for brain segmen-tation. In their algorithm, they find the most similar patches from the atlas set to a given patch from the target image. These similar patches propagate their labels to the target patch and they are averaged. Asman et al. [Asman and Landman, 2012] extend STAPLE to a non-local version. Instead of assigning a global performance parameter per atlas, parameters are estimated for every patch belonging to a neighborhood for every voxel in each atlas.
There are several patch-based approaches widely applied to MAS for the brain MRI in newborn [Liu et al., 2016,Wang et al., 2013a,Wang et al., 2018] and fetus [Benkarim et al., 2019,Benkarim et al., 2017a,Sanroma et al., 2018]. For instance, Liu et al. [Liu et al., 2016] mix conventional MAS that initialise the EM with the patch-based approach, by finding the locations where the registration process is likely wrong. Wang et al. [Wang et al., 2013a] compute weights by optimizing a function that depends on the correlation between a pair of segmentation error probabilities from atlas set. Benkarim et al. [Benkarim et al., 2019] try to avoid registration errors by creating an intermediate template without any label propagation. This leads to avoid unrealistic shapes in atlas segmentations and to gain in terms of computational memory and time consuming.
A label fusion strategy combined with non-local technique may be interpret as a linear regression, as mentioned in [Awate and Whitaker, 2014], where the intensity images are the training set and the segmentation images are testing set. This explains why MAS with patch-based approaches can be inspired by other techniques, such as the
Chapter 2. Multi-Atlas Segmentation Approach for Neonatal MRI sparse coding [Timofte et al., 2013,Zhang et al., 2019], leading to mixed algorithms [Roy et al., 2015,Liao et al., 2013,Tong et al., 2015]. In this context, other methods in machine learning have been used in order to enhance the linear regression [Hao et al., 2014,Benkarim et al., 2017a,Sanroma et al., 2018]. In [Benkarim et al., 2017a], Benkarim et al. classify each patch from the target image using SVM algorithm. Sanroma et al. [Sanroma et al., 2018] initialize with Joint Label Fusion (JLF) [Wang et al., 2013a] a random forest using a mix of patches from different MRI modalities.
Analysis of label fusion
As mentioned above, the current state-of-the-art of MAS is focused on its third part, i.e. the label fusion. Moreover, some works try to limit or avoid the registration process in order to reduce time consumption and memory resources (i.e. each registration of an example from the atlas set generates three new files). The registration errors propagated to segmentations due to the effect of warping or interpolation are also questioned.
In the sequel, we provide an analysis of the common assumptions in this kind of methods in order to obtain the desired segmentation. We start formalizing the issue and methodology; then we continue giving some examples of existing methods. An analysis concludes this section focusing on an optimization framework that motivated us to implement a new multi-atlas segmentation method based on the notion of patch and the use of an atlas set. This motivation relies on finding an optimal criterion for combining the registered atlas segmentations.
Common hypotheses
Mutli-atlas sets introduce a space prior of structures to be segmented. After the regis-tration of intensity images and propagation to segmentations, all these information have to be combined in order to estimate the target segmentation. This combination requires to assume some hypotheses that are commonly used in MAS methods.
In order to formalize the issue, let E be the dataset of examples (i.e. the multi-atlas set) defined as:
E = {Ei= (Ii, Si), i = 1 . . . n} (2.1)
where it is formed by n examples where each one, Ei, is defined as the subset of one
intensity image Ii and its segmentation Si. Let I be the target image and S its
segmen-tation, which is unknown. The segmentation S can be generally expressed as:
S = f (I, E1, . . . , En) (2.2)
where f is a function that maps the segmentation S using the input image I and the example dataset E.
At that point, a first approach is to consider the assumption that f can be modelled as a linear operator. This means that the segmentation of the input S is estimated using a linear combination of the n segmentation images from the example set E.
S =
n
∑
i=1
wiSi (2.3)
where wi is the weight assigned to the example Ei. Intuitively, weights are going to


![Figure 2.5 – 3D visualization of mesh surfaces computed from the segmentation results obtained with (a) NLM, (b) JLF [Wang et al., 2013a], (c) MANTIS [Beare et al., 2016], (d) IMAPA.](https://thumb-eu.123doks.com/thumbv2/123doknet/11575483.297815/56.892.172.772.112.576/figure-visualization-surfaces-computed-segmentation-results-obtained-mantis.webp)