Université de Montréal
A new paradigm for the folding of ribonucleic acids
par Marc Parisien
Département d’informatique et de recherche opérationnelle Faculté des arts et des sciences
Thèse présentée à la Faculté des arts et des sciences en vue de l’obtention du grade de Philosophiæ Doctor (Ph.D.)
en informatique
Octobre, 2009
c
Faculté des arts et des sciences
Cette thèse intitulée:
A new paradigm for the folding of ribonucleic acids
présentée par: Marc Parisien
a été évaluée par un jury composé des personnes suivantes: Nadia El-Mabrouk président-rapporteur François Major directeur de recherche Serguei Chteinberg membre du jury Daniel Herschlag examinateur externe Nadia El-Mabrouk représentant du doyen
RÉSUMÉ
De récentes découvertes montrent le rôle important que joue l’acide ribonucléique (ARN) au sein des cellules, que ce soit le contrôle de l’expression génétique, la régula-tion de plusieurs processus homéostasiques, en plus de la transcriprégula-tion et la traducrégula-tion de l’acide désoxyribonucléique (ADN) en protéine. Si l’on veut comprendre comment la cellule fonctionne, nous devons d’abords comprendre ses composantes et comment ils interagissent, et en particulier chez l’ARN. La fonction d’une molécule est tributaire de sa structure tri-dimensionnelle (3D). Or, déterminer expérimentalement la structure 3D d’un ARN s’avère fort coûteux. Les méthodes courantes de prédiction par ordinateur de la structure d’un ARN ne tiennent compte que des appariements classiques ou cano-niques, similaires à ceux de la fameuse structure en double-hélice de l’ADN. Ici, nous avons amélioré la prédiction de structures d’ARN en tenant compte de tous les types possibles d’appariements, dont ceux dits non-canoniques. Cela est rendu possible dans le contexte d’un nouveau paradigme pour le repliement des ARN, basé sur les motifs cy-cliques de nucléotides ; des blocs de bases pour la construction des ARN. De plus, nous avons dévelopées de nouvelles métriques pour quantifier la précision des méthodes de prédiction des structures 3D des ARN, vue l’introduction récente de plusieurs de ces méthodes. Enfin, nous avons évalué le pouvoir prédictif des nouvelles techniques de sondage de basse résolution des structures d’ARN.
Mots clés : ARN, prédiction de structure, comparaison de structure, évaluation de structure, appariements non-canoniques.
Recent findings show the important role of ribonucleic acid (RNA) within the cell, be it the control of gene expression, the regulation of several homeostatic processes, in addition to the transcription and translation of deoxyribonucleic acid (DNA) into protein. If we wish to understand how the cell works, we first need to understand its components and how they interact, and in particular for RNA. The function of a molecule is tributary of its three-dimensional (3D) structure. However, experimental determination of RNA 3D structures imparts great costs. Current methods for RNA structure prediction by com-puters only take into account the classical or canonical base pairs, similar to those found in the well-celebrated DNA double helix. Here, we improved RNA structure prediction by taking into account all possible types of base pairs, even those said non-canonicals. This is made possible in the context of a new paradigm for the folding of RNA, based on nucleotide cyclic motifs (NCM): basic blocks for the construction of RNA. Further-more, we have developed new metrics to quantify the precision of RNA 3D structure prediction methods, given the recent introduction of many of those methods. Finally, we have evaluated the predictive power of the latest low-resolution RNA structure probing techniques.
Keywords: RNA, structure prediction, structure comparison, structure evalua-tion, non-canonical base pairs.
CONTENTS RÉSUMÉ . . . iii ABSTRACT . . . . iv CONTENTS . . . . v LIST OF TABLES . . . ix LIST OF FIGURES . . . . x
LIST OF ABBREVIATIONS . . . . xii
DEDICATION . . . xiii ACKNOWLEDGMENTS . . . xiv CHAPTER 1: INTRODUCTION . . . . 1 1.1 Subject introduced . . . 1 1.2 Organization of chapters . . . 3 1.2.1 Introduction . . . 3
1.2.2 The first article . . . 3
1.2.3 The second article . . . 5
1.2.4 The third article . . . 6
1.2.5 Exercises in RNA modeling . . . 7
1.2.6 The MC-Fold and MC-Sym pipeline web site . . . 7
CHAPTER 2: WHAT IS A RIBONUCLEIC ACID? . . . 9
2.1 Nucleobase, nucleotide . . . 9
2.2 Base pair . . . 9
2.3 Double helix . . . 11
2.4 Folding . . . 11
CHAPTER 3: THE NEED FOR A NEW PARADIGM . . . . 17
3.1 Problematic . . . 17
3.2 Nucleotide Cyclic Motif . . . 18
3.3 The master equation . . . 21
3.4 Existing approaches . . . 23
3.5 Further on . . . 25
CHAPTER 4: ARTICLE 1 . . . . 27
4.1 Abstract . . . 28
4.2 Introduction . . . 28
4.3 Folding single sequences . . . 30
4.4 Folding human precursor microRNAs . . . 32
4.5 Folding using probing data . . . 33
4.6 Consensus structural assignments . . . 34
4.7 Modelling HIV-1 frame-shifting element . . . 35
4.8 Discussion . . . 36
4.9 Methods summary . . . 36
4.10 Acknowledgements . . . 37
CHAPTER 5: ARTICLE 1; SUPPL. INF. . . . 42
5.1 Methods . . . 43
5.1.1 RNA-Select . . . 43
5.1.2 NCM database . . . 43
5.1.3 NCM building . . . 44
5.1.4 MC-Fold structure enumeration . . . 44
5.1.5 MC-Fold scoring function . . . 46
5.1.6 Coaxial stacking energetic contributions . . . 49
5.1.7 MC-Sym structure generation . . . 50
5.1.8 MC-Fold | MC-Sym pipeline . . . 50
5.1.9 MC-Cons . . . 51
5.1.10 RNA structure images . . . 51
5.2 Discussion . . . 51
vii CHAPTER 6: ARTICLE 2 . . . . 68 6.1 Abstract . . . 69 6.2 Introduction . . . 69 6.3 Results . . . 71 6.3.1 Deformation index . . . 71
6.3.2 Base-stacking and base-pairing interactions . . . 71
6.3.3 Interaction network fidelity . . . 72
6.3.4 Example: Modeling the rat 28S rRNA loop E 3D structure . . . 73
6.3.5 Deformation profile . . . 76
6.3.6 Example: The hammerhead ribozyme . . . 77
6.4 Discussion . . . 78
6.5 Materials and Methods . . . 80
6.5.1 Generating MC-Sym decoys . . . 80
6.5.2 RMSD . . . 81
6.5.3 Deformation profile . . . 81
6.6 Acknowledgments . . . 82
CHAPTER 7: ARTICLE 2; SUPPL. INF. . . . 92
CHAPTER 8: ARTICLE 3 . . . . 96
8.1 Abstract . . . 97
8.2 Introduction . . . 97
8.3 Results . . . 98
8.3.1 Conformational sampling . . . 98
8.3.2 Discriminative power of low-resolution experimental data . . . 99
8.4 Discussion . . . 101
8.5 Methods . . . 103
8.5.1 Sets of 3-D models . . . 103
8.5.2 Hydroxyl radical footprinting . . . 104
8.5.3 Methidiumpropyl-EDTA . . . 105
8.5.4 Multiplex hydroxyl radical cleavage analysis . . . 106
8.5.5 Small-angle X-ray scattering . . . 107
8.5.7 Model selection procedure . . . 108
8.6 Acknowledgements . . . 108
CHAPTER 9: MODELING RNA . . . 117
9.1 Apical RNA transport . . . 117
9.2 Cap-independent translation element . . . 121
CHAPTER 10: CONCLUSION . . . 124
10.1 On successes... . . 124
10.2 On failures... . . 128
10.3 On the future... . . 130
LIST OF TABLES
4.1 MC-Fold predictive power . . . 38
4.2 MC-Fold and MC-Sym pipeline predictive power . . . 39
5.1 Comparison of the predictive power of three approaches . . . 52
5.2 RNA-Select . . . 53
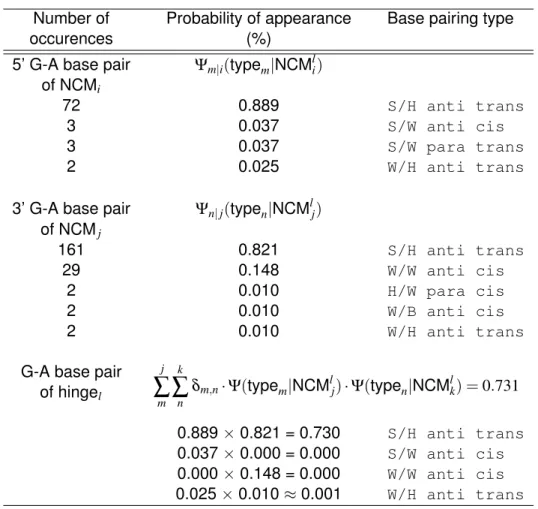
5.3 Hinge scoring . . . 54
6.1 Structural parameter values for five models of the hammerhead ribozyme 90 6.2 Intradomain and interdomain scores for all helices, loops, helix-helix, and loop-loop combinations . . . 91
8.1 Performance of experimental data for the tRNA model sets . . . 109
2.1 Ribonucleic acid . . . 10
2.2 Base pairs . . . 12
2.3 The RNA double helix . . . 13
2.4 Folding . . . 14
2.5 Primary, secondary and tertiary structures . . . 16
3.1 Minimum cycles basis . . . 19
3.2 Nucleotide cyclic motifs . . . 20
4.1 A selection of 3D structures predicted from sequence . . . 40
4.2 A selection of pre-miRNA 3D structures . . . 41
4.3 HIV-1 -1 frame-shifting-element models . . . 41
5.1 The MC-Fold | MC-Sym pipeline applied to the rRNA loop E . . . 55
5.2 MC-Fold predictions for the yeast tRNAASP . . . 56
5.3 MC-Fold predictions for the E. coli 5S rRNA . . . 56
5.4 Clustering and aligned IRE sequences . . . 57
5.5 Consensus structural assignment for yeast tRNA sequences . . . 58
5.6 MC-Cons consensus assignment for the in vivo E. coli 5S rRNA . . . 59
5.7 Unconstrained MC-Cons consensus assignment for the E. coli 5S rRNA . 60 5.8 MC-Fold predictions for the SECIS element . . . 60
5.9 The sequence variations observed in 753 HIV-1 frame-shifting elements . 61 5.10 Cycles, junctions, hinges, and base pairs . . . 62
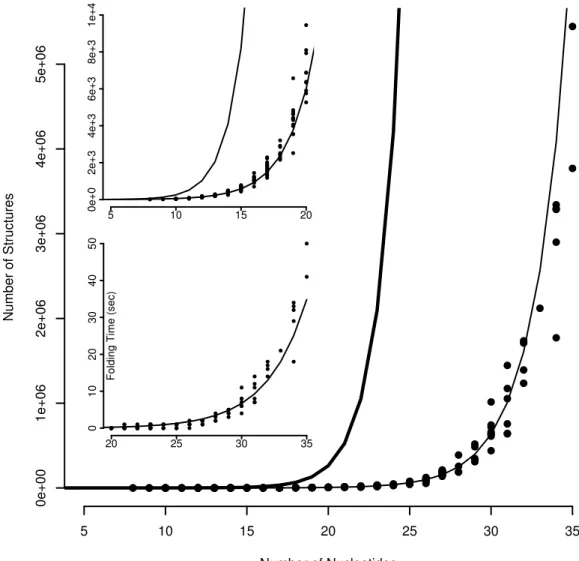
5.11 Number of structure vs. sequence lenght . . . 63
5.12 Multi-branch construction . . . 64
5.13 MC-Fold call and output . . . 65
5.14 MC-Sym input script for the IRE consensus sequence . . . 66
5.15 Header of a PDB file generated by MC-Sym . . . 67
6.1 Base-stacking and base-pairing nomenclature . . . 83
6.2 The rat 28S rRNA loop E structure . . . 84
xi
6.4 Three models of the rat 28S rRNA loop E . . . 86
6.5 Building steps of the deformation profile . . . 87
6.6 Deformation Profile between predicted model 553 and the hammerhead ribozyme crystal structure . . . 88
6.7 Same as Figure 6 but for model 633 . . . 89
7.1 Structural parameters for decoys of the Hammerhead Ribozyme . . . 93
7.2 Same as Figure 7 but for model 2698 . . . 94
7.3 Deformation score of all short (<5 nt) contiguous regions . . . 95
8.1 Conformational sampling RMSD ranges . . . 111
8.2 Performance of experimental data on tRNA . . . 112
8.3 Performance of experimental data on P4-P6 . . . 113
8.4 Reinterpretation of MPE data for tRNA . . . 114
8.5 tRNA conformational sampling . . . 115
8.6 P4-P6 conformational sampling . . . 116
9.1 Multiple-sequence alignment for the WLE3 element . . . 119
9.2 RNA structure for the WLE3 element . . . 120
9.3 RNA structure for the PTE element . . . 123
10.1 Various internal energy scoring schemes against base pair suites . . . 132
DNA DeoxyriboNucleic Acid NCM Nucleotide Cyclic Motif
NOE Nuclear Overhauser Effect NMR Nuclear Magnetic Resonance
PDB Protein Data Bank RNA RiboNucleic Acid
I dedicate this thesis to my parents, Pauline and Aurèle.
First, I would like to thank my research director, Dr. François Major, who gave me a place within his lab, and gave me a chance to become a scientist, whatever that may be. Second, I thank all those I had the occasion to exchange ideas with during my long journey. Third, all the research funding agencies: les Fonds Québéçois de la Recherche sur la Nature et les Technologies (FQRNT), the Natural Sciences and Engineering Research Council of Canada (NSERC), the Canadian Institutes of Health Research (CIHR), the department of computer science and operations research and la faculté des études supérieures of the university of Montréal, and Dr. Damien D’Amours, for their financial support. And finally, my beloved, Janice John, for her TLC.
CHAPTER 1
INTRODUCTION
1.1 Subject introduced
Ribonucleic acids (RNA) are one of the three major classes of bio-polymers within the cell, along with proteins and deoxyribonucleic acids (DNA). It is even speculated that RNA was the primary product from which life originated; hence the RNA world scenario [1, 2, 3], following the discovery of the auto-catalytic property of RNA [4, 5, 6]. A vast literature exists concerning the RNA world, so let us guide the curious reader to interesting and recent works, in particular on the origin of the genetic code and the translation machinery [7], on the evolution of the 23S molecule [8], the acquisition of functions by fortuitous ligations [9], self-sustained replication [10], and the unavoidable folding of random RNA sequences [11].
It has been long believed that RNA served only as a temporary step in the decoding of DNA into proteins, a process named transcription, as depicted in the central dogma of molecular biology, elaborated by Francis Crick [12, 13]. However, recent discoveries attribute broader and vital roles for RNA in the development and maintenance of the cell, e.g. the translation of RNA coding genes into proteins by the ribosomal complex (see for instance [14, 15, 16]), control of protein expression levels by RNA interference (see [17, 18, 19, 20, 21]), molecular recognition by aptamers and riboswitches (see [22, 23]), etc. Hence, one then speaks about non-coding RNA (for example, see [24, 25, 26, 27]), in which more than 600 families are counted for in the Rfam (RNA families) database [28, 29, 30]) (see also RNAdb [31]). The comprehension of the cell’s working will necessitate the characterization of its components, and in particular of its coding and non-coding RNAs, which defines the field of ribonomics [32, 33].
The structure of a bio-polymer is the guarantor of its function. Indeed, it suffices for the bio-polymer to position properly in 3-D space a few key chemical groups in order for
it to accomplish its function, for which it has been selected to perform. Hence, in order to study the function of a molecule, it is preferable to know its 3-D structure. The famous experience conducted by Anfinsen and colleagues demonstrated that the sequence of a bio-polymer is enough to encode the structure, and that the native structure is of minimal free energy [34]. Although this experience has been carried out using a protein, the same concepts apply also to RNA [35]. This then gives us hope to predict the 3-D structure of RNAs given their sequences only.
Structure determination can be done via high-resolution experiments, like X-ray crys-tallography (X-ray) [36] or by nuclear magnetic resonance spectroscopy (NMR) [37]. Al-though precise, these methods make use of unique equipments and specialized op-erators. It is without saying that they impart a high cost to the determination pro-cess (an estimate of a hundred thousand dollars per structure solved by X-ray). The time span needed to resolve a structure is often measured in years, while robotized, high-throughput sequencing produces thousands of sequence fragments in a few sec-onds [38]. The number of solved 3-D structures in the Protein Data Bank (PDB [39]) has been increasing only modestly in the past years [40]. Structure determination can also be done at medium- or low-resolution, by chemical or enzymatic probing [41], micro-chips [42], fluorescence [43], for instance, but they also require particular measuring instruments and a trained personnel.
That said, we will look at the role of computers for RNA 3-D structure prediction from sequence, for its ease of use and its low cost per prediction. We will also summarize the current approaches, highlighting their strengths and weaknesses. We will then propose a new paradigm in which it will be easier to go from sequence to 3D structure. This paradigm will be put to use to formulate two structural models: apical RNA transport and cap-independent translation element. We will also propose new metrics to compare two RNA models. Finally, we will discuss about the information content of recent low-resolution structure probing methods.
3
1.2 Organization of chapters
In this section we will list all chapters and their content.
1.2.1 Introduction
Chapter 2 introduces all the concepts needed to understand and appreciate the work done in this thesis. It presents what a ribonucleic acid is and its multiple representations.
1.2.2 The first article
In chapter 3 we will try to put in context what has been done in the first article, specially pressing on the need to develop a new paradigm.
Chapter 4 is the first article and the core of the thesis. It presents the MC-Fold and MC-Sym pipeline, along with MC-Cons, and applications to RNA structure predictions. This paper has been published as:
Parisien M, Major F.
The MC-Fold and MC-Sym pipeline infers RNA structure from sequence data.
Nature 2008452:51-55.
(c) 2008 Nature Publishing Group.
Since the paper has only two authors, my contribution to it is unquestionable. Be-cause of the limitations on the manuscript’s length, we also published an accompanying text, which is the subject of chapter 5. In it you will find all the details of the pipeline, including the ins and outs of the three computer programs presented, and MC-Fold’s mathematical model.
time-line. It is without saying that the year 2007 has been nerve wrecking for me, as the first drafts of the manuscript weren’t completed before seven months after Nature’s initial interest in our work. It must also be said that we previously had submitted a manuscript, which focused on MC-Fold only, to the Proceedings of the National Academy of Sci-ences of the USA. In that paper we stated that tertiary structure predictions would be easier if we started from secondary structures which featured non-canonical base pairs, predicted from MC-Fold. Unfortunately, that statement had not been followed by a good standing proof, and was therefore not accepted for publication. The creation of the pipeline followed, with a second publication attempt, now in Nature. At this point, the output of MC-Fold, that is the secondary structure, could serve as input to MC-Sym, enabling RNA 3D structure prediction from sequence.
5
1.2.3 The second article
Because many 3D prediction methods have recently been proposed [44, 45, 46, 47, 48, 49], and that their results do not always look like RNA but, rather, more like a blob of atoms, it was then necessary to develop a new measure to compare a model with the target solution structure. The de facto standard measure is the root mean squared deviation (RMSD) [50, 51], and has served well the protein structure prediction community, because in proteins it is the backbone that drives the structure [52, 53, 54], and side-chains associate less specifically than in RNA [55]. However, it is not able to pick up the minute details of nucleobase interactions (pairing and stacking) (see [56] for a discussion of the use of RMSD for RNA modeling), hence the need for a more suited deviation measure for RNA, which is the subject of chapter 6, and has been published as:
Parisien M∗, Cruz JA∗, Westhof E, Major F. New metrics for comparing and assessing discrepancies
between RNA 3D structures and models. RNA 200915:1875-1885.
(c) 2009 RNA Society. * Equal contribution.
My contribution to that paper is equal to that of Dr. Cruz; we participated to half of the figures and tables of the article. We also participated in the elaboration of the manuscript. Me and Dr. Major initiated the work here, in Montréal, so this is why I am the first author, and Dr. Major the last author. Dr. Westhof is a world-renowned RNA structure expert and crystallographer. The work in that paper should pave the way for a critical assessment in RNA structure prediction.
1.2.4 The third article
Admittedly, nuclear magnetic resonance spectroscopy (NMR) and X-ray crystallog-raphy (X-ray) are the methods of choice to resolve at the atomic level the conforma-tion of an RNA molecule. However, these methods come with great cost and compli-cated lab equipment, and apply not to all RNAs in all environments. Recently, several low-resolution RNA structure probing methods have been developed. Three of these methods are gel-based: hydroxyl radical footprinting [57], methidiumpropyl-EDTA [58], multiplexed hydroxyl radical cleavage (MOHCA) [59], and thus are accessible to any lab in the world. A more specialized experiment than X-ray, but fast and cheap, is the small-angle X-ray scattering (SAXS) [60]. All these methods provide clues on the con-formation of the RNA is solution. However, unlike NMR and X-ray, these low-resolution experiments yield structural constraints which are noisy and vague.
Given that the MC-Fold and MC-Sym pipeline approach provides all-atoms RNA models, we used it to generate sets of three-dimensional RNA structures to challenge these low-resolution data at identifying the native fold adopted by the RNA. The results of our findings are summarized in this paper and in chapter 8, which at the time of writing is under peer-review:
Parisien M, Major F.
Determining RNA three-dimensional structures using low-resolution data.
(submitted)
In that paper I identified RNA molecules which had been the subject of at least two different probing methods. I also generated the decoy sets, and measured the performance of the experimental data on these sets. I also made a first draft of the manuscript, including all figures and tables. Me and Dr. Major looked at the results and discussed them. I also made additions to our pipeline web site to accommodate these types of experimental data.
7
1.2.5 Exercises in RNA modeling
What is the use of developing tools if we don’t use them! Already, our web site has been put to use in RNA modeling by members of our lab, more specifically, in A-to-I editing recognition sites in RNA double helices [61], and in the transcription attenuation mechanism in bacteria [62]. Here, we provide two RNA modeling attempts. We start from the sequences and any other experimental evidences collected. These modeling exercises show how complicated it is to obtain sound, viable and credible RNA models, despite the RNA’s apparent simplistic folding rules (it’s not just Guanosine with Cytosine and Adenosine with Uracil). The modeling details can be found in chapter 9. These models are now in the hands of the labs that have interest in them, such that they are now currently being challenged and perfected. They should eventually find their way in molecular and structural biology studies.
1.2.6 The MC-Fold and MC-Sym pipeline web site
Part of the work I done while being a Ph.D. student is the creation and maintenance of the MC-Fold and MC-Sym pipeline web site, which can be found here:
http://www.major.iric.ca/MC-Pipeline/
The web site features the main entry points to these computer programs:
• MC-Fold; http://www.major.iric.ca/MC-Fold/ [45] • MC-Sym; http://www.major.iric.ca/MC-Sym/ [45] • MC-Cons; http://www.major.iric.ca/MC-Cons/ [45] • A dot-bracket rendering service
• An automatic MC-Sym script generator • An Interaction Network Fidelity calculator [63]
The complete web site and its use is described in details in a user’s guide, which can be found here:
CHAPTER 2
WHAT IS A RIBONUCLEIC ACID?
This chapter will describe what is a ribonucleic acid (RNA). It is mandatory for the good understanding of the rest of the thesis. We switch the avaricious reader toward the reference work of Dr. Saenger on RNA structure [64].
2.1 Nucleobase, nucleotide
A ribonucleic acid is a molecule composed of repeated fundamental units; the nu-cleobases. Nucleobases come in four types; adenine (A), cytosine (C), guanine (G) and uracil (U). Each nucleobase is attached to its sugar, a five-membered ring, via the glycosidic bond to form nucleotides. These nucleotides are linked together, in a linear fashion, by a cordon, the main chain, that runs from the 5’ end to the 3’ end. Figure 2.1 shows these different concepts.
2.2 Base pair
The ribonucleic acid chain folds on itself such that the nucleobases associate with one another through hydrogen bonds [65, 66], the base pair. The pairing of two nucle-obases is done in a specific fashion, which depends on the types of the nuclenucle-obases implicated. In order to describe these pairings, Drs. Leontis and Westhof (LW) proposed a nomenclature [67], which we adopt here. The reader should note that other nomencla-tures have been submitted, notably the one used by Saenger [64], the one from Gutell’s group [68], and a refined version of the LW by Major’s group [69].
Figures 2.2a and 2.2b show the three faces of a nucleobase that can interact with others: the Watson-Crick (W) face, the Hoogsteen (H) face, and the Sugar (S) face.
N N N 2 H N N H N O N H NH2
adenine (A) cytosine (C)
N H O N N NH NH2 O O NH N H
guanine (G) uracil (U)
(a) Nucleobases. cytosine 5’ adenine sugar nucleotide 3’ glycosidic bond main chain (b) Di-nucleotides.
Figure 2.1: Ribonucleic acid. (a) The four nucleobases; adenine (A), cytosine (C),
gua-nine (G) and uracil (U). These images come from the web site newworldencyclope-dia.org.(b) Two nucleobases with their sugars, nucleotides, linked together by the main
chain, which runs from the 5’ end to the 3’ end. The glycosidic bond attaches the nucle-obase to its sugar. Colors used indicate the atom types: white and pink, hydrogen; grey, carbon; red, oxygen; yellow, phosphate and blue, nitrogen.
Hence, to depict a base pair, it suffices to invoke the interacting faces, for example W/W. Faces are tagged in this way: the Sugar face is the one on the side of the glycosidic bond. The Hoogsteen face is opposed to the Sugar face. Finally, the Watson-Crick face is the most remote to the glycosidic bond. We invite the reader to grasp the difference between the Sugar faces of purines (adenine and guanine: figure 2.2a) and that of pyrimidines (cytosine and uracil; figure 2.2b).
The relative orientation of the two glycosidic bonds is added to the description of the base pair. The orientation is either cis or trans. Figure 2.2c shows an example of each.
Some base pairs are called canonical, following the discovery of the structure of DNA by Drs. Watson and Crick [70]; the nucleobases associate by face complementarity; guanine with cytosine, and adenine with uracil (or thymine in DNA). This unambiguous pairing scheme allows for the perfect duplication of DNA [70]. Figure 2.2d shows the Watson-Crick base pairs in RNA, which are of the type cis W/W in the LW nomenclature
11 (not all cis W/W are canonical though). Other base pairs, called non-canonicals, also exist in RNA. Many catalogs have been compiled, notably by, Lemieux and Major [69], the Fox group [71, 72], Gutell’s group [68], and Olson’s group [73].
It is interesting to mention here the concept of isosteric base pair substitution [74, 75]. Indeed, the different types of base pairs occupy respective volumes, and position the glycosidic bonds in particular manners, such that in an RNA sequence alignment, given the observed co-variations, it is possible to predict the types of base pairs [76, 77, 78]. For instance, notice the resemblance in size, and the distance between and the position of the two phosphate atoms, between the G=C and U=A base pairs in figure 2.2d. These two basepairs can be superimposed on one another at a surprizing degree of coincidence, despite their different atomic content.
2.3 Double helix
When base pairs stack on one another, for example the pair of nucleotides (i + 1, j − 1) on top of the pair (i, j), this yields a double helical structure, like the one shown in figure 2.3a. Because base pairs are asymmetric with respect to the glycosidic bonds (figure 2.3c) (i.e. no other in-plane rotations are equivalent), the double helix displays two grooves, the major and the minor, whose difference is notable when the double helix is rendered as a volume (figure 2.3b); the major groove is narrow but deep, while the minor groove is large but shallow. The RNA double helix is mostly found in the A-form (about eleven base pairs per turn) (DNA is mostly found in the B-form; 10.5 base pairs per turn, attributable to thymine) [64, 79]. Interestingly, a particular suite of base pairs and nucleotides can confer to RNA the shape of the DNA double helix [80].
2.4 Folding
The folding of the RNA on itself is a complex phenomena, subject of many studies. Grossly, the folding proceeds in two successive (overlapping) steps: the formation of
Hoogsteen
Sugar
Watson− Crick
glycosidic bond
(a) Base pair faces; purine.
Sugar Hoogsteen
Watson−Crick
glycosidic bond
(b) Base pair faces; pyrimidine.
trans
cis
(c) Relative orientation.
G=C
U=A
(d) Watson-Crick base pairs.
Figure 2.2: Base pairs. (a) The three faces of a purine (adenine or guanine), according
to the Leontis-Westhof (LW) nomenclature. The faces are Watson-Crick (W), Sugar (S) and Hoogsteen (H), all defined with respect to the glycosidic bond. (b) The three faces
of a pyrimidine (cytosine or uracil), according to the LW nomenclature. (c) The relative
orientation of the glycosidic bonds determines the cis or trans type of pairing. The upper base pair is an U=A trans W/H while the bottom base pair is an U=A cis W/W.(d) The
canonical Watson-Crick base pairs; The G=C pair (upper) and the U=A pair (lower). Hydrogen bonds are highlighted by dashed lines. The Watson-Crick base pairs are of the type cis W/W in the LW nomenclature, since their Watson-Crick faces are interacting, and the relative orientation of their glycosidic bonds are in cis. Color scheme is the same as in the previous figure.
13
(a) Mesh rendering (b) Volume rendering
major groove
minor groove
(c) Origin of grooves
Figure 2.3: The RNA double helix (PDB file 1D4R). (a) Mesh rendering of a double
helix. Nucleotides are colored in this fashion: adenine, green; cytosine, yellow; guanine, violet; uracil, red. Slanted bars indicate the double helix’ groove: thin bars for minor grooves, and thick bars for major grooves. (b) Atomic volume rendering, showing the
water accessible surface area. The electrostatic potential is displayed using a color gradient, from −5 KT/e (red) to +1 KT/e (blue). (c) Origin of the grooves. Because of
the asymmetry of base pairs with respect to the glycosidic bonds (arrows), the face on the side of the bonds is in the minor groove, the opposite face in the major groove.
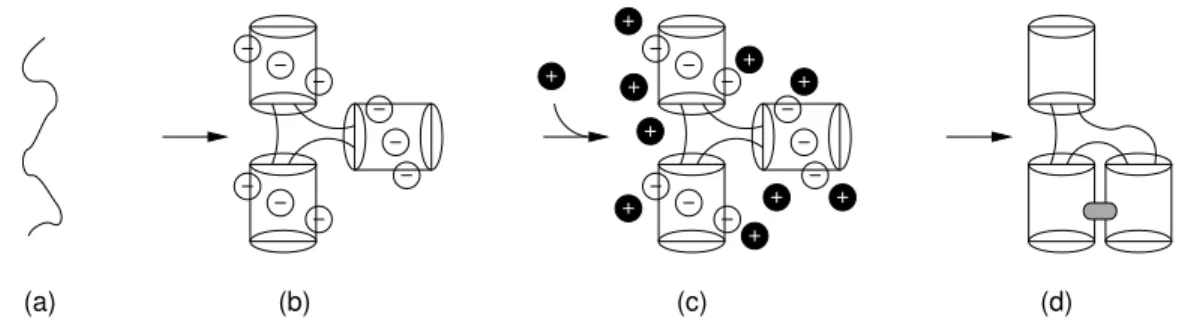
the secondary structure, i.e. the formation of the double helical stems, then the spatial organization of these double helices and their stabilization by the establishment of long-distance contacts (base pairs and/or base stacks) [81, 82]. The last phase requires the presence of positive ions (mono- and di-valent species), to counteract the negative charges on the main chain. Figure 2.4 sketches a simplified scenario for the folding of an RNA.
Many research groups have for focus the study of RNA folding, in particular the groups of Bevilacqua [83], Herschlag [84], Sosnick [85], Thirumalai [86], Tinoco [35, 87], Woodson [88], and forgive me for all others I forget! Also of intense study are the subjects of electrostatics [89, 90], water [91], specific and coordinated ionic sites [92], the ionic cloud [93] alternative folding intermediates and paths [94, 95, 96], contextual
base pair types [97, 98], to name a few.
(a) (b) (c) (d)
Figure 2.4: Folding of RNA. (a) the poly-nucleotide collapses on itself to form double
helices (tubes). (b) These double helices repel one another because of the negative
charges in the main chain. (c) The addition of positively charged ions, cations, allows
the structure to relax. (d) Formation of long range contacts which stabilize the fold, in
grey.
2.5 Primary, secondary and tertiary structures
A ribonucleic acid can be represented in many ways. In reality, the molecule is de-fined by the position (and speed) of each of its atoms, most likely in movement because of the thermal agitation; the three-dimensional (3-D) or tertiary structure. Many experi-mental methods have for goal to probe or unveil the atomic positions, in particular X-ray crystallography (electron density maps point to absolute atom positions), and nuclear magnetic resonance spectroscopy (NMR) (relative atomic positioning using the nuclear Overhauser effect (NOE) [99]), have the highest resolution of structure determination.
The sequence of nucleotides composing the molecule, the primary structure, is nowadays easily obtained at low cost, using the modest means of the electrophoresis migration theory [38, 100].
The secondary structure puts forward the organization of the sequence into double helices, and is mostly comprised of Watson-Crick base pairs. Although the secondary structure is settled early in the folding of the RNA [35], it can be called to change dur-ing the course of folddur-ing [101, 102, 103], or in the presence/absence of a ligand for
15 riboswitches [22, 23]. This representation seems to be the panacea of RNA structure prediction because of its symbolic nature (the four nucleobase types) and the yes/no state of their base pairing status (sequence of length N yields a N2Boolean grid), at the
contrary of the 3-D structure in which each atomic position must be given in a numeric form (a sequence of length N, with approximately 30 atoms per nucleotide, yields an N×30 × R3list).
In most theoretical studies, the secondary structure is considered to be a simple graph. That is, suppose the base pairs (i, j) and (k, l). Then, if we have k ≤ j, we also enforce that i ≤ k ≤ l ≤ j [104]. This restrictive definition is useful only to simplify the algorithms of secondary structure prediction methods (for example Mfold [105]), or to extract a few properties (for example see [106, 107]). In reality, RNA structures often contain pseudo-knots [108] (which a 97% majority are of the H-type [109]), hence giving way to non-simple, secondary structure graphs.
The tertiary structure can therefore be seen as the spatial disposition of the sec-ondary structure (the double helices in 3-D space). Figure 2.5 shows these different levels of RNA structure representation. For the tRNA fold, the tertiary structure is stabi-lized by base triples [110] and long-range base pairs [111]. As much as 25% of the base pairing energy is attributable to tertiary pairing in the tRNA [110], explaining in part why tRNA sequences are elusive to accurate secondary structure prediction, and calls for a more expressive system for symbolic RNA structure representation and computation (as in [112] for example). Other tertiary structure stabilization schemes can be found, like the ribose zipper [113], the A-minor motif [114], tetraloop-helix [115, 116], kissing loops, etc (higher order structure [117, 118, 119]). (see [120] for a recent survey of these motifs).
Local folds in tertiary structures also participate in the stabilization of the molecule [121, 122, 123]: kink-turn [124], U-turn [125], A-platform [126], UNCG tetraloop [127], GNRA and CUYG tetraloops [128], lonepair triploop (including the T-loop) [129, 130, 131], he-lical coaxial stacking [132, 133], etc. and are amenable to prediction from sequence (see, for instance [77, 134, 135]).
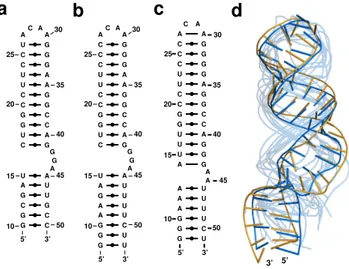
G C G G A 5 U U U A G C U C A G 15 U U G G G 20 A G A G C 25 G C C A G 30 A C U G A 35 A G A U C 40 U G G A G 45 G U C C U 50 G U G U U 55 C G A U C 60 C A C A G A A U U C 70 G C A Acceptor T D Anticodon 5’ 3’ (a) Pr imar y and secondar y str uctures . T D 5’ 3’ Anticodon Acceptor (b) T er tiar y str ucture . Figure 2.5: Pr imar y, secondar y and ter tiar y str uctures of RNA. The chosen molecule is the Y east phen ylalanine tr ansp or t RNA (tRNA-phe) (PDB code 4TRA). (a) The pr imar y str ucture is the suite of n ucleotides compr ising the molecule , which proceeds from the 5’ to the 3’ end, commonly called the sequence . Here , the sequence w ould be 5’-GCGGA...GCA-3’. The secondar y str ucture puts forw ard the organization of the sequence into doub le helices , here sho wn wit h dotted thic k bars for the canonical base pairs (W atson-Cr ic k), an d with contin u ous th in lines for non-canonica l base pairs (f or e xample the n ucleotides 26-44). The dashed thin lines highlight base tr iples (f or e xample 9-12-23), and long-r ange base pairs (f or e xample , 18-55). F or tRNA, its secondar y str ucture adopts the famous clo v er leaf shape , giv en these four doub le helices: Acceptor , D , T and Anticodon . (b) The three-dimensional (3-D) or ter tiar y str ucture , from the atomic coordinates . The cordon indicates the main chain. The n ucleobases are rendered thic k er . The spatial organization of the four d oub le helices is sho wn; the Anticodon and the D ar ms are juxtaposed, just lik e the T and Acceptor ar ms . This arr angement giv es the tRNA str ucture an L-shape .
CHAPTER 3
THE NEED FOR A NEW PARADIGM
In this chapter we will position the work done here with respect to current knowledge. We will discuss the problematic of RNA structure prediction and present existing approaches that tackle this problem. We will also state the thesis.
3.1 Problematic
The RNA folding problem [35, 136, 137], the specialized version of the more general bio-polymer folding problem, is enunciated as this: predict the tertiary structure from the primary structure. This folding problem still stands despite decades of research (early computational studies, see [138, 139]), our access to immense computational power (the Guinness world record holder folding@home project [140]), or our keenness at attacking the problem (consider these recent attempts [45, 54]). The core of the prob-lem lies in the Levinthal paradox: how does a bio-polymer fold in a biologically relevant time scale when the conformational search space seems unbounded [141, 142]. Even though the folding of a bio-polymer is known to be hierarchical [35, 141], the conforma-tional search space still remains large, even in a reduced representation [47, 143, 144]. The problem also lies in the delicate balance of the forces acting upon folding [145], and for RNA, the contribution of water and the ionic cloud [146, 147, 148].
We already exposed the urgent need to solve this problem, as sequences are pro-duced at the genomic scale, while 3-D structures are solved one-at-a-time, notwith-standing the protein structure initiative project (http://www.nigms.nih.gov/Initiatives/PSI) and the Critical Assessment of Techniques for Protein Structure Prediction (CASP) (http://predictioncenter.org/), which have no equivalent in the RNA field yet. Structure prediction is useful, particularly because of its broad impact on humanity (functional inference to drug screening) [149].
Classical secondary structures, i.e. secondary structures deprived of helical, non-canonical base pairs, are often too underdetermined to efficiently provide a projection for tertiary structures, leading to a gap in RNA structure prediction [150]. As a mat-ter of fact, non-canonical base pairs provide stabilizing energy to the final fold (see, for instance [110, 151, 152, 153]), as well as restrict the conformational search space by reducing the degrees of freedom of base paired nucleotides. The consideration of non-canonical base pairs in an RNA structure prediction method is assuredly a wel-comed feature. Indeed, non-canonical base pairs are found throughout solved RNA structures [154], and often participate in small, recurrent motifs [121, 123].
3.2 Nucleotide Cyclic Motif
With the ever increasing number of solved RNA 3-D structures in the PDB, the notion that RNA is effectively built from small recurring blocks gains appeal [121, 122, 123, 155, 156]. Indeed, recent advances in structural annotations [56, 69, 157], combined to the mathematical analysis offered by graph-centered algorithms [156, 158], and applied to large ribosomal RNA structures (the 30S [159] and the 50S [160]), confirm this modular view of RNA architecture, and forecast its many potent applications [161, 162, 163].
The use of 3-D fragments from the PDB is not new, and perhaps the most eloquent example of such use is made in the computer program ROSETTA [164, 165, 166, 167], which enables atomic precision 3-D structure prediction of proteins from sequence [168]. And, for the RNA counterpart: FARNA [44]. The idea behind the fragment assembly scheme is that local van der Waals and electrostatic interactions are implicitly captured in these 3-D fragments, hence the imprint of the sequence on the 3-D structure [169, 170, 171].
Hornton’s algorithm applied to graphs of structural annotations of RNA 3-D struc-tures gives a basis of shortest cycles composing the graphs [156, 158], as shown in Figure 3.1. These shortest cycles can then be viewed as the fundamental building blocks of RNA structure. It has been found that too many types of these cycles occur, such that their subsequent use for structure prediction is prohibitive (Major F, personal
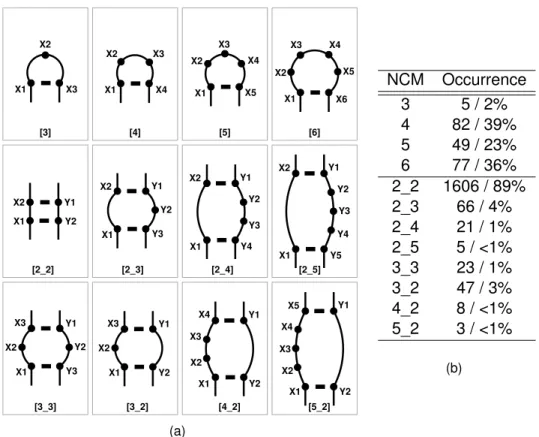
19 communication). An astute downsize of the cycle’s types entails the nucleotide cyclic motifs (NCM [45]), as in Figure 3.2, by abstracting base pair types and neglecting base stacking interactions. NCMs are recurrent, compact, generally composed of few nu-cleotides, sometimes recognized as motifs, and captures base pair isostericity. NCMs are single- and double-stranded motifs that can be welded together as suites to form complete hairpins (see Figure 5.10). Then, the RNA structure is simply an assembly of these hairpins. (a) G C C C G C G C G G G C G A G A A A U A G G G C C U 2255 2275 2265 (b) (c)
Figure 3.1: Minimum cycles basis. (a) 3-D structure of hairpin 2255-2280 of PDB file
1FFK, colored from blue at the 5’-end to red at the 3’-end. (b) Its graph of relations,
where thick lines represent base pairs. Accounted relations are backbone connectivity, base pairing and base stacking. (c) Its corresponding basis of minimum cycles. A total
of twelve cycles are highlighted in shaded areas.
Here, we capitalize on the hierarchical nature of the RNA folding process in a divide-and-conquer manner; from the primary structure predict the secondary structure (the MC-Fold computer program), then, from the secondary structure, predict the tertiary structure (the MC-Sym computer program). Both prediction steps are unified under a single and simple model which makes use of a first order object, the nucleotide cyclic motif (compare NCM Fusion 1 and NCM Fusion 2 in Figure 5.1). Our thesis is that the Protein Data Bank currently holds enough information on NCMs, such that statistics on them are able, in return, to predict the native state of an RNA sequence. Further-more, NCMs ease the prediction of base pair types in 3-D modeling through the NCM
X1 X2 X3 X4 X3 X2 X1 X3 X4 X2 X1 X5 X5 X1 X2 X3 X4 X6 X2 Y1 X1 Y2 X1 Y3 Y1 Y2 X2 X1 Y1 Y2 Y3 Y4 X2 Y1 Y5 Y4 Y2 X2 X1 Y3 X1 Y1 X3 X2 Y2 X1 Y3 Y1 X3 Y2 X2 X4 X3 X2 X1 Y1 Y2 Y1 X4 X5 X1 X2 X3 Y2 [5_2] [4_2] [3_2] [3_3] [2_2] [2_3] [2_4] [2_5] [3] [4] [5] [6] (a) NCM Occurrence 3 5 / 2% 4 82 / 39% 5 49 / 23% 6 77 / 36% 2_2 1606 / 89% 2_3 66 / 4% 2_4 21 / 1% 2_5 5 / <1% 3_3 23 / 1% 3_2 47 / 3% 4_2 8 / <1% 5_2 3 / <1% (b)
Figure 3.2: Nucleotide cyclic motifs (NCM). (a) Shown are those that occur most
fre-quently in the PDB. Dots represent nucleotides, thick lines base pairs, and thin lines nucleotide backbone connectivity. Top row displays single-stranded NCMs, while bot-tom rows double-stranded NCMs.(b) Occurrences of the various NCMs.
reconciliation process (depicted in Table 5.3).
NCMs enable a new paradigm in which the contributions of all base pair types are counted for, and not just the canonical ones. Furthermore, the two-stranded versions of NCMs are efficient to model RNA double helical stems, in contrast with a single-stranded fragment merging approach, like FARNA [44], which requires large computa-tional resources [59]. NCMs effectively bridges the gap in RNA structure prediction (to follow comments in [150]). Chapters 4 and 5 discuss in details this new paradigm and its power.
21
3.3 The master equation
Having identified the Nucleotide Cyclic Motif (NCM) as a first order object for RNA folding, we now seek to devise a mathematical model which would have a predictive value following an analysis of these NCMs from a structural database. We stress here that it is only a model, and many others could be put forth based on the same objects.
Unquestionably, one would like to obtain the simplest model (to abide to the principle of Occam’s razor). However, there are no known algorithm to obtain such a model, and we are therefore left with our human intuition (and I would even say “inspiration”). Without a doubt, in order to devise a model for RNA folding, one has to first inspect RNA 3D structures, and that on many planes of representations (cartoons, balls-and-sticks, molecular envelopes, base pairs, base stacks, graphs of tertiary interactions, etc). Only then one can recognize what is like (and what is unlike) an RNA structure.
We have decided to sketch a pseudo-potential energy function, or scoring function, based on statistics extracted from the Protein Data Bank. The main idea here is that if Nature uses some NCMs more often than expected, then one reasonable assumption would be to attribute the use of these NCMs to their thermodynamic stability. We start with the well-celebrated Boltzmann equation:
Φ(structure|sequence) = −RT · ln Ψ(structure|sequence)
where Ψ(structure|sequence) is the probability of observing the structure given a se-quence. This equation allows us to evaluate the likelyness of many alternative structures for the same given sequence, to sort them according to their scores, and to obtain the one of minimum free energy. The −RT factor is simply a coupling constant allowing to convert probabilities into energies, thus Φ(structure|sequence) represents the energy of a structure given its sequence.
To proceed further, we kindly ask the reader to refer to Figure 5.10, as it defines cy-cles, or NCMs, junctions, hinges and base pairs. We also lay down the master equation,
which is a breakdown of the previous equation into four parts: Ψ(structure|sequence) = Ψ(NCMs|sequence) | {z } I · Ψ(junctions|NCMs) | {z } II · Ψ(hinges|junctions) | {z } III · Ψ(pairs|hinges) | {z } IV
where each of the four parts will now be further discussed.
When one looks at the twelve most recurrent NCMs (Figure 3.2), the first question that comes to mind is are there sequences that prefer particular NCMs? For a fact, GNRA sequences are preferred in tetraloops (Figure 3.2, NCM type [4]), and UNCG sequences to a lesser degree. Capturing the fitness of a sequence in an NCM is the goal of part I of the master equation. Hence, given many possible decompositions of a structure into NCMs, we would like to score better those that feature the GNRA sequences into NCMs of type [4].
We now turn our attention to the suites of NCMs, where individual NCMs are welded together to form junctions (see Figure 5.10). A notable feature of RNA 3D structures is the predominant occurence of NCM type [2_2] (Figure 3.2b). Single-bulged nucleotides, as properly described by NCMs types [2_3] and [3_2], are rare (and multiple-bulged rarer). In order to quantify the many different suites of NCMs a sequence can adopt, we encoded in a Markov chain the probabilities of observing an NCM of type i followed im-mediately by another NCM of type j, defining a junction (i, j) (see Figure 5.10). Markov chains are data structures appropriate to capture the correlation of an event (here NCM types) on others. We adopt the simplest of the chains which is of order one, meaning that the probability of a junction (i, j) at NCM j only depends on the type of the previous NCM i (but could also depend on the previous two ones). This enables us to score better a structure that features many adjacent NCMs of type [2_2] against one which would be made of, say, three consecutive NCMs of type [2_3]. This is what part II of the master equation tries to encode.
23 By far the most complicated computation is the one of part III of the master equation. Simply put, it tries to guess the type of a base pair common to two consecutive NCMs, an hinge (Figure 5.10). Base pair types are those defined by Leontis and Westhof, which are described by their interacting edges. Borrowing from an analogy to analog electric circuits, consider many electrical paths from a single source to a single destination. The question here would be how the electric current would be divided between the paths given the electric properties of each path (resistance, capacitance, inductance, etc). For the problem at hand, our electrical source and destination would be two consecutive NCMs. The various electrical paths would then be the many different types of base pair that the sequence could choose from. In Figure 5.10 one could ask what type of base pair is most likely found between C13 and G17 given that they are at the hinge of NCM types i (a type [5] NCM) and j (a type [2_3] NCM). One has to consider the possible a priori types, that is, what a C=G base pair 5’ of a type [5] NCM prefers, then what a C=G base pair 3’ of a type [2_3] prefers, then check if at least one type is common which would “convey” the current. A detailed computation of a hinge is given in Table 5.3.
Finally, part IV scores the base pair, regardless of the type (taken into account in the previous term). Hence, a C=G base pair has a better score than a C=C base pair, because the latter occurs less frequently in the PDB.
Further instructions on how statistics from the Protein Data Bank are used to de-rive actual scores for each individual parts of the master equation are discussed in section 5.1.5. We feel that the master equation sums up the many aspects that are consequent of the use of Nucleotide Cyclic Motifs as first order objects for the folding of RNAs. Perhaps there are other significant phenomena that slipped by our concerns. If so, we would gladly like to be informed of these, so that they could be accounted for in a refined model.
3.4 Existing approaches
The most prominent approach to RNA structure prediction is the use of the thermo-dynamics theory in secondary structure prediction. Its main concern is the evaluation of
the folding free energy, as the RNA collapses on itself to attain its native fold. The latest model which encompasses this view is the INN-HB model (Individual Nearest Neighbor - Hydrogen Bond) [172]. Computer programs that use this model are Mfold [105, 173], Sfold [174, 175, 176], RNAfold [177, 178], RNAsubopt [179], and RNAstructure [180], to name the most widely known programs. Addition of the persistence length concept has been figured out [181, 182]. Even though this model seems the most promising because of its physico-chemical formulation, the thermodynamics data amassed since the 70’(for example [183]) is still not enough to nail an RNA fold from the sequence [137, 184, 185], even by using structure probing data [180]. This is due to the fact that the contribution of non-canonical base pairs is only counted for single mismatches, (which we tried to ad-dress in this work), and because of the under-characterization of hairpin heads (which we also address, although in the thermodynamics paradigm some heads seem more stable than the model predicts [186]) and multi-branched loops (too many possibilities to address, even though some groups have tackled them, see [187, 188]), which are often extrapolated from a few data points. McCaskill’s algorithm allows for an estimate of a base pair probability [189]. An iterative optimization method that combines both exper-imental and knowledge-based data supersedes the Turner99 thermodynamics model and thus now serves as the state-of-the-art RNA secondary structure prediction [190].
The enumeration of secondary structures has been proved to belong to the NP-complete time-complexity class of problems, when considering general-case models of pseudoknots [191]. For secondary structures without pseudoknots, obtaining the minimum free energy structure, by filling up a dynamic programming table, takes time O(N3), for a sequence of length N [105, 192]. Approximations on pseudoknots can cut the computation time to O(N6) [193], or even O(N5) or O(N4) on simpler pseudoknots ([191, 194], respectively). For pseudoknot-free secondary structures, an upper bound of O(Ψ(N) · N2), where Ψ(N) is almost constant, has recently been proposed [195]. Given that the MFE structure may not be the native fold, and thus sub-optimal struc-tures have to be enumerated (by backtracking in exponential time), further optimiza-tions to obtain the MFE may appear obsolete (see [196, 197] for recent developments). Sub-optimal structure enumeration have been proposed by Zuker [198] (which uses a distance criterion that ensures the generation of non-related structures), and by
Schus-25 ter’s group [179] (systematic and exhaustive enumeration). The later implements the Waterman-Byers algorithm [199, 200]. At this point, we wish to point the reader to these excellent reviews in RNA secondary structure prediction: [201, 202]. For RNA struc-ture prediction from multiple-sequence analysis, we suggest the thorough review of Drs. Gardner and Giegerich [203].
Knowledge-based approaches have also been devised, notably MC-Fold [45] (this work), CONTRAfold [204], a remake of the thermodynamics table for threading [205] or enhanced prediction [206], and structure refinement [207]. Attempts to concoct physico-chemical approaches to the RNA folding problem in 3-D have also been made, notice-ably by Cao and Chen [144], and by Dokholyan’s group [47]. Of interest, intermediate folding during transcription (due to pausing [102]) is considered in the kinwalker com-puter program [103].
It is not at all clear what is the best approach for RNA structure prediction. On one hand, secondary structure prediction is really fast for hundreds or thousands nu-cleotides, compared to all-atoms simulated folding (the Folding@home cluster, a world-wide network of about 250,000 active CPUs, has been used for the study of a twelve
nucleotides hairpin [208]!). However, the former lacks the excluded volume effects, such that predicting structures with pseudoknots is a tricky business, often resulting in phys-ically impossible folds. Coarse-grained nucleotide representation (like [47, 48, 144]) allows for faster RNA collapse, but they still rely heavily on the secondary structure, and thus are not fully ab initio. The RNA folding landscape has been proved quite com-plex for even a small hairpin [86, 209, 210], with multiple-paths for larger RNA struc-tures [84, 96]. Chen highlights the complicated nature of RNA folding and what still needs to be done [147].
3.5 Further on
Although the new RNA folding paradigm has been enunciated and detailed, we pur-sued further along the path of RNA structure prediction, and the next studies can be also viewed as part of the new paradigm.
Because RNA side chains interact in highly specific manners (via hydrogen bonds), we sought to improve the RNA structure prediction field by shifting the measure of mod-eling success toward a distance metric which takes into account the specificity of RNA base pair interactions. The RMSD has been shown to be a deficient measure of base interaction reproducibility [56] and modeling success [63], at least for RNA, despite its ubiquitous usage in the sister protein folding field. Symbolic annotations of the interac-tions between nucleobases can instead be used to compare a 3D model with the solu-tion structure. Hence, it suffice to reproduce the interacsolu-tions within the solusolu-tion structure to declare that the model is correct, and not necessarily obtain low RMSD values. Dis-crepancies between the model and the reference structure can also be scrutinized by comparing the differences in the annotations. Since the introduction of this new dis-tance metric we realized that much needs to be done in order to produce credible RNA 3D models, despite our recent advances in treating non-canonical base pairs.
The RNA folding paradigm has also been extended to accommodate new RNA struc-ture probing methods and their data. Hence, RNA models produced using our MC-Fold and MC-Sym pipeline can be scored against a variety of low- and high-resolution ex-perimental data, in a effort to produce better RNA models. By generating various decoy sets which makes use (or not) of long-range base pairing interactions, we investigated the power of many low-resolution data to identify the native fold.
CHAPTER 4
ARTICLE 1
The MC-Fold and MC-Sym pipeline infers RNA structure from sequence data
Marc Parisien and François Major
Institute for Research in Immunology and Cancer, Department of Computer Science and Operations Research,
Université de Montréal, PO Box 6128, Downtown station, Montréal, Québec, H3C 3J7, CANADA
Parisien M, Major F.
Nature 2008452:51-55.
4.1 Abstract
The classical RNA secondary structure model considers A•U and G•C Watson-Crick as well as G•U wobble base pairs. Here we substitute it for a new one, in which sets of nucleotide cyclic motifs define RNA structures. This model allows us to unify all base pairing energetic contributions in an effective scoring function to tackle the problem of RNA folding. We show how pipelining two computer algorithms based on nucleotide cyclic motifs, MC-Fold and MC-Sym, reproduces a series of experimentally determined RNA three-dimensional structures from the sequence. This demonstrates how crucial the consideration of all base-pairing interactions is in filling the gap between sequence and structure. We use the pipeline to define rules of precursor microRNA folding in double helices, despite the presence of a number of presumed mismatches and bulges, and to propose a new model of the human immunodeficiency virus-1 -1 frame-shifting element.
4.2 Introduction
The number of RNAs found to be involved in non-coding cellular roles is increasing rapidly and persistently [2, 29], and many RNA transcripts of unknown function have recently been detected in eukaryotic cell maps [211]. RNAs can be grouped into fam-ilies that share structural features and function. Therefore, unravelling the structure provides crucial insights into the way in which RNA works. However, producing RNA high-resolution structures by X-ray crystallography and NMR spectroscopy is slow com-pared to sequencing, thus creating an important gap between the number of known tertiary (three-dimensional, 3D) structures [39] and that of sequences [212].
In the search for an effective RNA structure-determination approach, we examined different theoretical schemes and studied their relative merit to attain our goal. Hope came from the fact that secondary structures would provide enough structural con-straints to automate 3D building [150]. A secondary structure describes the stems of RNA - crucial building blocks that form when two complementary regions of the
se-29 quence base pair and adopt a double-helix structure. A legitimate approximation of secondary structures considers stems that consist of A•U and G•C Watson-Crick base pairs as well as G•U wobble base pairs. These base pairs are called ’canonicals’.
Secondary structures can be derived from a sequence by using a combination of free-energy minimization [213] and covariation analysis [214]. However, the presence of a few key non-canonical base pairs blurs predictions, because they contribute energies and complicate covariation interplay [202]. Even when experimental data are consid-ered (for example, enzymatic or chemical probing), selecting the native amongst many suboptimal secondary structures remains elusive [180]. More importantly, secondary structures deprived of non-canonical base pairs are neither adequate to determine 3D structures nor sufficient to faithfully align sequences of the same family [77, 150, 215]. Recent attempts to replace thermodynamics by statistical scores resulted in either simi-lar [205] or only slightly improved [204] predictive power. Furthermore, empirical scoring of 3D structures applies only to very short sequences and requires covariation data [44]. Taken together, these shortcomings and increasing needs for RNA genome-wide anno-tation prompted us to develop a new approach.
We extended the classical rationale underlying RNA structure prediction by incorpo-rating all base pairs. To do so, we introduced a new first-order object to represent nu-cleotide relationships in structured RNAs: the nunu-cleotide cyclic motif (NCM). The NCMs became apparent to us from an analysis of the X-ray crystallographic structure of the 23S ribosomal RNA of Haloarcula marismortui [156]. Adjacent NCMs share common base pairs - a property providing enough base-pairing context information to derive an effective scoring function and making possible the use of the same algorithm for predict-ing secondary and tertiary structures.
We propose a new RNA-structure-prediction method based on NCMs, implemented as a pipeline of two computer programs: MC-Fold and MC-Sym (Supplementary Fig. 5.1). We illustrate the predictive power of the pipeline by reproducing experimentally deter-mined 3D structures from a single sequence, building 3D structures of precursor mi-croRNA (pre-miRNA) that are compatible with Dicer docking, and proposing a new 3D structure of the human immunodeficiency virus (HIV-1) cis-acting -1 frame-shifting
ele-ment. In practice, judicious pipeline predictions from a single sequence are expected for fragments of up to approximately 150 nucleotides.
4.3 Folding single sequences
We evaluated the predictive power of MC-Fold by comparing the base pairs in the lowest-energy (best) predicted structure of each sequence with those found in experi-mental hairpin loop structures (Table 4.1). Compared to the thermodynamic approach, MC-Fold predicts over 6% more canonical base pairs, despite a lower positive predic-tive value, concurrently makes less false posipredic-tives and negapredic-tives, and obtains a higher Matthews correlation coefficient ratio (MCCR) (see Supplementary Table 5.1). In addi-tion, the optimal solution for each hairpin includes more than 60% of the non-canonical base pairs, and this number goes up to more than 80% if the top five solutions are considered. The low rate of false negatives is a prerequisite for building 3D structures.
We evaluated the predictive power of the MC-Fold and MC-Sym pipeline by analysing and comparing the best predictions for thirteen experimental 3D structures (Table 4.2). Eleven of the thirteen examples rank first (that is, match the lowest-energy structure). Eight of the thirteen examples have MCCRs of 100% (average = 98.2%). Seven of the thirteen examples combine first rank and 100% MCCRs. The average root mean squared deviations [51] (r.m.s.d.) of the thirteen examples when optimally superimposed on their corresponding experimental structures are near 2 ångströms (Å) (Fig. 4.1). The nucleotides that increase the r.m.s.d. are those with more degrees of freedom, that is, those not involved in base-pairing interactions (see, for instance, nucleotides A14 and U16 in the iron-responsive element (IRE) hairpin loop in Fig. 4.1a). Another source of high r.m.s.d. is the presence of false positives and negatives. For instance, the telomerase RNA domain IV has an MCCR of 94% and a r.m.s.d. of 3.3 Å (Fig. 4.1b). Interestingly, the false positive and the false negative are made in the hairpin loop. The NMR structure has a single-nucleotide bulge, A22, which stacks inside the helix on the 5’ side of a CUAU tetra-loop. The C23•U26 base pair that closes the tetra-loop is sta-bilized by a single hydrogen bond, and the two bases are perpendicular to each other.
31 Although relatively stable, these features are rather rare and might be induced by par-ticular experimental conditions or structure resolution methods. The NMR hairpin loop is less stable than the penta-loop proposed by the MC-Fold and MC-Sym pipeline.
When the experimental structure does not correspond to the lowest-energy structure, it is generally due to the formation of extra base pairs in the latter. The lowest-energy structure is often referred to the ’ground state’. The base pair formation/disruption phenomenon is known to be dependent on conformational changes induced by co-factors [216], which are difficult to represent in any scoring scheme. Consequently, polymorphic structures are found in MC-Fold’s suboptimal solutions.
The conserved sequence of the Deinococcus radiodurans and Escherichia coli 23S rRNA helix 40 (ref. [217]) contains an interior loop, , the structure of which differs whether it is solved by NMR or by X-ray crystallography. The NMR conditions favour the formation of a non-canonical A•A/A•G base-pair tandem, which MC-Fold ranks first (shown in bold above). The X-ray crystallographic structure is bound to a protein that possibly induces the disruption of the A•A non-canonical base pair and the apparition of a single bulged-out A (shown in bold-italic above), which MC-Fold ranks fifth.
The ’on’ and ’off’ conformational states of the cytoplasmic eukaryotic rRNA A site [218] contains an interior loop, , the structure of which differs whether the ribo-some is active in protein translation (on) or not (off). X-ray crystallographic data of the Homo sapiens A site reveal these two distinct structures [218]. The on state has two unpaired A nucleotides that bulge out of the main helix (shown in bold above), whereas only one A, 3’ of the two bulges in the on state, is unpaired in the off state (shown in italic above). MC-Fold ranks the on state as sixth and the off state as fourth.
Multi-branched RNAs are made of more than two helical stems that are joined by a multi-branch loop. We used the pipeline to reproduce the 3D structure of a pre-catalytic conformation of the hammerhead ribozyme [115] (Fig. 4.1c), as well as that of the recent NMR structure of the Xenopus laevis 5S rRNA bound to zinc fingers [219] (Fig. 4.1d). When more than two stems are selected by MC-Fold, the coaxial energies are computed
and accounted for in the final score (Supplementary Methods). The key base pairs to project properly the hammerhead in 3D space are located near the multi-branch: the three base pairs at the bottom of stem II and the C•C base pair in stem I. The C•C base pair is particularly important to avoid coaxial stacking between stem I and stem III.
Finally, inserting a stem that creates a nested structure generates a pseudo-knot, as shown in the structure of the yellow leaf virus [220] (Fig. 4.1e). In this model, a false positive non-canonical A•A base pair is made at the bottom of the upper stem. Nevertheless, the closest generated model shares 2.7 Å of r.m.s.d. when optimally superimposed on the NMR structure.
4.4 Folding human precursor microRNAs
When we submitted the pre-miRNA sequences of let-7c, mir-19a and mir-29a, our predictions were almost identical, and were similar to the A-RNA double helix (Fig. 4.2). In fact, we did not find any pre-miRNA sequence in mirBase [221] that could not be folded in the double helix (data not shown), despite an overrepresentation of U•U and U•C mismatches. The double helix offers a fixed and stable reference to the scissile phosphates that are cleaved by the Drosha complex upstream of the pre-miRNA [222], as well as by Dicer near the terminal loop [223].
The pre-miRNA double helix of let-7c (Fig. 4.2a) is bulge-free and presents to Dicer the expected docking surface [223], despite the non-canonical base pairs. In the 3D structure of mir-29a (Fig. 4.2b), the unpaired C23 nucleotide stacks inside the helix, acting as a lever to push the scissile phosphate of A26 into its proper position. Finally, in the 3D structure of mir-19a (Fig. 4.2c), the two unpaired nucleotides, A56 and U57, form a bulge behind the docking surface, and hence do not interfere with Dicer binding. These strict 3D structural restraints should further help in distinguishing between RNA stem-loop structures that can be processed by Dicer.
The presumed microRNA mismatches, in fact, adopt a geometry isosteric to Watson-Crick base pairs [74]. Their energies are less than that of canonical ones, which may
33 facilitate the unwinding of the double helix and loading of the mature miRNA into the RNA-induced silencing complex (RISC). Interestingly, we find very few G•A mismatches in the miRNA region interfacing Dicer because their propensity for the sheared confor-mation is not isosteric to Watson-Crick base pairs. The sheared geometry distorts the backbone path of the double helix and, thus, might interfere with Dicer binding. The natural selection for non-canonical base pairs increases the diversity of possible pre-miRNA sequences, while increasing target specificity and, simultaneously, decreasing off targeting.
4.5 Folding using probing data
As shown above, MC-Fold does not always rank experimental and activated struc-tures first. Reaching these strucstruc-tures is nevertheless of principal importance. Here we show how experimental data can be incorporated to restrain the conformational space of MC-Fold to identify such induced structures.
For example, a recent study investigated the yeast transfer RNAAsp structure by selective 2’-hydroxyl acylation and primer extension (SHAPE) [224]. SHAPE data reveal the flexible and constrained nucleotides, subject to experimental conditions. The tRNA sequence tested is deprived of the modified nucleotides, and has been shown to adopt the cloverleaf structure [225]. The top MC-Fold prediction of this tRNAAsp sequence is a hairpin, not a cloverleaf.
If we introduce high- and medium-flexibility SHAPE constraints (Supplementary Fig. 5.2), MC-Fold generates cloverleaf structures and ranks the native one sixth. The D-stem-loop sequence of this tRNA has a positive folding free energy under the thermodynamic model. Amongst the solutions, one includes a correct D-stem base-pairing registry (MCCR of 100%) and the A14•A21 base pair, whereas all other solutions base pair U13 with A21. The A14 inflexibility demonstrated by SHAPE is thus sufficient to discriminate the native amongst all solutions.