HAL Id: inserm-00616977
https://www.hal.inserm.fr/inserm-00616977
Submitted on 25 Aug 2011HAL is a multi-disciplinary open access
archive for the deposit and dissemination of sci-entific research documents, whether they are pub-lished or not. The documents may come from teaching and research institutions in France or abroad, or from public or private research centers.
L’archive ouverte pluridisciplinaire HAL, est destinée au dépôt et à la diffusion de documents scientifiques de niveau recherche, publiés ou non, émanant des établissements d’enseignement et de recherche français ou étrangers, des laboratoires publics ou privés.
Automatic phases recognition in pituitary surgeries by
microscope images classification
Florent Lalys, Laurent Riffaud, Xavier Morandi, Pierre Jannin
To cite this version:
Florent Lalys, Laurent Riffaud, Xavier Morandi, Pierre Jannin. Automatic phases recognition in pituitary surgeries by microscope images classification. IPCAI’10, First international conference on Information processing in computer-assisted interventions, Jun 2010, Geneve, Switzerland. pp.34-44, �10.1007/978-3-642-13711-2_4�. �inserm-00616977�
Automatic phases recognition in pituitary surgeries by
microscope images classification
Florent Lalys1,2,3 , Laurent Riffaud4 , Xavier Morandi1,2,3,4 , Pierre Jannin1,2,3
1
INSERM, U746, Faculty of Medicine CS 34317, F-35043 Rennes, France
2
INRIA, VisAGeS Unit/Project, F-35042 Rennes, France
3
University of Rennes I, CNRS, UMR 6074, IRISA, F-35042 Rennes, France
4
Department of Neurosurgery, Pontchaillou University Hospital, F-35043 Rennes, France
Abstract. The segmentation of the surgical workflow might be helpful for
providing context-sensitive user interfaces, or generating automatic report. Our approach focused on the automatic recognition of surgical phases by microscope image classification. Our workflow, including images features extraction, image database labelisation, Principal Component Analysis (PCA) transformation and 10-fold cross-validation studies was performed on a specific type of neurosurgical intervention, the pituitary surgery. Six phases were defined by an expert for this type of intervention. We thus assessed machine learning algorithms along with the data dimension reduction. We finally kept 40 features from the PCA and found a best correct classification rate of the surgical phases of 82% with the multiclass Support Vector Machine.
Keywords: Surgical phase, digital microscope, neurosurgery, feature extraction
1 Introduction
With the increased number of technological tools incorporate in the OR, the need for new computer-assisted systems has emerged [1]. Moreover, surgeons have to deal with adverse events during operations, coming from the patient itself but also from the operation management. The idea is to limit and be aware of these difficulties, and to better handle risks situations as well as to relieve surgeon’s responsibilities. The purpose of recent works is not to substitute medical staff in the OR but to increase medical safety and support decision making. One solution is to assist surgeries through the understanding of operating room activities, which could be introduce in current surgical management systems. It could be useful for OR management optimization, providing context-sensitive user interfaces or generating automatic reports. Thus, surgical workflow recovery as well as surgical process modelling has gained much interest during the past decade.
Neumuth et al. [2] defined Surgical Process (SP) as a set of one or more linked procedures or activities that realize a surgical objective. Surgical Process Models (SPMs) are simply defined by models of surgical interventions. A detailed SPM may help in understanding the procedure by giving specific information of the intervention course. Applications of SPMs are the evaluation of surgeons (training and learning), system comparison, procedures documentations and surgical feedbacks. As Jannin et al. [3] mentioned, the modeling must address behavioral, anatomical, pathological aspects and surgical instruments. They also defined surgical workflow, which relates to the performance of a SP with support of a workflow management system.
Teams have understood the necessity of real-time information extraction for the creation of complex surgeries models. The difference in the level of granularity for the extraction process allows deriving complementary numeric models for workflow recovery. Thus, data extraction is performed either from a human sight or from sensor devices. In this context, different methods have been recently used for data acquisition: patient specific procedures description [2-4], interview of the surgeons [5], sensor-based methods [6-16], using fixed protocols created by expert surgeons [17], or combination between them [18].
Within sensor-based approaches, Padoy et al. [6] segmented the surgical workflow into phases based on temporal synchronization of multidimensional state vectors, using Dynamic Time Warping (DTW) and Hidden Markov Models (HMMs). These algorithms permit to recognize patterns and extract knowledge. Signals recorded were binary vectors indicating the instrument presence.
At a lower level, the force/torque signals of the laparoscopic instruments recorded during a suturing task can be learned with HMMs [7]. Close to this work, Lin et al. [8] also trained HMMs to automatically segment motion data during a suturing task perform with the Da Vinci robot. With the same robot, Voros and Hager [9] used kinematic and visual features to classify tool/tissue interactions in real-time. Their work was a first step towards intelligent intraoperative surgical system. Recent work of Ahmadi et al. [10] used accelerometers placed on the operator along with motif discovery technique to identify alphabets of surgical activity. Models of gestures relied on tools only and motions may not be well segmented with rare movements.
Using others data extraction techniques, Bhatia et al. [11] analyzed OR global view videos for better management, whereas Xiao et al. [12] implemented a system that record patient vital signs in order to situate the intervention process. James et al. [13] installed an eye-gaze tracking system on the surgeon combined with visual features to detect one important phase. Nara et al. [14] introduced an ultrasonic location aware system that continuously tracks 3-D positions of the surgical staff. Results on identifying key surgical events were presented. For the construction of a context-aware system, Speidel et al. [15] used laparoscopic videos to create a situation recognition process. In their work, they focused on risk situation for surgical assistance. Finally, Sanchez-Gonzales et al. [16] extracted useful information from videos such as 3D map to help surgeons performing operating techniques.
Our project is based on the extraction of information from digital microscope videos. It permits not only to avoid the installation of supplementary materials in the OR, but also to have a source of information that has not to be controlled by human. Computer vision techniques bring processing algorithms to transform images and videos into a new representation that can be further used for machine learning
techniques (supervised or non-supervised classification). We decided in a first phase to use image from videos (called frames) in a static way without taking into account the motion. The problem is thus reduced to an image classification problem. Even with this restriction, technical possibilities remain very large. We focused on the automatic recognition of surgical phases and validated our methodology with a specific type of neurosurgical interventions.
2 Materials and Methods
We evaluated our algorithm on pituitary adenoma surgeries [19]. It's tumors that occur in the pituitary gland and which are representing around ten percent of all intra-cranial tumour removals. Neurosurgeons mostly use a direct transnasal approach, where an incision is made in the back wall of the nose. Rarely, a craniotomy is required. In this work all surgeries were performed according to the first approach.
2.1 Data
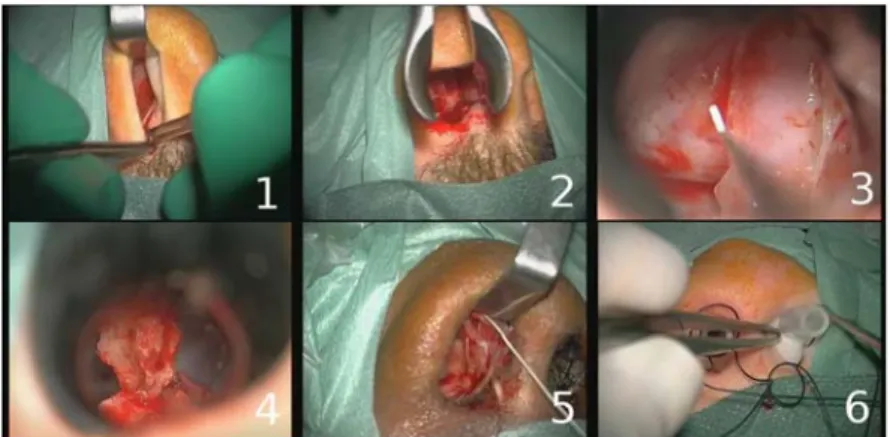
Our project is currently composed of 16 entire pituitary surgeries (mean time of surgeries: 50min), all performed in Rennes by three expert surgeons. Videos were recorded using the surgical microscope OPMI Pentero (Carl Zeiss). The initial video resolution was 768 x 576 pixels at 33 frames per second. Recordings were obtained from nasal incision until compress installation (corresponding to the microscope use). From these videos, we randomly extracted 400 images which were supposed to correctly represent the six phases of an usual pituitary surgery. These phases, which were validated by an expert surgeon, are: nasal incision, nose retractors installation, access to the tumor along with tumor removal, column of nose replacement, suturing and nose compress installation (Fig. 1). Each image of the database was manually labeled with its corresponding surgical phase.
Fig. 1. Example of typical digital microscope images for the six phases: 1) nasal incision, 2)
nose retractors installation, 3) access to the tumor along with tumor removal, 4) column of nose replacement, 5) suturing, 6) nose compress installation.
2.2 Feature extraction
We defined for each image a feature vector that represented a signature. Images signatures are composed of three main information that usually describe an image: the color, the texture and the form.
The color has been extracted with two complementary spaces [20]: RGB space (3 x 16 bins) along with Hue (30 bins) and Saturation (32 bins) from HSV space.
The texture has been extracted with the co-occurrence matrix along with Haralick descriptors [21]. The co-occurrence matrix is used to describe the patterns of neighboring pixels in an image
I
at a given distance. Mathematically, the matrixC
is defined over an imagen
xm
and an offset:∑ ∑
= = Δ Δ ⎩ ⎨ ⎧ = + Δ + Δ = = n p m q y x otherwise j y q x p I and i q p I if j i C 1 1 , , 0 ) , ( ) , ( , 1 ) , ( (1)Four such matrices are needed for different orientations (horizontal, vertical and two diagonal directions). A kind of invariance was achieved by taking into account the four matrices. Haralick descriptors were then used by computing the contrast, the correlation, the angular second moment, the variance of the sum of squares, the moment of the inverse difference, the sum average, the sum variance, the sum entropy, the difference of variance, the difference of entropy, and the maximum correlation coefficient of the co-occurrence matrix.
The form was represented with spatial moments [22], which describe the spatial distribution of values. For a grayscale image the moments
M
i,j are calculated by:∑∑
n = p m = q j i j i,=
p
q
I(p,
q)
M
1 1 (2)The 10 first moments were included in the signatures.
We then computed the Discrete Cosine Transform (DCT) [23] coefficients
pq
B
that reflect the compact energy of different frequencies. DCT is calculated by:2N 1 2n cos 2M 1 2m cos 1 0 1 0 )q + π( )p + π( A α α = B M = m N = n mn q p pq
∑∑
− − , 1 0 1 0 − ≤ ≤ − ≤ ≤ N q M p (3) with ⎪ ⎩ ⎪ ⎨ ⎧ = M M p 2 1 α , 1≤ p≤ M − 1p=0 and ⎪ ⎩ ⎪ ⎨ ⎧ = N N q 2 1 α , p=0 1≤ p≤ M − 1The
B
pq coefficients of upper left corner represent visual information of lower intensities, whereas the higher frequency information is gathered at right lower corner of the block. Most of the energy is located in the low frequency area, that's why we took the 25 features of the upper left corner.2.3 Data reduction
Original frames were first downsampled by a factor of 8 with a 5-by-5 Gaussian kernel (internal studies have shown that until this downsampling rate, it had no impact on the classification process). After features extraction, we performed a statistical normalization. On each feature value we subtracted the mean and divided by the variance. After normalization, data closely followed a normal distribution (mean=0 and standard deviation=1) and were more easily used for data variations comparisons.
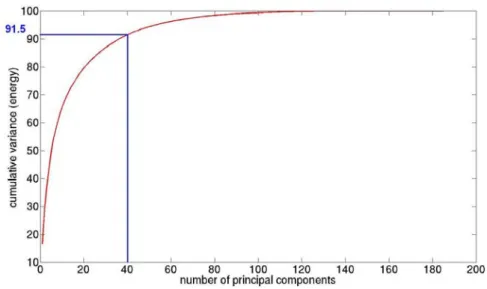
In order to decrease the data dimension, and knowing that too many features can decrease the correct classification rate, we also performed a Principal Component Analysis (PCA) [24]. PCA is a statistical method used to decrease the data dimension while retaining as much as possible of the variation present in the data set to process the data faster and effective. Fig. 3 shows the extracted cumulative variance.
2.4 Cross-validation
With the image data-base we are now able to train models by using machine learning techniques. We performed a study to find the most appropriate algorithm. We tested multiclass Support Vector Machine (SVM), K-Nearest Neighbors (KNN), Neural Networks (NN), decision tree and Linear Discriminant Analysis (LDA).
The goal of SVM is to find the optimal hyperplane that separates the data into two categories. The multiclass SVMs [25] extends it into a K-class problem, by constructing K binary linear SVMs. The KNN algorithm (used with the Euclidean distance) is the simplest method for classification. Each point in the space is assigned to the class C if it is the most frequent class label among the k-nearest training samples. NN [26] are non-linear statistical methods based on biological neural networks. They are often used to model complex relationships between inputs and outputs. We used it in a supervised way with a back-propagation neural network. The decision tree is a quick classification algorithm where each internal node tests an attribute. It is specially used when data are noised and classes are discrete. Finally, the LDA is based on a Fisher analysis. It is a linear combination of features that best separate two or more classes.
Algorithms were evaluated with a random 10-fold cross-validation study [27]. The data-set was divided into 10 random subsets. Nine were used for training while the prediction is made on the 10th subset. This procedure was repeated 10 times and correct classification rates were averaged. In addition, the cross-validation study allows computing the sensitivity and the specificity. The specificity is defined by:
FP + TN
TN =
Spe and the sensitivity is defined by
FN + TP TP = Sen , where FP is False Positive, TP is True Positive, FN is false Negative and TN is True Negative.
The cross-validation was computed for each algorithm but also for each number of principal components used in order to keep the best classification algorithm and to decide how many principal components we had to take.
3 Results
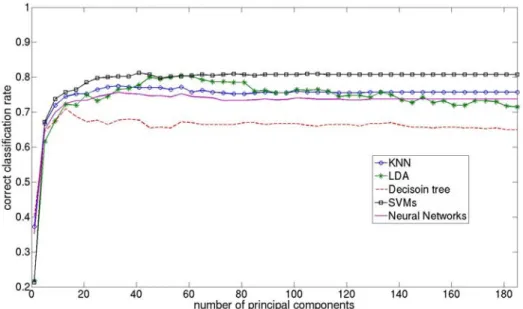
Fig. 2 shows the cross-validation study. Multiclass SVMs and LDA give best results. For both algorithms the correct classification rate increase until 40 principal components and then LDA decreases while SVMs stays at a higher recognition rate. From 30 principal components, correct classification rates of the NN and KNN are almost unchanging, but their best scores are significantly lower than for SVM and LDA. Finally, the decision tree gives the worst results compare to other classifiers.
Fig. 2. Correct classification rate of the surgical phases with five different algorithms,
according to the number of principal components.
We decided to keep 40 principal components, which represent 91.5% of the energy of all the data set (Fig. 3). With these features we obtained accurate statistical results:
Table 1. Correct classification rate (accuracy), sensitivity and specificity of classification
algorithms. Image signatures are composed of the 40 first principal components.
Algorithms Accuracy Sensitivity Specificity Multiclass SVMs 82.2% 78.7% 98.1%
KNN 74.7% 66.0% 95.4%
Neural Network 71.3% 65.1% 92.8% Decision tree 66.2% 52.3% 94.0%
LDA 81.5% 77.0% 97.6%
We can see from Tab. 1 that specificity is always upper than sensitivity for all algorithms. Not surprisingly, multiclass SVMs obtained best sensitivity (78.7%) and specificity (98.1%) whereas the decision tree shows its limits (specificity: 52.3%).
The computation time of the classification process of one image (feature extraction + data transformation + classification) was less than 0.5s. We didn't take into account the computation time of the learning database, considering that it was done off-line.
Fig. 3. Cumulative variance of the Principal Component Analysis.
4 Discussion
Our global workflow, including image database labelisation, features extraction, PCA, and cross-validation studies make possible the extraction of discriminant image features for each phase. After experiments, we finally kept 40 principal components for a best correct classification rate of the surgical phases of 82% with SVMs.
4.1 Images database
The performance is strongly linked to the diversity and the power of discrimination of the database. We can easily imagine that accuracy may sorely decrease if images are not efficiently representing all phases or all scene possibilities within phases.
There are other limitations to this type of study. The image database may not be adaptable to other neurosurgery departments, due to the difference of materials and equipment in each department. For instance, the color of surgical tissue in Rennes may be different elsewhere and the corresponding features would completely affect the training process. The solution would be to train specific image databases for each department which would be well adapted to the surgical environment. The idea would also be to have several databases for each type of procedure with specific phases. For other departments and/or surgeries, discriminant images features may differ, which would require adapting the feature extraction process by launching identical studies.
Other factors of variability within the data-set can affect the recognition. For instance, differences can be found in the way that surgeons are working or in patient specific surgery. Ideally, one database should be created for each department, associated with each type of surgery and each surgeon.
4.2 Explanation of classification errors
We decided to fuse the initial possible phases “access to the tumor” and “tumor removal” because for this type of surgical procedure it's currently hard to distinguish them only with image features. The transition between both is not clearly defined due to similar tools and same microscope zooms used while performing these tasks.
The correct classification rate includes the results of the cross-validation study for the six phases. From these results, we noticed frequent confusions mainly between phase n°3 and n°4, and also between n°1 and n°5. These errors are explained by the very close image features of these phases. Same microscope zooms, along with similar colors and same surgical instruments make the recognition task very difficult. One solution of this issue would be to integrate one other signal: the surgery time. This information would for instance permit to correctly recognize an image originally identified as part of phase n°5 or part of phase n°1. On the other hand it would still be hard to separate consecutive phases.
4.3 Classification algorithms
In this study (Fig. 2), multiclass SVMs and LDA gave the best correct classification rates. SVMs have been used in a linear way and are known to have good generalization properties that permit to outperform classical algorithms. LDA, used as a classifier, is like many others optimal when the features have a normal distribution (true in our case after normalization). On the opposite, the decision tree, NN and KNN gave worse results. Decision trees are often instable, especially with small changes in the training samples. Our data-set was probably too variable (in color, texture...) and not enough discriminant to train accurate models with decision trees. While KNN is generally outperformed by other classifiers, it may be well interesting because of its simplicity and flexibility. Nevertheless, our results showed that it was not suitable for our data-set. Concerning NNs, it was quite surprising regarding their capabilities to improve their performances when the amount of data increases. Non-linear algorithms are generally more suitable for complex systems, which is not the case here. On the opposite, linear ones are more straightforward and easy to use, that's why it seems that they are more adaptable for our system.
The correct classification rates for SVMs, KNN and NN are almost constant until 185 features, whereas accuracy of the decision tree and especially LDA decrease. This is due to the high dimension of inputs which usually decreases results of classifiers. It's also the reason why we only kept 40 features for images signatures. If PCA would not have been performed, we would only have obtained an accuracy of 78% (with KNN), which demonstrated the usefulness of this step in our workflow.
According to Tab. 1, most of the difference between classifiers is made by sensitivities, which are lower than specificities. A high specificity is due to the absence of FP (image belonging to phase x not identified as part of phase x), whereas a low sensitivity is due to a high FN rate (image not belonging to phase x identified as part of phase x). Thus the challenge in the future would be to increase FN rates.
In presence of unexpected events, such as bleeding or brutal microscope move, the specificity sensibly decreases and thus affects global accuracy. Such situations, as being unpredictable, are a high limitation to the classification from static images only. One solution of this issue, not implemented yet, would be to detect such images (containing features that are very different from the others, and therefore easily detectable) and to take into account the recognized phase of the precedent image.
4.4 Applications
The idea is to assist surgeries through the understanding of operating room activities. This work could be integrated in an intelligent architecture that extracts microscope images and transform it in a decision making process. The purpose would be to bring a plus-value to the OR management (as in [10]) and to the surgery (as in [14]). For now, even with a low on-line computation time (< 0.5s), the best obtained correct classification rate is certainly not accurate enough to be included in such systems. For intra-operative clinical applications, accuracy must definitively be higher than our results before establishing on-line surgical phases detection.
However, with the present methodology, the system could be introduced in the surgical routine as an help for post-operative indexation of videos. Surgical videos are very useful for learning and teaching purposes, but surgeons often don't use them because of the huge amount of surgical videos, the lack of data organization and storage. The created video data-base would contain relevant surgical phases of each procedure for easy browsing. Moreover, we could imagine the creation of post-operative reports, automatically pre-filled by recognized events that will have to be further completed by surgeons themselves. For such clinical applications, even with few errors, the automatic indexation would be relevant, as there is no need of perfect detection and it has no impact on the surgery itself.
We deliberately remain at a high level of granularity with the recognition of global phases. The recognition of lower level information, such as surgical gestures, is very difficult (almost impossible) only with images. Other computer vision techniques (such as tracking) or specific video processing methods (such as spatio-temporal features extraction) will have to be inserted and mixed for dynamic information extraction.
5 Conclusion
With this large labeled images database, we are now able to recognize surgical phases of every unknown image, by computing his signature and then simulating with machine learning techniques. We have validated our methodology with a specific type of neurosurgery, but it can easily be extended to other type of interventions. With this
recognition process, it's a first step toward the construction of a context-aware surgical system. Currently this work could be used for post-operative video indexation as a help for surgeons. Image features will have to be mixed with other type of information to generate a more robust and accurate recognition system. Other methods usually used by the computer vision community (segmentation, tracking) could also be integrated in future works in order to bring complementary features.
Acknowledgments. The authors would like to acknowledge the financial support of Carl Zeiss Surgical GmbH.
References
1. Cleary, K., Chung, H.Y., Mun, S.K.: OR 2020: The operating room of the future. Laparoendoscopic and Advanced Surgical Techniques. 15(5), 495--500 (2005)
2. Neumuth, T., Jannin, P., Strauss, G., Meixensberger, J., Burgert, O.: Validation of Knowledge Acquisition for Surgical Process Models. J Am Med Inform Assoc. 16(1), 72--82 (2008)
3. Jannin, P., Morandi, X. Surgical models for computer-assisted neurosurgery. Neuroimage, 37(3), 783--91 (2007)
4. Jannin, P., Raimbault, M., Morandi, X., Riffaud, L., Gibaud, B. Model of surgical procedures for multimodal image-guided neurosurgery. Computer Aided surgery. 8(2), 98--106 (2003)
5. Morineau, T., Morandi, X., Le Moëllic, N., Diabira, S., Haegelen, C., Hénaux, PL., Jannin, P. Decision making during preoperative surgical planning. Human factors. 51(1), 66--77 (2009).
6. Padoy, N., Blum, T., Essa, I., Feussner, H., Berger, MO., Navab, N. A boosted segmentation method for Surgical Workflow Analysis. In Ayache, N., Ourselin, S., Maeder, A. (Eds.)
MICCAI, Part II, LNCS 4792, 102-109 (2007)
7. Rosen, J., Solazzo, M., Hannaford, B., Sinanan, M.: Task decomposition of laparoscopic surgery for objective evaluation of surgical residents’ learning curve using hidden markov model. Comput Aided Surg. 7(1), 49–61 (2002)
8. Lin, H.C., Shafran, I., Yuh, D., Hager, G.D.: Towards automatic skill evaluation: Detection and segmentation of robot-assisted surgical motions. Computer Aided Surgery, 11(5), 220– 230 (2006)
9. Voros, S., Hager, GD. Towards “real-time” tool-tissue interaction detection in robotically asisted laparoscopy. Biomed Robotics and Biomechatronics. 562—567 (2008)
10. Ahmadi, SA., Padoy, N., Rybachuk, K., Feussner, H., Heinin, SM., Navab, N. Motif discovery in OR sensor data with application to surgical workflow analysis and activity detection. M2CAI workshop, MICCAI, London (2009)
11.Bhatia, B., Oates, T., Xiao, Y., Hu, P.. Real-time identification of operating room state from video. AAAI, 1761-1766 (2007)
12.Xiao, Y., Hu, P., Hu, H., Ho, D., Dexter, F., Mackenzie, CF., Seagull, FJ. An algorithm for processing vital sign monitoring data to remotely identify operating room occupancy in real-time. Anesth Analg, 101(3), 823-832 (2005)
13.James, A., Vieira, D., Lo., B.P.L., Darzi, A., Yang, G-Z.: Eye-gaze driven surgical workflow segmentation. In: Proc. of Medical Image Computing and Computer-Assisted Intervention (MICCAI), 110--117 (2007)
14.Nara, A., Izumi, K., Iseki, H., Suzuki, T., Nambu, K., Sakurai, Y. Surgical workflow analysis based on staff's trajectory patterns. M2CAI workshop, MICCAI, London (2009)
15. Speidel, S., Sudra, G., Senemaud, J., Drentschew, M., Müller-stich, BP., Gun, C., Dillmann, R. Situation modelling and situation recognition for a context-aware augmented reality system. Progression in biomedical optics and imaging. 9(1), 35 (2008)
16.Sanchez-Gonzales, P., Gaya, F., Cano, AM., Gomez, EJ. Segmentation and 3D reconstruction approaches for the design of laparoscopic augmented reality. Biomedical simulation. Springer Berlin/Heidelberg, 5104, 127—134 (2008)
17. MacKenzie, CL., Ibbotson, AJ., Cao, CGL., Lomax, A. Hierarchical decomposition of laparoscopic surgery: a human factors approach to investigating the operating room environment. Min Invas Ther All Technol. 10(3), 121--128 (2001)
18.Neumuth T, Czygan M, Goldstein D, Strauss G, Meixensberger J, Burgert O. Computer assisted acquisition of surgical process models with a sensors-driven ontology. M2CAI workshop, MICCAI, London (2009)
19.Ezzat, S., Asa, SL., Couldwell, WT., Barr, CE., Dodge, WE., Vance, ML., McCutcheon, IE. The prevalence of pituitary adenomas: a systematic review. Cancer. 101(3), 613--622 (2004) 20.Smeulders, AW., Worrin, M., Santini, S., Gupta, A., Jain, R. Content-based image retrieval at the end of the early years. IEEE Trans on pattern analysis and machine learning intelligence. 22(12), 1349--1380 (2000)
21. Haralick, RM., Shanmugam, K., Dinstein, I: Textural features for image classification. IEEE Trans on Systems, Man, and Cybernetics. 3(6), 61--621 (1973)
22.Hu, MK. Visual pattern recognition by moment invariants. IRE Trans on Information Theory. 8(2), 179--187 (1962)
23.Ahmed, N., Natarajan, T., Rao, KR. Discrete Cosine Transform. IEEE Trans Comp. 90--93 (1974)
24. Jolliffe, T. Principal component analysis. Springer, New York (1986).
25.Crammer, K. and Singer, Y. On the Algorithmic Implementation of Multi-class SVMs. JMLR (2001)
26 Haykin, S. Neural Networks and Learning Machines - third edition. Hardcover (2008). 27.Duda, R,. Hart, P., Stork, D.: Pattern Classification. New York: Wiley-Interscience (2001)