HAL Id: hal-03213133
https://hal.inria.fr/hal-03213133
Submitted on 30 Apr 2021HAL is a multi-disciplinary open access archive for the deposit and dissemination of sci-entific research documents, whether they are pub-lished or not. The documents may come from teaching and research institutions in France or abroad, or from public or private research centers.
L’archive ouverte pluridisciplinaire HAL, est destinée au dépôt et à la diffusion de documents scientifiques de niveau recherche, publiés ou non, émanant des établissements d’enseignement et de recherche français ou étrangers, des laboratoires publics ou privés.
Distributed under a Creative Commons Attribution| 4.0 International License
The Generation of a Situation Model, in Real-Time, as a
Support to Crisis Management
Audrey Fertier, Anne-Marie Barthe-Delanoë, Aurelie Montarnal, Sébastien
Truptil, Frederick Benaben
To cite this version:
Audrey Fertier, Anne-Marie Barthe-Delanoë, Aurelie Montarnal, Sébastien Truptil, Frederick Ben-aben. The Generation of a Situation Model, in Real-Time, as a Support to Crisis Management. ITDRR 2016 - 1st International Conference on Information Technology in Disaster Risk Reduction, IFIP, Nov 2016, Sofia, Bulgaria. pp.198-213, �10.1007/978-3-319-68486-4_16�. �hal-03213133�
The Generation of a Situation Model, in Real-time, as a
Support to Crisis Management
Audrey Fertier1, Anne-Marie Barthe-Delanoë2, Aurélie Montarnal1, Sébastien Truptil1, and Frédérick Bénaben1
1 Centre Génie Industriel, Université de Toulouse, Albi, France
audrey.fertier@mines-albi.fr
2 Lab. de Génie Chimique, Université de Toulouse, CNRS, INPT, UPS, Toulouse, France
annemarie.barthe@ensiacet.fr
Abstract. There are more and more data sources available in the world every
day. This is the opportunity for organizations to improve their situation aware-ness in order to take better decisions, faster than ever before. The GéNéPi project was set up to help them: it aims to support their collaboration, in real-time, what-ever the complexity or instability of the environment. To set up and test the so-lution proposed by the project’s consortium, a crisis use case has been developed by official sources. This article shows a new approach to automating the creation and update of a situation model, in real-time to offer: (i) the decision-makers a common operational picture; (ii) the GéNéPi project a base on which a collabo-rative process is defined and maintained to the benefits of the decision makers.
Keywords: Modeling, Big Data, Situation Awareness, Crisis Management,
Common Operational Picture.
1
Introduction
During a crisis situation, the inter-connection of networks compels the stakeholders to collaborate. To make this collaboration possible, on the field and between the several decisional levels, crisis cells are set up. Their main purpose includes the information sharing and a centralized decision-making. The number of incoming and outgoing com-munications of the crisis cells quickly takes up everybody’s time. Moreover, the innate instability of the situation compels the decision-makers, far from the field, to obtain the best possible situation awareness in real-time.
The growing number of data sources over the last decade is the opportunity to quickly obtain information on the on-going situation. Unfortunately, if the crisis cells want to avoid drowning in raw data and information, they have to limit their investiga-tion area on inner sensors, devices or internal reports. To support the stakeholders’ col-laboration on the field and relieve the decision-makers, the GéNéPi (The GéNéPi pro-ject is funded by the French national association for research. It considers using the innate granularity of the management levels in crisis context to better support coordi-nation (cf. ANR-14-CE28-0029) project aims to design, orchestrate and monitor a
re-sponse collaborative process in real time. One innovation involves the automatic gen-eration of a situation model on the basis of raw data. This model is created and updated in two rounds: (i) A ground truth model comes first and describes fact coming directly from trusted data sources; (ii) New information is automatically deduced from the ground truths in regards with the knowledge base, thanks to deduction rules. During these two phases, the system instantiates a model called meta-model (A meta-model can be defined as “explicit specification of an abstraction” [1]. In the GéNéPi project, the meta-model is a model that describes the crisis collaboration domain.).
This paper presents a new methodology for supporting decision-makers in managing data and information, inside French crisis cells. The output is the situation model that will be used as an input for: (i) the inference and monitoring of the collaborative pro-cess; (ii) the generation of a common operational picture for every crisis cell.
To answer these topics, the second part of this article concerns the opportunities and threats brought by the amount of available data in crisis situation. The third one explains how to benefit from the particularities of crisis collaborations. The fourth one focuses on the features of events to be dealt with during a crisis response. Then, the fifth and last part presents two existing approaches answering to the ‘how to?’ question of the third part, along with a new methodology, answering to all the data features’ issues presented in the fourth part.
2
Excessive Amount of Available Data to Be Processed
in Real-time
According to Ackoff [2]: data represents ‘properties of objects and events’, information is ‘contained in descriptions’ (Who? What? Where? How many?), and knowledge is ‘conveyed by instructions’ (How to?). This section explains where all this available data comes from, why is it important to manage it all, and how fast data needs to be processed by the crisis cells.
2.1 The Decision-makers’ Needs
Growing networks of people, devices, and organizations generate more and more data. These data sources are numerous and heterogeneous: they introduce complexity in cri-sis management at several levels. If the decision-makers want to take advantages of this new situation, they will need to: locate data sources; identify them; infer new infor-mation describing the situation; sum up and share their inforinfor-mation and knowledge inside the crisis cell; etc. Their goal is to obtain the most reliable and accurate view of the situation, as a common operational picture, to be able to make well-informed decisions [3].
2.2 The Time Pressure
A shared situation awareness (SA) can be defined as “the degree to which team mem-bers have the same SA on shared SA requirement” [4]. This has to be achieved in
real-time to fit the innate instability of crisis. To generate it, data and information have to be gathered from the stakeholders involved in the crisis response. Unfortunately, it takes significant and precious time to obtain and spread the right data or information to the right person or device at the right time. That’s the reason why, the decision-makers choose to limit the number of their data sources.
2.3 Balance Between Swiftness and Quality
Limitations on data collection enable crisis cells to save time for decision-making but it also raises several issues as:
Outdated perceptions of the situation. The instability of crisis situation makes things nearly impossible to predict. It is then critical to be informed, in time, of any on-going development. The stakeholders involved in a crisis expect systems to re-spect this ‘on-the-fly’ requirement and harshly judge failures. For instance, the SAIP application for smartphones [5] turns out useless because of a time lag of three (!) hours [6] during the Nice terrorist attack on July 15th, 2016.
Misjudging. French crisis cells’ emergency plans include meetings that are planned on a regular basis. One of the purposes of these meetings includes the sharing of information and the decision-making based on these information. Nevertheless, the order of the data arrival may lead to various interpretations that impact the resulting decision-making process. For example, the observations of: (a) a crowd movement, (b) few people injured, (c) loud noises can be interpreted in more than on way. If the order of the observations is (a,b,c), the situation can be understood as a classical crowd movement, whereas (c,b,a) where the situation could be due to gun shots. Information loss. Some data, as weak signals, is by nature not sufficient to attract
the attention, as well as some other will not fit the information system of the crisis cells and will be lost for good.
To sum up, the growing number of available data is an incredible opportunity to improve the situation awareness of stakeholders, while facilitating decision-making through an always more accurate situation model. Meanwhile, the stakeholders have to face issues such as time lag, misjudging and information loss. Crisis information sys-tems are then needed, in real-time, to both support the decision-makers [7] and generate the best situation model possible in order to generate the expected common operational picture.
How to automatically generate the best situation model possible describing the on-going collaborative situation, while being on real-time update to match with the innate instability of a crisis?
3
The Generation of a Situation Model in Real-time
Data mining may be considered as one of the relevant answers to the automatic gener-ation of a situgener-ation model issue. A lot of data mining approaches are rather dedicated to business than to crisis situations, and there are huge differences between the two
contexts of application. This section aims to highlight those differences and to define how data mining could be used to serve the management of huge amount of available crisis data, considering the challenging issues underlined in section 2.
3.1 Particularities of Data Processing in Industry
Data mining approaches are frequently used by companies to monitor customers’ rela-tionships (CRM), or to identify the best market opportunities (BI), with the final objec-tive to support business decision-making.
H. Wang and S. Wang [8] claim that one strong approach is to use data mining to bond the gap between: (i) the data gathering, data accessing and data analyzing; and (ii) the creation and exploitation of knowledge. They also propose a step that enables the data miners to extract and mine the data, while the business insiders learn from the results and take actions in consequence.
Three hypotheses have been made in this context:
Data sources known in advance. Business insiders, in connection with data miners, plane data extractions according to their objectives. As the objectives are already known, it is somewhat easy to pick the most interesting data sources and analyze their streams with precise rules.
Narrow scope of decisions. In most of the cases, companies have a precise decom-position of their functions: therefore, the scope of actions that can be taken to solve potential issues, or reach an objective, remains narrow.
Large timeline. The data extraction may be conducted on a broad timeline to enrich the dataset and, hopefully, improve the accuracy and relevancy of the data mining results.
3.2 Particularities of Data Processing During the Crisis Response
Data extractions techniques depend on their field of application: objectives-conducted for industrial applications and ‘data sources’-oriented for crisis response applications.
A wide scope of data sources has to be streamed during a crisis to prevent lack of information, information loss, misunderstandings and snap judgements. This represents a huge data volume as varied as satellite imagery, photographs, reports, social media messages, newspaper articles, GPS locations or sensors data that has to be processed in real-time. If only automated, such a data processing could infer precious knowledge. A valuable output could be a common operational picture consisting of a map where peo-ple, actors, risks, facts [9], sentiments [10] or on-going tasks have been localized on the crisis field.
However, crisis situations are far from the industrial cases and hypothesis:
Fuzzy, unknown data sources. Data miners cannot predict the outcomes of their mining, nor the location of relevant and accurate data. Then, how to access data sources that are not known in advance, knowing that the more they are, the more reliable the result.
Unpredictable uses. A data extracted from one data source may refer to several types of information, related or not to the decision-makers objectives. Hence, the classification rules have to be at once permissive to treat as many data as possible, and accurate to meet the decision-makers expectations.
Relevant actions hard to trigger. The number of actions available to answer a risk or treat a bad effect is spreading as the number of stakeholders increases (whatever their operational/strategic level). In addition, performance indicators cannot be pre-established and the results of the response process are hardly assessable in short schedule.
Tight timeline. One single event is enough to trigger or alter a crisis in a very short time. Under these conditions, the IT system should be able to detect such events within minutes.
3.3 A Three-level IT System as a Basis to Data Management During Crisis Situation
The particularities of the industry and the crisis field reveal two important differences on: (i) the volume and quality of data that can be extracted in real time; (ii) the volume of possible actions to be taken. This is why there is a high interest in using data streams, not only to maintain a situation model, but also to define and monitor actions.
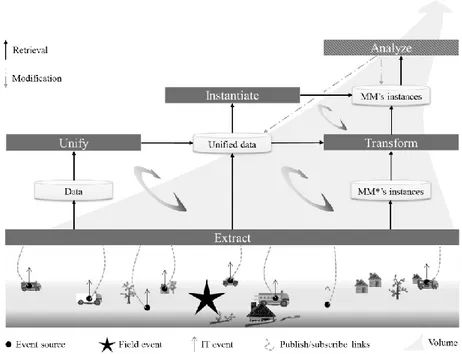
In this perspective, a three-levels IT system, as depicted in Error! Reference source
not found., is needed:
Data. The raw data is directly extracted from heterogeneous and various data sources (such as GIS, sensors, social media...). In the see Error! Reference source not
found.Error! Reference source not found., the shadowed part illustrates the
exist-ence and needed use of unknown sources. Here, the extracted data are heterogene-ous, numerheterogene-ous, more or less reliable and time dated.
Information. This level corresponds to the contextualization of the previous data. Concretely, the information level aims at providing a state of the crisis situation in real-time. The common operational picture consists of a map where important in-stances are localized. Once implemented, this could support the decision making inside every crisis cells. A meta-model is used to standardize and facilitate this mod-elling. The information level is illustrated in white (see Error! Reference source
not found.) to show that the modeled information can be easily recover.
Knowledge. It consists of the actions to be taken, considering the crisis situation established at the information level. The actions are, for instance, part of the collab-orative process that is: (i) deduced by the GéNéPi partners; and (ii) executed by the stakeholders. There is a wide range of possibilities in the action selection process. The shadowed part illustrates the fact that some actions, unknown at the beginning, have to be discovered in time to improve the quality of the crisis response.
The following sections focus on solutions to process crisis data in real-time and ob-tain the most relevant information to be put in the situation model.
How to automatically generate the best situation model possible describing the on-going collaborative situation, while being able in real-time update to match with the innate instability of a crisis, thanks to a three-level IT system?
Fig. 1. Data, information and knowledge levels to support collaborations during crisis response.
4
Particularities of Crisis Events’ Data
Event can be understood as “the thing that happened” (as defined by Luckham & Schulte and Etzion & Niblett [11-13]). For example, it could be a tsunami, a water level reaching a threshold, the reception of an email, the new version of a web page, a com-ment on a Facebook status, etc. Here, they will be called field events. As a field event occurs or is about to occur, another one is created into an information system [14] in the shape of an object, a message or a tuple. In this paper, the last event will be called the IT event and it will at least contain:
A unique ID
The time of occurrence of the field event
A description of the field event (data or information from the field)
To generate automatically the situation model representing the collaboration on the field, the system needs to describe the context, the partners and the crisis itself. Both the context and the partners can be represented in the preparation phase. That’s why the system could focus, at first, on modelling the risks and effects of the crisis.
4.1 Overall Descriptions of the Field Events to Be Observed
To be able to avoid mistakes or delays in the generation of the common operational picture, based on the situation model, field events have to be observed through the entire Internet of Events (IoE) defined by Van Der Aalst [15]. It consists in four overlapping classes, as described in the following subsections.
The Internet of Things. This class embeds any physical object connected to the
net-work through an Internet connection or thanks to unique ID tags such as barcodes or ‘Radio frequency identification’ tags. During a crisis, identification systems, like the ‘Wireless internet information system for medical response in disasters’, are used to report victims’ position and medical record during triage [16].
The Internet of People. These data are generated from social interactions between
people. It can be e-mails, messages sent through social networks such as Facebook, Twitter or Instagram. During a crisis, people tend to focus on social media to communi-cate, or to be informed on the on-going crisis, because of the 1-to-n principle: post only one message on Twitter and n followers will be warned at the same time. This emergent crowdsourcing is particularly interesting in the context of crisis management to support context awareness [17].
The Internet of Locations. It includes any data with a spatial dimension. For instance,
Tweets, Facebook posts, even pictures can embed geospatial attributes through the ge-olocation service provided by modern smartphones and cameras. During a crisis, a sig-nificant percentage (49% according to Kouadia and Douvinet [18]) of the potential vic-tims has a smartphone and can be localized on a map. This crisis representation can therefore be used as a common operational picture to support local decision-making inside the crisis cells.
The Internet of content. It represents the information created by humans, like web
pages, Wikipedia, YouTube, news feeds. During a crisis, official recommendations to assist victims could be transmitted directly to on-site people wanting to help, etc.
As van der Aalst [19] pointed out, event data is the major source of information. Therefore, all these available events are numerous and the data and information they contain is more or less reliable, comes from varied sources, in various types and format, and are time-dated.
4.2 Issues Due to the Volume, Variety, Velocity and Veracity of the Data Coming from the Field
Available events describe data and information coming from outside as from: the crisis field, upper crisis cells, lower crisis cells or the Internet. This section describes the characteristics of those heterogeneous inputs. It will focus on data features because an information from one person can be considered as a data by another [20].
The Volume. It refers to the quantity of data generated continuously per time unit. The
volume is proportional to the size of the data [21] and therefore to the type of data [22]. A balance has to be found between widening the influence zone and spending energy to process data in time. Yet, the more data, the more creation of hidden information and patterns the decision makers will get [23]. And as the time passes by, the volume of available data continues increasing while the available capacity to process them stays the same [24].
The Variety. It refers to the diversity of data types, as videos or data logs [22-27], and
data formats (Either structured, unstructured, semi-structured or mixed data set.), as structured or unstructured sets [21], [23]. Bypass issues linked to variety is possible thanks to metadata identifying what is contained in the actual data [22], even though a lot of details are lost in the process.
The Velocity. It refers to the speed needed to retrieve and process data in time [22, 24,
25, 27]. To avoid losing data, which could be essential to infer critical information for the decision makers, it is crucial to improve the swiftness of all the analysis’ steps [28]. Velocity also refers to how quickly the data is generated [21, 24, 27].
The Veracity. It refers to the reliability, accuracy, consistency and security of data [20,
21, 29]. Lukoianova & Rubin [20] also identify objectivity, truthfulness and credibility as three complementary dimensions of veracity. As an illustration, the Error!
Refer-ence source not found. represents four blind monks. If they keep their own data
with-out sharing, they will see elephants as hoses, walls, trees or ropes…
Fig. 2. The blind monks and the elephant [30].
Rajaraman & Ullman [30] go further by assuming that the studied situation changes constantly (as a crisis situation should). The analysis process has then to aggregate het-erogeneous data from as many diverse sources as possible (blind men) to generate the
most reliable situation model (shape and gesture of the elephant) in real-time (because of the changes).
At last, one of the goals of event processing is to improve and favor the value of the data inside the system. This value generally decreases in proportion to the age, the type, the richness and quantity of the element in the system [28]. The veracity and variety should be considered when computing the value of the data or when analyzing the data [20, 28].
To sum up, in order to offer the decision-makers the best common operational pic-ture possible, the three-level IT system will have to process numerous, varied, more or less reliable data, in time, during a crisis situation. This is known as Big Data issues.
How to automatically generate the best situation model possible describing the on-going collaborative situation, while being on real-time update to match with the innate instability of a crisis, thanks to a three-level IT system that manages all the issues linked to crisis ‘Big’ data features?
5
Approaches to Generating Situation Models from Raw
Data
According to the descriptions of data features above, a good analysis tool has to access as many events as possible (volume, velocity), from heterogeneous sources (variety). It also has to compute the veracity and value of every data inside the system. If not, the data will be used randomly. Methodologies covering at least one of these points already exist. This section presents two of them.
5.1 General Approaches Talking Down at Least One of the 4Vs’ Issues KDD - Fayyad. [31]. The knowledge discovery in structured data base process has
been set up to map low-level data, too voluminous to be easily aggregated. The process use patterns to link data together. These patterns have to be validated (veracity) and potentially useful (value). The whole process is made up of five main steps [29]: Data selection: Focus on a subset, on a sample to improve the performance of the
system;
Data preprocessing: Clean data by using pre-defined operations to remove noise, handle missing data, etc.;
Data transformation: Identify useful features to represent data and achieve the us-ers’ goals;
Data mining: Match the users’ goals to a particular data mining method such as summarization, classification, regression, clustering, etc. Search for patterns by ap-plying the closed method;
Patterns interpretation/evaluation: Interpret mined pattern and resolve potential conflicts thanks to visualizations and the possibility of returning to any previous step.
SA – Endsley [32]. The situation awareness of a system is measured by its ability to
perceive elements in a particular environment, to understand them and project them in the future. The whole situation awareness process is therefore made up of three main stages [30]:
Perception of the elements: Observe and retrieve the status, attributes and dynamics of relevant elements on the field;
Comprehension of the current situation: Gather retrieved elements and infer new elements that convey more and more meanings for the users and their goals; Projection of future status: Foresee the evolution of the elements’ status to project
its future dynamic in the environment.
The goal is to provide the knowledge and time (velocity) required by the decision-makers, in the sight of their objectives (value).
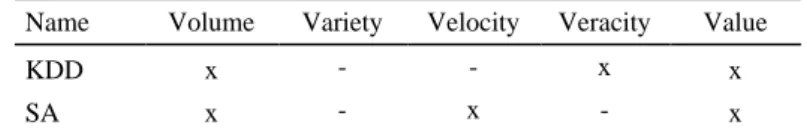
Table 1. Proposition of a particular classification along with some results (x: the V is taken into
account by the methodology, -: the V is not considerate inside the methodology) Name Volume Variety Velocity Veracity Value
KDD x - - x x
SA x - x - x
These two tools partially cover the data features issues raised earlier. The three-level IT system can therefore combine these two methodologies to support the decision-mak-ers in managing all the issues linked to a Big Data & crisis context.
5.2 A New Approach Taking Into Account All the Vs of Big Data
The GéNéPi project includes the Big Data management in the collaboration support system. Events are to be directly analyzed to generate up-to date situation models, in run time. During a crisis, these models will be used by:
Other partners to deduce and orchestrate a collaborative process between the services on the field;
Decision-makers through the generation of a common operational picture in each crisis cell to facilitate the decision-making.
The events treatment system has to take into account all the issues linked to the ‘Big Data’ features of crisis data. Thanks to the two approaches introduced in section 5.1, three of the five types of issues can be solved, at least to some extent. The five ‘opera-tions’ of the KDD approach should then be adapted to the three ‘time steps’ of the SA approach as to the three-level IT system features. Following this assumption, a new methodology has been set up inside the GéNéPi project.
The next subsections describe each step of the new approach illustrated in Error!
Extract Raw Data from the Crisis Field. As underlined before, decision makers do
not lack available data: it is recovered from the field through the reception of numerous events from diverse sources such as:
The services involved (or to be involved) in the crisis response delivering ground truth data thanks to sensors dispatched on the field;
The people taking part in the crisis response and victims of the crisis’ effects come along with their smartphone full of sensors and, as the stakeholders, their own per-ceptions. For instance, Haiti, Japan or China are known for their citizen capability to ask for help or take part in the response through social media in times of crisis [33];
The open data sources accessible through the Internet (objective or not).
Fig. 3. Data deposition: Five steps to counter the 4vs of Big Data
Only few sources are known from the crisis cells, while all the others are ready to be requested for, if discovered. Hence, to be able to discover new sources, along with their communication protocols, topics of emission and types of emitted events, a ‘scan’ of the crisis field has to be performed. The challenge is to find the key event sources [28] that is involved in inferring valuable (value) and reliable (veracity) information for the decision-makers on the crisis cells. The volume is also tackled thanks to rules that mainly filter and aggregate data. The goal is to avoid a pathological accumulation of data [28]: the “quantity vs quality” quest. As an output, the filtered and aggregated data is tagged with a use-by date to be defined for each type of event sent by the sources (velocity).
The ‘Extract’ box refers to the data selection step of the KDD approach and the perception phase of the SA approach.
Unify the Data. The variety issue is solved thanks to a unified approach of
interopera-bility [34]. This approach offers an unlimited access to the unified data from any part of the system and unable the ‘Analyze’ box to query the unified data set or the MM’s instances set, regardless of all the variety issues. This transformation implies: (i) the identification of the type of data contained in the input event; (ii) the availability of a transformation rule concerning this particular type of data. If the rule does not exist in the system, the files’ metadata can be used to get around the problem.
The ‘Unify’ box refers to the data preprocessing step of the KDD approach, adapted to unstructured data set.
Transform Instances. A data can skip the ‘Unify’ box if is already in the targeted type
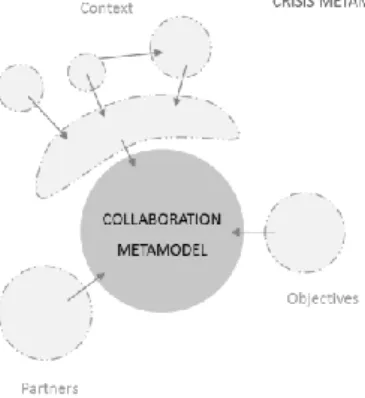
or if it is already contextualized, and in other words, if it is already an information. In the last case, if it is an instance of a known meta-model MM*, different from the sys-tem’s meta-model MM, a model transformation has to be set up [35]. Else, the infor-mation is considered as a data. The target meta-model MM, used by the system (cf. level 2 of the three-level IT system), is composed of: (i) a core (see Error! Reference
source not found.) that can describe any kind of collaboration; (ii) several layers
in-heriting from at least one core concept. The situation model, final output of the system, consists of all the instances stocked in the “MM’s instances” set (see Error! Reference
source not found.). They instantiates concepts form the triplet {Partners, Context,
Ob-jectives}:
The ‘Context’ describes the surroundings as it appears with or without the crisis. To adapt the situation model to a particular risk (as flooding or road crisis), sub-parts have been developed around the main context.
The ‘Partner’ describes the services (resp. people) available for the crisis response, along with their resources, sensors, and capabilities.
The ‘Objectives’ describes the danger, effects and risks due to crisis events and affecting one part of the context.
As underlined before, the generation of situation model in real-time mainly concerns the ‘Objectives’ part, because the others are to be prepared in advance, before the crisis. The ‘Transform’ box refers to the data transformation step of the KDD approach, adapted to unstructured data set.
Instantiate the Unified Data. The first rules to be applied on the crisis events are
busi-ness rules. An example from a French crisis management plan can be: ‘IF the predicted water level is higher than a ‘level1’ dike’s threshold (which protects big cities from flooding) and IF there is, at least, 48h left before the overrun, THEN the protected city has to be evacuated’. In the GéNéPi project, these rules are directly based on: (i) the French crisis response plans of several defense zones and counties; (ii) the experience
of the actor that have already been involved in a crisis response; (iii) the doctrines of the services that are to be involved in a crisis response. All this knowledge, answering to ‘how to respond to a crisis?’, has been recovered from interviews conducted by the CEREMA (Study & expertise center of risks, environment, mobility and development), partner in the GéNéPi project.
The ‘Instantiate’ box refers to the data mining step of the KDD approach, and to the comprehension phase of the SA approach
Fig. 4. MM meta-model
Analyze the instances. This last step enables the system to deduce information from
others thanks to modeling rules. For example, if the danger ‘Flooding’ has been deduced from the ‘Instantiate’ box, several risks have to be added on the situation model. Depending on the context, one of the new instances could be a ‘risk of victims’ linked with a school or a hospital, or a ‘risk of pollution’ linked with industries. This is possible thanks to the existence of a knowledge base, where all the rules contained in the system apply.
The ‘Analyze’ phase is also the opportunity to monitor the generation and the pro-jection of the situation model. Here, all the instances of MM and all the unified data are tag with veracity levels and value estimations. These iterations, between unified data and instances, are critical: without them, the system would be amnesic and unable to learn [21]. In this context, the research works of Lukoianova and Rubin [20] can be highlighted as they showed the possibility of measuring deception, subjectivity and credibility of certain data types. The iterations enable the system to:
Improve ‘unified data’ and ‘MM’s instances’ quality by optimizing their veracity value and value estimation;
Check whether the situation model stocked in the MM’s instances box, faithfully represents the crisis field reality;
Put aside all the event sources judged as unreliable ones;
Improve the MM meta-model’s coverage by analyzing the veracity and value of un-used ‘unified data’.
The ‘Analyze’ box refers to the evaluation step of the KDD approach, and could serve for the projection phase of the SA approach.
The five boxes of the Error! Reference source not found. enable a two-level sys-tem to deliver an organized set of information in the form of a situation model. Thanks to it, a common operational picture can be delivered and adapted to the context, objec-tives and resources of each crisis cells. Inner communications, and therefore decision-making, will be reinforced. Moreover, thanks to the GéNéPi project, collaboration pro-cesses (third level) will be deduced from this situation model, as orchestrated and main-tain all along the crisis response. These two innovations will improve the decision-makers environment by maintaining the collaboration on the field (horizontal distribu-tion) and by properly sharing information to the other crisis cells (vertical granularity).
6
Conclusion
Nowadays, more and more data sources produce more and more data each day. This is an opportunity for the crisis decision-makers to improve their own situation awareness. But, to avoid being drowned in data streams, they limit their number of accessible data sources. This situation could lead to data loss, data misjudging and outdated situation awareness. That is the reason why there is a need for data management support in the crisis response field.
The solution could be found in existing techniques coming from the industry. Alas, there is a big difference between: (i) known and unknown data sources; (ii) predictable and unpredictable use of data; (iii) finite and infinite number of relevant actions; (iv) minimize and maximize the time spent on the gathering part.
In this context, two approaches have been studied and valued considering the issues linked to crisis data features. The result of this study enables the implementation of a new approach, combining the qualities of both the Endsley’s SA and the Fayyad’s KDD.
This approach has now to be implemented in: (i) the IO Suite tool [36], enabling the collaboration support during crisis responses in the CGI laboratory of Mines d’Albi and in (ii) the GéNéPi prototype. In addition, more business rules have to be written thanks to the CEREMA partner, along with models transformation rules needed in the ‘Trans-form’ box.
In the future, such a tool, enabling the automatic generation of a situation model in real-time, whatever the complexity and instability of the context, will benefit, not only to crisis decision makers, but also to industries willing to quickly adapt in a day-to-day fashion.
References
1. Bézivin, J.. Gerbé, O.: Towards a precise definition of the OMG/MDA framework. In: 16th Annual International Conference on Automated Software Engineering (ASE 2001), pp. 273–280 (2001).
3. Dautun, C., Lacroix, B.: Placer “l’humain” au coeur des crises. LIREC 38, 10-19 (2013). 4. Endsley, M. R., Jones, W. M.: A model of inter-and intrateam situation awareness:
Implica-tions for design, training and measurement . New trends in cooperative activities: Under-standing system dynamics in complex environments 7, 46–47 (2001).
5. l’Intérieur, M. de : Lancement de l’application mobile SAIP , http://www.inte-rieur.gouv.fr/Actualites/L-actu-du-Ministere/Lancement-de-l-application-mobile-SAIP. [En ligne]. Disponible sur: http://www.interieur.gouv.fr/Actualites/L-actu-du-Minis-tere/Lancement-de-l-application-mobile-SAIP. [Consulté le: 29-juill-2016].
6. French Minister of the Interior, Mise en oeuvre de l’application SAIP le soir du 14 juillet 2016, http://www.interieur.gouv.fr/Actualites/Communiques/Mise-en-oeuvre-de-l-applica-tion-SAIP-le-soir-du-14-juillet-2016, juillet-2016. [En ligne]. Disponible sur: http://www.interieur.gouv.fr/Actualites/Communiques/Mise-en-oeuvre-de-l-application-SAIP-le-soir-du-14-juillet-2016. [Consulté le: 21-juill-2016].
7. Finn, R., Watson, H., Wadhwa, K.: Exploring big ‘crisis’ data in action: potential positive and negative externalities. In: ISCRAM Conference, Kristiansand, pp. 24–27 (2015). 8. Wang, H., Wang, S.: A knowledge management approach to data mining process for
busi-ness intelligence. Industrial Management & Data Systems 108 (5), 622–634 (2008). 9. Norheim-Hagtun, I., Meier, P.: Crowdsourcing for crisis mapping in Haiti . Innovations
5(4), 81–89 (2010).
10. Caragea, C., Squicciarini, A., Stehle, S., Neppalli K., Tapia, A.: Mapping moods: geo-mapped sentiment analysis during hurricane Sandy. In: Proc. of ISCRAM (2014). 11. Luckham, D., Schulte W. R.: Event Processing Glossary - Version 2.0 . EPTS (July 2011). 12. Etzion, O., Niblett P.: In: Event Processing in Action, 1st ed. Greenwich, CT, USA: Manning
Publications Co. (2010).
13. Chandy, K., Schulte W.: Event processing: designing IT systems for agile companies. McGraw-Hill, Inc. (2009).
14. Luckham D., Schulte, R.: Event processing glossary-version 1.1. Event Processing Tech-nical Society, 2, (2008).
15. Aalst, W. Van Der,: Process mining: discovery, conformance and enhancement of business processes. Springer Science & Business Media (2011).
16. Koenig, K. L., Schultz C. H., Koenig, K. L., Schultz C. H.: Koenig and Schultz’s Disaster Medicine: Comprehensive Principles and Practices. Cambridge University Press (2016). 17. Meier P., Digital Humanitarians: How Big Data Is Changing the Face of Humanitarian
Response. CRC Press (2015).
18. Sekedoua Kouadio, J. Les smartphones peuvent-ils aider à une meilleure remontée des don-nées en cas de crue rapide pour améliorer les systèmes d’alerte ?. BSGLg, (2015). 19. Aalst, W. M. P. van der: Data Scientist: The Engineer of the Future. In: Enterprise
Interop-erability VI, Mertins, K., Bénaben, F., Poler, R., Bourrières, J.-P., (eds.), pp. 13‑26. Cham: Springer International Publishing (2014).
20. Lukoianova, T., Rubin V. L.: Veracity roadmap: Is big data objective, truthful and credible?, Advances in Classification Research Online 24(1), 4–15, (2014).
21. Demchenko, Y., Grosso, De Laat, C., Membrey, P.: Addressing big data issues in scientific data infrastructure. In: 2013 International Conference on Collaboration Technologies and
Systems (CTS), pp. 48–55 (2013).
22. Krishnan K.: Data warehousing in the age of big data. Newnes (2013).
23. Hashem, I. A. T., Yaqoob, I., Anuar, N. B., Mokhtar, S., Gani, A., Khan, S. U.: The rise of “big data” on cloud computing: Review and open research issues. Information Systems 47, 98–115 (2015).
24. Fan W., Bifet, A.: Mining big data: current status, and forecast to the future. ACM sIGKDD
Explorations Newsletter 14 (2), 1–5 (2013).
25. Chalmers S., Bothorel, C., Clemente, R. P.: Big Data-State of the Art (2013).
26. Ohlhorst, F. J.: Big data analytics: turning big data into big money. John Wiley & Sons (2012).
27. Power, D. J.: Using ‘Big Data’for analytics and decision support. Journal of Decision
Sys-tems 23 (2), 222–228 (2014).
28. Kaisler, S., Armour, F., Espinosa, J. A., Money, W.: Big data: Issues and challenges moving forward. In: 46th Hawaii International Conference on System Sciences, pp. 995–1004 (2013).
29. Gantz, J., Reinsel, D.: Extracting value from chaos. IDC iView 1142, 1–12 (2011). 30. Rajaraman, A., Ullman, J. D.: Mining of massive datasets. vol. 1. Cambridge University
Press Cambridge (2012).
31. Fayyad, U., Piatetsky-Shapiro, G., Smyth, P.: From data mining to knowledge discovery in databases, AI magazine 17 (3), 37 (1996).
32. Endsley, M. R.: Toward a Theory of Situation Awareness in Dynamic Systems. Human
Fac-tors: The Journal of the Human Factors and Ergonomics Society 37 (1), 32‑64 (1995).
33. Ling, C. L. M., Pan, S. L., Ractham, P., Kaewkitipong, L.: ICT-enabled community empow-erment in crisis response: Social media in Thailand flooding 2011. Journal of the
Associa-tion for InformaAssocia-tion Systems 16 (3), 174 (2015).
34. Chen, D., Doumeingts, G., Vernadat, F.: Architectures for enterprise integration and interop-erability: Past, present and future. Computers in Industry 59 (7), 647‑659 (2008). 35. Wang, T., Truptil, S., Benaben, F.: An automatic model-to-model mapping and
transfor-mation methodology to serve model-based systems engineering. Inf Syst E-Bus Manage, 1‑54 (2016).
36. Bénaben, F., Lauras, M., Truptil, S., Salatge, N.: A Metamodel for Knowledge Management in Crisis Management. In: 49th Hawaii International Conference on System Sciences, pp. 126‑135 (2016).

![Fig. 2. The blind monks and the elephant [30].](https://thumb-eu.123doks.com/thumbv2/123doknet/11621134.304433/9.892.252.653.704.927/fig-blind-monks-elephant.webp)