HAL Id: hal-02183429
https://hal.archives-ouvertes.fr/hal-02183429
Submitted on 10 Sep 2019
HAL is a multi-disciplinary open access
archive for the deposit and dissemination of
sci-entific research documents, whether they are
pub-lished or not. The documents may come from
teaching and research institutions in France or
abroad, or from public or private research centers.
L’archive ouverte pluridisciplinaire HAL, est
destinée au dépôt et à la diffusion de documents
scientifiques de niveau recherche, publiés ou non,
émanant des établissements d’enseignement et de
recherche français ou étrangers, des laboratoires
publics ou privés.
Modeling of the signal of a resistive soot sensor,
influence of the soot nature and of the polarization
voltage
Didier Grondin, Philippe Breuil, Jean-Paul Viricelle, Philippe Vernoux
To cite this version:
Didier Grondin, Philippe Breuil, Jean-Paul Viricelle, Philippe Vernoux. Modeling of the signal of
a resistive soot sensor, influence of the soot nature and of the polarization voltage. Sensors and
Actuators B: Chemical, Elsevier, 2019, 298, pp.126820. �10.1016/j.snb.2019.126820�. �hal-02183429�
Modeling of the signal of a resistive soot sensor, influence of the soot nature and of the
polarization voltage.
D. Grondina,b, P. Breuila, J. P. Viricellea , P. Vernouxb
aMines Saint-Etienne, Univ Lyon, CNRS, UMR 5307 LGF, Centre SPIN, F - 42023 Saint-Etienne, France bUniversité de Lyon, Institut de Recherches sur la Catalyse et l’Environnement de Lyon, UMR 5256, CNRS, Université
Claude Bernard Lyon 1, 2 avenue A. Einstein, 69626 Villeurbanne, France
Abstract
Resistive soot sensors capable of measuring the mass concentration of particles in an exhaust pipe have been developed in a previous work. In particular, it has been shown that these sensors have an optimal sensitivity for a certain polarization voltage depending on the nature of the particles.
This work shows that this effect can be explained by an equilibrium between the creation of soot bridges between the two collecting electrodes and their destruction initiated by Joule effect due to the polarization voltage. Based on this assumption, a model is proposed to predict the load curve (response versus time) of the sensor.
In addition, the high frequency sampling of the sensor response has revealed some jumps of the sensor response (electrical conductance), which are exploited through a statistical approach to obtain additional information on the nature of the collected particles.
Keywords
Soot sensor, Resistive sensor, electrical conductivity, Joule effect
1. Introduction
Impact of vehicles exhaust, especially diesel particle matter, on health and environment has been clearly evidenced, with possible carcinogenic effects [1]. To limit diesel engine emissions, new legislation has emerged. On-board diagnosis sensors able to detect diesel particulate filter failures are required. Therefore, the development of a cheap sensor effective for the measurement of mass concentration is necessary.
Among the available technologies to measure soot concentration, resistive soot sensors are a realistic solution for a massive industrialization due to similarities concerning material and technology with lambda sensor and their robustness to withstand the hard conditions found in exhaust [2-6]. This type of sensor allows the measurement of the electrical conductance (or resistance) of the deposited soot, and their periodical thermal regeneration. Indeed, as soot is mainly composed of carbon, particles are conductive. The conductance between platinum electrodes (sensor response) as a function of time increases under a particles flow with soot deposition. At the beginning of the loading, the slope of the curve of the conductance (resistance, or current) over the time is approximately proportional to the soot deposit, itself representative of mass concentration [4, 9]. This approach needs a regular self-cleaning of the sensor by burning the deposited soot thanks to a platinum “heater”.
Such a resistive soot sensor was developed and extensively studied in previous works [6-10]. It has been shown that when a significant polarization voltage is applied, which value depends on the sensor geometry, soot bridges are formed between the electrodes contrary to a continuous soot layer deposited with no or low polarization. These “dendrite-like” paths improve the sensitivity of the sensor [5-8].
Up to an optimal polarization voltage, the sensitivity increases with this voltage, which is explained by electrophoresis phenomena [11].
However, performances are degraded as shown on Figure 1 (sensitivity decrease, noisy signal), beyond the optimal polarization value [7-9]. The conductance variation versus time strongly depends on the polarization voltage. Using various operating point to generate soot, it was also demonstrated that this optimum value is dependent on the soot characteristics, such as their chemical nature and size distribution [7, 9].
Figure 1: Conductance variation versus time for different polarization voltages under a fixed operation point, OP1 (from [8]).
A first objective of this study is the comprehension of this phenomenon (optimal polarization value), its exploitation in order to model the loading of such a sensor. Moreover, from European emission standard “Euro 5”, legislation of limits for diesel engine take into consideration the particulate number of emitted soot in addition to their mass. Therefore, a second objective is to improve the measurement method of the sensor resistance in order to obtain additional information on emitted soots.
2. Experimental
The sensor (Figure 2) as well as the emission and measurement devices are briefly described here; more details can be found in previous publications [7-10]. The sensors consist in an alumina substrate with two platinum interdigitated electrodes, the space between electrode is 20 µm. A platinum resistance heater on the other side is used for periodic regeneration.
Figure 2: Exploded view of resistive soot sensor.
The sensor was tested on a synthetic gas bench. Soot was produced by the combustion of a mixture of propane/air thank to the mini Combustion Aerosol Standard (CAST) burner (Jing Ltd. Switzerland).
Four operating points (OP) were used to produce different soot flux, named OP1, OP1b, OP4 and OP5. Two OPs (OP1 and OP1b) correspond to the same richness but with lower propane and air flows for OP1b, giving the possibility to have two different concentrations of identical particles (chemical nature and size distribution). The tests were performed with gas temperature of 180°C during steady state emission of the selected OP. No heating is applied to the sensor during soot deposition period, so that the device temperature is supposed to be that of the gas,180°C. The particle size and their mass concentration were respectively measured with an EEPS (Exhaust Particle Size Spectrometer, model 3090, TSI Inc) and a PEGASOR particle sensor analyzer [7, 9]. The voltage between the sensor electrodes was applied with a Picometer-Source Keithley 6430. High sampling frequency measurement of the electrical conductivity was performed with a resistor bridge and a National Instruments NI-PCI-6034 acquisition card [9]. The sensor was exposed to soot flow with its sensing element opposite to the particle stream in order to avoid direct impacts, and without any protection cap.
Operating Point Richness of propane/air mixture Temperature of starting oxidation Maximum of size distribution Mass concentration Electrical conductivity(T=25°C) Conductivity temperature coefficient “a” Optimal polarization voltage unit °C nm mg/m3 S/m °C-1 V OP1 0.97 525 90 94 200 2.10-3 30 OP1b “ “ “ 61 “ “ “ OP4 1.00 496 70 91 8.0 5.10-3 60 OP5 1.02 326 50 55 0.3 0.075 >150
Table 1: Properties of soots generated with four different Operating Points (OP)
Ex-situ characterizations of soots were also performed. Electrical conductivity was measured at ambient temperature, after their collection at the test bench outlet, their shaping as powder bed and an applied mechanical pressure of 5.6 MPa. Soot electrical conductivity increases with temperature, and a simplified assumption that a linear relationship exists in order to define the conductivity temperature coefficient “a”. This coefficient was determined by heating previously loaded sensors, and measuring conductance variation as a function of temperature [9]. The temperature of starting oxidation was determined with TPO (Temperature Programmed Oxidation) experiments. Information’s on operating points (OP) and corresponding soot properties summarized in Table 1.
3. Results and discussion
3.1. Soot bridges destruction by Joule effect
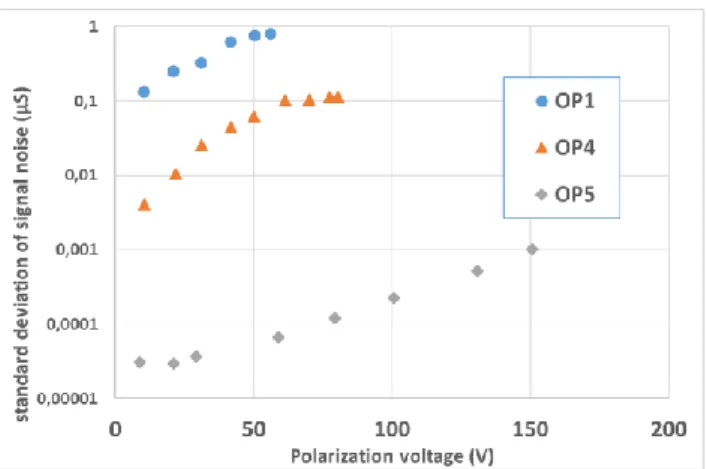
A detailed examination of the conductance curves obtained at different polarization voltage (Figure 1) reveals that some "noise" is present for measurements made above the optimum voltage (30V for OP1). In order to quantify this “noise”, its standard deviation was calculated, considering only the sensor response after the percolation time. Figure 3 shows that the “noise” standard deviation increases with the polarization voltage.
Figure 3: Evolution of the standard deviation of conductance signal noise as a function of the polarization voltage for 3 operating points (OP1, 4 and 5).
As the “noise” depends both on polarization voltage and operation point, it can be assumed that it does not correspond to a « measurement noise » (signal acquisition), but has a physical origin. These sudden variations in electrical conductivity may be correlated to the creation or destruction of soot bridges between the two electrodes. To support such an explanation, a first hypothesis is that the destruction of the bridges is due to their combustion, initiated by their heating by Joule effect due to the polarization voltage. The electrical power due to Joule effect is indeed proportional to the square of the polarization voltage. Past TPO measurements [7] highlighted the sudden soot oxidation under air above a temperature depending on the Operating Point, for example 525°C for OP1 (Table 1). Therefore, we assume that the loss of sensitivity for high polarization voltages is due to the destruction of bridges by Joule-initiated combustion.
Moreover, it must be noted that bridge temperature is not the average temperature of the substrate of the sensor, which is measured thanks to the platinum heater (figure 2) and remains very close to the gas temperature (180°C). Recently, Hagen et al [12] showed that thermophoresis can explain loss of sensitivity for polarization voltage high enough to induce overheating by Joule effect. We were able to verify that this effect is indeed present for overheating above 10°C. But such an overheating Joule effect needs a power higher than 100 mW (the static gain of our sensor is about 100°C/W), and can only be achieved with high soot loads of the sensor with OP1 soots (soots with high electrical conductivity). This effect cannot explain the decrease in sensitivity for high polarization voltages, also observed at the beginning of the loading, or for soots with low electrical conductivity (OP4 or OP5). To validate our hypothesis, the polarization voltage of a preloaded sensor (OP1) set at 180°C (gas temperature), in air, was gradually increased. An irreversible conductance drop was observed beyond 35V under air, or 40V under nitrogen with low residual oxygen concentration (Figure 4), demonstrating that soot bridges are destroyed in the presence of oxygen when applying a high polarization voltage.
Figure 4: Evolution of the conductance, at ambient, of a pre-loaded sensor (under OP1 with a polarization voltage of 30V) subjected to a voltage ramp from 30 V to 80 V at 24 V/min. Plain line corresponds to measurements made under
a flow of 450 l/h air and dashed line to a flow of 450 l/h nitrogen (and low residual O2 concentration) with gases at
180°C.
In previous works [8, 9], some optical observations (optical microscopy and avalanche photodiode) revealed light flashes on a pre-loaded sample to which a polarization voltage ramp is applied. Furthermore, strong correlations were observed between these flashes and conductance steps, both being measured with a high sampling frequency.
These results prove the destruction of soot bridges by combustion ignited by Joule effect and also explain the observed optimum value. Indeed, from a certain thermal power supplied by Joule effect, a part of the bridges formed by the particles begins to burn with light emission.
Previous interpretation of soot bridge destruction by Joule effect was also supported by thermal modeling of a bridge. In the case of OP1, we demonstrated [9] that 30V polarization which is the optimal voltage is sufficient to reach a temperature higher than 550°C, thus higher than the starting oxidation temperature identified by TPO (table 1).
This calculation, performed by finite differences model, is based on the following assumptions:
Each bridge is assimilated to a cylinder with a diameter of 20 nm (according to transmission electron microscopy pictures [7]) and a length of 20 µm (distance between electrodes).
Heating is due to Joule effect, the electrical conductivity at ambient temperature being between 200 S/m (for OP1) and 0.3 S/m (for OP5), and increases linearly with temperature.
Cooling occurs by convection (coefficient 100W/m2/°C), radiation of the black body and thermal
conductivity towards the bridge connected with platinum electrodes, this last term being largely preponderant thanks to the high thermal conductivity of carbon. However, this parameter that we could not measure is estimated with high uncertainty (between 100 and 1500 Wm-1K-1 [13]).
Ambient temperature is 180°C, set by gas flow.
Simulations have been done with large range of parameters, mainly for those having a strong influence like thermal conductivity, electrical conductivity and its temperature coefficient and of course the polarization voltage. Bridges diameter and convection coefficient have a more limited influence. Figure 5 relates a simulation with parameters close to those of OP1, with various soot thermal conductivities. It shows that the temperatures in the middle of the bridge are compatible with a destruction by Joule effect (higher than 550°C). The thermal time constant of a bridge is in the range of a few microseconds.
As a conclusion, both experiments and thermal modeling support the mechanism of soot bridge building and destruction depending on polarization voltage.
Figure 5 : Thermal modeling in a soot bridge (relating to OP1 condition) with various thermal conductivities “k” of soot; a) : Temperature profile between electrodes, b): Maximal temperature (middle of the bridge) versus polarization
voltage
3.2 Sensor loading dynamic modeling
Then, the second part of the study consists in modeling the sensor signal subjected to a concentration step. The starting hypothesis is that the sensor loading is the result of two competitive phenomena: the formation and the destruction of bridges (Joule effect) on the surface of the sensor, both function of the polarization voltage leading to an electric field between the collecting electrodes. When a sensor is loaded during a long time under fixed deposition conditions (in the range of the hour with OP1 or OP4 mode), a conductance asymptote is reached, the value of which depends on the applied polarization voltage (Figure 6). It means that a steady state occurs, where the rate of bridge creation becomes equal to the destruction one.
Figure 6: Sensor loading curves (conductivity versus time). Soot flow at 180°C, with different polarization voltages for OP1 and OP4. Arrows indicate the area of high frequency signal processing (&3.3)
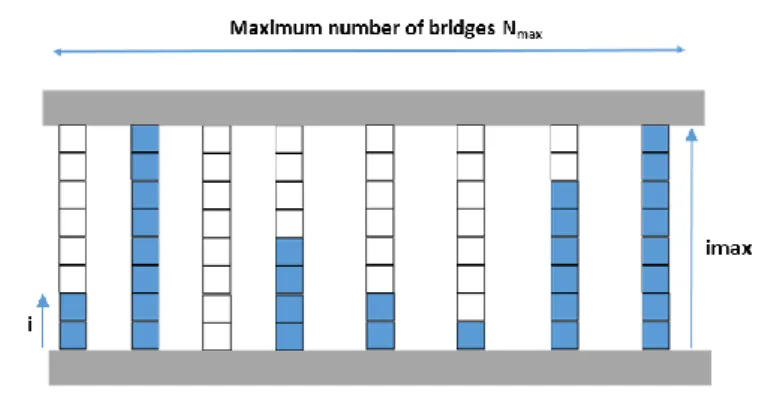
We therefore attempted to model this transition phase by differential equations corresponding to loading and destruction phenomena. The first step of the model consists in simplified assumptions with a schematic representation of soot bridges summarized in Figure 7:
Figure 7 : Schematic model of soot loading considering bridges building and destruction between electrodes
1. Each bridge is composed of imax elementary particles (depending on particle size and electrode
distance). We define Ni as the number of bridges under construction with i particles or more, then 0 ≤ i
2. The maximum number of possible full bridges Nmax, or number of slots (origin of bridge building due to
electrode irregular surface [8]), is constant, and Nmax=N0.
3. These soot bridges can be assimilated to identical resistances (G0) in parallel. Thus, we assume that the
measured electrical conductivity (G) increases linearly with the number of bridges (Nimax) joining the
two measuring electrodes:
𝐺 = 𝑁𝑖𝑚𝑎𝑥. 𝐺0, where G0 is the conductance of one bridge.
When all bridges are constructed, Nimax = Nmax , the maximum conductance Gmax is obtained:
𝐺𝑚𝑎𝑥= 𝑁𝑚𝑎𝑥. 𝐺0.
3.2.1 Model without bridge destruction and without electrical field effect
To initiate the model, we will first assume that there is no destruction and that the probability of capture of an additional particle on a bridge under construction is constant (no effect of electrical field depending on the number i of particles already present in the considered bridge). With such hypothesis, the rate of formation of bridges with i particles is proportional to the number of “slots” with i-1 particles, so to (Ni-1 – Ni):
𝑑𝑁𝑖
𝑑𝑡 = 𝑘(𝑁𝑖−1− 𝑁𝑖), Equation 1
or, with Laplace formalism: 𝑠𝑁𝑖= 𝑘(𝑁𝑖−1− 𝑁𝑖) Equation 2 Then, 𝑁𝑖(𝑠) =𝑁𝑖−11+𝑠(𝑠) 𝑘 and 𝑁𝑖𝑚𝑎𝑥(𝑠) =(1+𝑁𝑠0(𝑠) 𝑘)𝑖𝑚𝑎𝑥 = 𝑁𝑚𝑎𝑥
(1+𝑠𝑘)𝑖𝑚𝑎𝑥 which is proportional to the Laplace transform
of the electrical conductivity G(s). In order to calculate Nimax(t), the temporal response to a step of particles
concentration, we must compute the inverse Laplace transform of 1
𝑠𝑁𝑖𝑚𝑎𝑥(𝑠) = 𝑁𝑚𝑎𝑥 𝑠(1+𝑘𝑠)𝑖𝑚𝑎𝑥,.
This can be done with the help of Laplace transform table ([14], p 1020-1022):
𝑁𝑖𝑚𝑎𝑥(𝑡) = 𝑁𝑚𝑎𝑥(1 −Γ(𝑖𝑚𝑎𝑥,𝑘𝑡)imax! ) , where Γ(𝑖, 𝑘𝑡) is the “incomplete gamma function”.
The calculation of this function allows to represent the ratio “Nimax / Nmax” which is equal to ratio “G / Gmax”
according to previous definitions, and represents the normalized sensor signal in regards of the maximum conductance value, which depends on imax (Figure 8
Figure 8 : Simulation of normalized conductance (Nimax / Nmax = G / Gmax) versus time with hypothesis of no bridge
This first simplified model (only 2 parameters, imax and Nmax) can explain the shape of some load curves with low
polarization voltage (Figure 6), including the “percolation time”. As imax is related to the particle size in the model (Figure 7), supposing a monodisperse population of particles, Figure 8 also proves that the sensor response versus time is strongly dependent on this parameter. The higher imax is, corresponding to smaller particles in our model, the higher the percolation time is.
3.2.2
Model with bridge destruction and electrical field effect
To improve the previous model, an additional term of bridges destruction was considered, proportional to the number of complete bridges Nimax (because only these bridges can be destroyed by Joule effect) and to a constant
h:
Equation 1 becomes: 𝑑𝑁𝑑𝑡𝑖= 𝑘(𝑁𝑖−1− 𝑁𝑖) − ℎ𝑁𝑖𝑚𝑎𝑥 Equation 3
Moreover, a second implementation concerns the influence of electrical field due to polarization. It is assumed that the creation rate is proportional to the electric field, then inversely proportional to the free space between an incomplete bridge and the electrode, which is itself proportional to (imax-i):
Equation 3 becomes: 𝑑𝑁𝑖
𝑑𝑡 = 𝑘
𝑖𝑚𝑎𝑥−𝑖(𝑁𝑖−1− 𝑁𝑖) − ℎ𝑁𝑖𝑚𝑎𝑥 Equation 4
or, with Laplace formalism:
𝑠𝑁𝑖=𝑖𝑚𝑎𝑥−𝑖𝑘 (𝑁𝑖−1− 𝑁𝑖) - ℎ𝑁𝑖𝑚𝑎𝑥 Equation 5
A system of imax equations with imax unknown values (N1 to Nimax) is obtained, and the objective is the determination
of the expression of Nimax, proportional to the conductance.
This system cannot be solved in a general case, but only for particular imax values. This resolution can be done
with a formal calculation tool, such as MuPAD, a toolbox of MATLAB. For example, for imax=3, the system can be written with MuPAD as:
solve([s*N1=k*N0-k*N1-h*N3,s*N2=3/2*k*N1-3/2*k*N2-h*N3,s*N3=3*k*N2-3*k*N3-h*N3],[N1,N2,N3]) and the solution is: 𝑁3(𝑠) = 9𝑘
3𝑁0
9𝑘3+18𝑘2𝑠+18ℎ𝑘2+11𝑘𝑠2+11ℎ𝑘𝑠+2ℎ𝑠2 Equation 6
The temporal step response will be the inverse transform of 1
𝑠𝑁𝑖𝑚𝑎𝑥(𝑠), which can be computed with the
MATLAB command “step”.
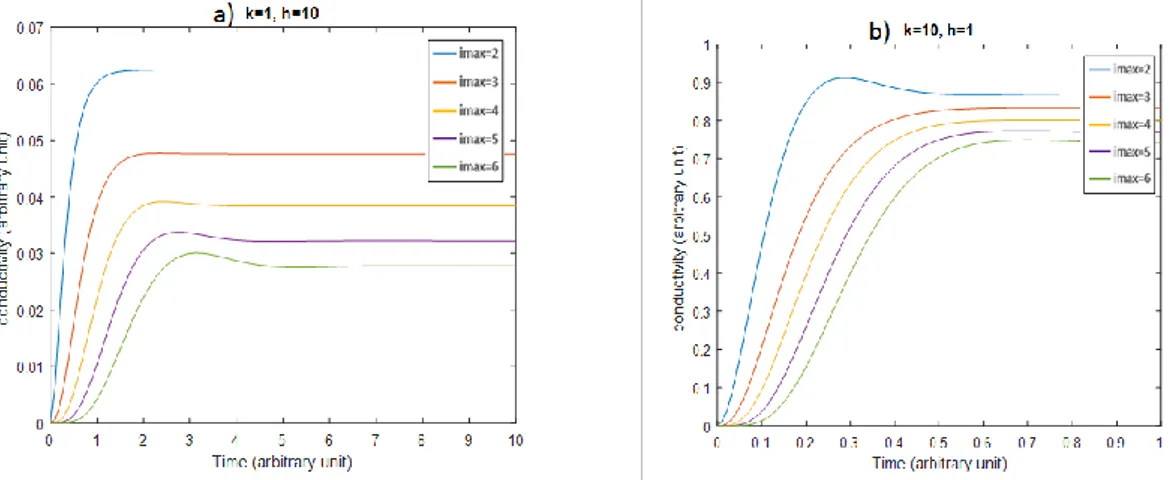
In Figure 9, simulated profiles of conductance versus time are represented for imax between 2 and 6, with k=1
Figure 9: Simulation of conductance for different values of imax, with: a): k=1 (construction) and h=10 (destruction)
and b): reverse situation (k=10, h=1)
It has been checked that, for lots of combinations of k and h, the step response to a concentration of particles is the same than the previous model (including the “percolation time”), but sometimes with damped oscillations, which is a consequence of combined imaginary poles in the expression of the equation 6.
These damped oscillations are observed for long loading experiments, with polarization higher than the optimal voltage, when the “Joule effect destruction” becomes important. For example, in Figure 6, a damped oscillation can be seen for OP1 with 60V polarization (optimal polarization 30V), and there is no oscillation for PF4 at 60V (optimal polarization 60V).
It is interesting to note that M. Maricq et al [15], with a sensor of a different type (electrostatic), studied the dynamic of creation-destruction of dendrites and obtained the same type of equations and experimental results, including damped oscillations.
3.3 Statistical study of “conductance jumps”
When the electrical conductance signal is sampled at a sufficiently high frequency (5 to 10 kHz)during stationary state (about 50 minutes of loading), some “conductance jumps” attributed to bridge creation (positive jump) or destruction (negative jump) can be visualized (Figure 10). Hopefully, a statistical study of these steps may provide interesting information on the quantity and nature of the particles.
3.3.1 Signal treatment – Jump counting
In order to count these jumps correctly, it is necessary to filter out the "useful" noise (steps) from the background noise of the instrumentation. Because of the specific form of this information (sudden jumps), a classic low-pass filtering in the frequency domain is not very efficient. On the other hand, wavelet filtering preserves the shape of the "useful" steps. For this treatment, the Haar wave family has been chosen because of its "stair step" profile, which allows a simpler signal reproduction [15-16]. Details on this filtering may be found in [9]
Figure 10: High sampling frequency acquisition (5 kHz) for OP1 and OP4 at 60 V, stationnary state (about 50 minutes after beginning). Mean value of conductance is substracted (113µS for OP1 and 106 µS for OP4), “Wavelet filtered”
signals.
After this filtering, a step detection algorithm, based on threshold detection of the signal derivative, counts the positive and negative steps. Finally, only steps above a threshold in absolute value (0.02 µS) are retained. The stationary part of the signal was investigated. Figure 6 shows the conductance curves used for counting jumps. We have studied samples lasting 200 seconds, the beginning of which is indicated by a black arrow in Figure 10. Two experiments with different concentrations of the same particles (OP1 and OP1b) and two experiments with different types of particles (OP1 and OP4) have been compared. The presented data are averaged over 1 second (Figure 11)
3.3.2 Effect of soot concentration on steps number (OP1, OP1b)
Subsequently, in order to determine the effect of particles concentration, OP1 and OP1b were compared, at identical polarization (30 V). These two modes produce the same type of particles but at different concentrations of about 30% (table 1). The steps distributions (number of steps per second as a function of steps height) calculated from Figure 10 are shown in Figure 11 a.
Figure 11: Frequency histogram of the heights of the steps of conductivity per second, calculated from experimental results, a): OP1 and OP1b modes, 30 V, b): OP1 and OP4 modes, 60 V.
First, we can notice that the number of positive steps is approximately equal to the number of negative steps, which is normal since the sensor is in a stationary state (as much creations as destructions). Finally, the number of steps for OP1 is about 30% higher than for OP1b, which is close to the ratio of the concentrations between these two modes. The average height of these steps can be calculated and is represented in Figure 12a.
Figure 12: Average height of the steps (a) OP1 and OP1b, 30V (b) OP1 and OP4, 60V.
The average height of the steps with OP1 or OP1b at 30 V is around 0.04 µS, which can therefore be considered as the order of magnitude of the electrical conductance of one "OP1" bridge at 180°C. This value is compatible with the counting of bridges made from a scanning microscopy photograph (about 5000) of a previously charged sensor (OP1, 30V), for which electrical conductance between electrodes is about 200 µS at 180°C, leading to an average conductance of 0,04µS for one soot bridge.
Therefore, the number of steps seems to be proportional to the soots concentration, while the average step is independent on this concentration, but it depends on the soot nature as discussed hereafter.
3.3.3 Influence of particle type (OP1, OP4)
With particles of different nature (OP1 and OP4) and identical measuring conditions (same polarization voltage, 60V), we observe a significant difference between the high sampling frequency conductance, although these two OPs have similar soot mass concentration: OP1 steps have a greater amplitude (Figure 10). This observation is confirmed by the step distribution (Figure 11b) and especially by the calculated average height of the steps (Figure 12b), where a more large difference between the two operating modes is observed. For OP1, 60V is quite higher than the optimal polarization voltage, contrary to OP4, explaining a quite larger jump frequency due to bridges destruction. For the average jump height, since we have previously seen that this parameter is independent on concentration, this information enables us to discriminate between two different types of particles: this difference being due to both the geometry of the particles and their electrical conductivity.
4 – Conclusions
This study is based on the properties of a resistive particle sensor exposed to different types of particles with different polarization voltages.
Experimental results (shape of the load curve, noise measurement, optical measurements) can be explained by a phenomenon of creation - destruction of particles bridges between the two electrodes. The creation is favored by the electric field whereas the destruction is due to combustion initiated by the Joule effect due to the polarization voltage. A simplified thermal modeling validates this assumption. Another model, based on the resolution of differential equations of creation - destruction of bridges, explain the shape of the load curves, including the "percolation time" as well as some observed oscillations.
Finally, high frequency electrical conductivity acquisitions allowed observing these creations - destructions in real time, while wavelet-based processing and filtering makes it possible to count them. An adequate statistical study (measurement of the average height of the steps of electrical conductance) enables to characterize the nature of soots independently of their concentration. Such a model and signal exploitation open the possibility of measuring the number of particles independently of their mass concentration, which is required by the most recent emission standards.
Acknowledgements
The authors wish to acknowledge “Arc Environnement” from Region Auvergne Rhone-Alpes for the funding and EFI Automotive, automotive supplier, for providing prototype sensors.
References
[1] International Agency for Research on Cancer, Diesel and Gasoline Engine Exhausts and Some Nitroarenes, 2013, https://monographs.iarc.fr/wp-content/uploads/2018/06/mono105.pdf (accessed may 2019).
[2] G. Hagen, C. Feistkorn, S. Wiegärtner, A. Heinrich, D. Brüggemann, R. Moos, Conductometric soot sensor for automotive exhausts: initial studies, Sensors 10 (2010) 1589–1598, http://dx.doi.org/10.3390/s100301589. [3] B. Grob, J. Schmid, N.P. Ivleva, R. Niessner, Conductivity for soot sensing: possibilities and limitations, Anal. Chem. 84 (2012) 3586–3592, http://dx.doi. org/10.1021/ac203152z.
[4] O. Brunel, F. Duault, J. Lavy, Y. Creff, B. Youssef, SAE International Journal of Passenger Cars - Electronic and Electrical Systems 6 (2013) 307–327.
[5] T. Ochs, H. Schittenhelm, A. Genssle, B. Kamp, Particulate matter sensor for on board diagnostics (OBD) of diesel particulate filters (DPF), SAE Int. J. Fuels Lubr. 3 (2010) 61–69, http://dx.doi.org/10.4271/2010-01-0307. [6] J. Noulette, F. Duault, Sonde de mesure de depot de suie dans l’echappement et son procede de fabrication WO2014044965 A1, http://www.google.com/ patents/WO2014044965A1, 2014.
[7] D.Grondin, A.Westermann, P.Breuil, J.P.Viricelle, P.Vernoux , Influence of key parameters on the response of a resistive soot sensor, Sensors and Actuators B 236 (2016) 1036–1043, https://doi.org/10.1016/j.snb.2016.05.049
[8] D.Grondin, S. Geara, P.Breuil, J.P.Viricelle, P.Vernoux, Influence of electrodes polarization on the response of resistive soot sensor, Procedia Engineering 168 (2016) 31-34. https://doi.org/10.1016/j.proeng.2016.11.124 [9] D. Grondin PhD. Développement d’un capteur de suies pour application automobile - Etude des paramètres
clés affectant sa réponse. Université de Lyon, 2017. France. https://tel.archives-ouvertes.fr/tel-01823856/document
[10] Patent pending N°FR1756750, Système de caractérisation de nanoparticules conductrices, 2018
[11] Pavlos Fragkiadoulakis, Savas Geivanidis, Zissis Samaras, Modeling a resistive soot sensor by particle deposition mechanisms, Journal of Aerosol Science 123 (2018) 76–90.
[12] G. Hagen, C. Spannbauer, M. Feulner, J. Kita, A. Müller and R. Moos, Conductometric Soot Sensors: Internally caused thermophoresis as an important undesired side effect, Sensors 2018, 18(10), 3531; https://doi.org/10.3390/s18103531
[13] N. K. Mahanta et al., Thermal conductivity of carbon nanofiber mats , Carbon, vol. 48, no 15, p. 4457‑4465, déc. 2010.
[14] M. Abramovitz, I Stegun, Handbook of Mathematical Functions with Formulas, Graphs, and Mathematical Tables, Cambridge University Press, 2010.
[15] M. Matti Maricq , David Bilby, The impact of voltage and flow on the electrostatic soot sensor and the implications for its use as a diesel particulate filter monitor, Journal of Aerosol Science 124 (2018) 41–53. [16] Haar 1-D wavelet transform - MATLAB haart - MathWorks France. [Online]. https://fr.mathworks.com/help/wavelet/ref/haart.html?searchHighlight=haar. (accessed 10 December 2018). [17] S. Mallat, A Wavelet Tour of Signal Processing: The Sparse Way. Academic Press, 2008.
![Figure 1: Conductance variation versus time for different polarization voltages under a fixed operation point, OP1 (from [8])](https://thumb-eu.123doks.com/thumbv2/123doknet/11653004.308748/3.892.295.592.235.478/figure-conductance-variation-versus-different-polarization-voltages-operation.webp)