Delithiation Kinetics study of carbon coated and carbon free LiFePO
4D. Lepage,a F. Sobh,a C. Kuss,a G. Liang,b and S. B. Schougaarda,*
a)Université du Québec à Montréal, Case postale 8888 Succ. Centre-ville, Montréal, Québec, H3C 3P8, Canada
b) Clariant (Canada) inc., 1475, Marie-Victorin St-Bruno de Montarville (QC) J3V 6B7 (Canada) * Corresponding author. Tel.: + 1 514 987 3000; fax +1 514 987 4054.
E-mail address: [email protected] (S.B. Schougaard).
Table of content
Highlights:
• New chemical delithiation technique provide an apparent Li diffusion coefficient in LiFePO4
• Determination of LiFePO4 delithiation activation energy
• Delithiation of carbon coated and carbon free LiFePO4
Abstract
A chemical oxidation method was employed to measure the kinetics of lithium release from LiFePO4 during oxidation. Similar to potential step measurements, the chemical method simplify
quantification compared to the common electrochemical techniques (PITT, GITT etc.). It was found that the overall release of lithium fits one dimensional diffusion kinetics, however, it is shown that the mechanism must be more complex as the derived activation energy led to an unusually high attack rate of
~ 108 Hz. A comparison of carbon coated / carbon free LiFePO
4 samples indicated that the carbon coating
to have only a marginal effect on the delithiation kinetics.
Keywords: Chemical delithiation, LiFePO4, Diffusion coefficient, Kinetics, Lithium ion batteries.
1. Introduction
One of the serious issues facing wide spread use of electric cars is the battery charging time [1]. A large fraction of lithium-ion battery research is therefore focused on understanding kinetics of the processes that limit rate performance of Li-ion batteries [2]. This is particularly true for lithium iron phosphate (LiFePO4) which is targeted for electric vehicle applications due to its low price, high safety, and above
average practical energy density ~520 Wh/kg [3]. This material has weak intrinsic electronic and ionic conductivities [4], which can be overcome by adding conductive coatings to the particle surface [5], and by reducing the lithium ion transport path inside the active material using such techniques as nanosizing the particles [6-8], changing the LiFePO4 morphology to porous microspheres [9], and by forming
nanowires [10]. Yet, in spite of extensive research, as well as, the commercialization of LiFePO4, its redox
mechanism is still a subject of intense debate [11]. E.g the mechanism of the phase change between olivine - LiFePO4 and heterosite - FePO4 inherent to the redox process has been explained by several
different models beginning with the core-shell model [4], the shrinking-core model [12], and the more recent domino-cascade model [13] etc. Experimental evidence for these models rely on X-ray diffraction (XRD) [14-15], Mössbauer spectrometry [15-16], X-Ray Photoelectron Spectroscopy (XPS) [17], Fourier transform infrared spectroscopy (FTIR) [18], Time-of-Flight Secondary Ion Mass Spectroscopy (TOF-SIMS) [19], Electron Energy Loss Spectroscopy (EELS) [20], optical microscopy [20], and Scanning Transmission Electron Microscopy (STEM) [21]. These mostly ex-situ techniques have been supplemented with electrochemical measurements, including galvanostatic intermittent titration technique (GITT), electrochemical impedance spectroscopy (EIS), potentiostatic intermittent titration technique (PITT) and cyclic voltammetry (CV) to obtain kinetic information. These electrodynamic measurements are intrinsically difficult to perform reliably. This is partly due to the multi-component structure of the working electrodes which consist of current collector, binder, conductive carbon, and active material [22]. As such, the porosity, thickness, and connectivity can significantly influence the electrochemical performance and thus the measurement [23]. In fact, it is difficult to justify the assumption of unrestricted mass transport in porous electrodes where electrolyte transport paths are tortuous [24]. The LiFePO4 /
FePO4 system, is further complicated by the biphasic nature of the redox reaction which leads to a flat
potential plateau [12]. In concert with oversimplified models [25] a wide range of lithium diffusion coefficient (10-12 to 10-18 cm2.s-1, see table S1) have been reported [25-29]. The lack of consistency in
literature makes quantitative prediction of the battery performance problematic [30-35]. Further, LiFePO4
requires conductive coating to function properly in lithium ion battery electrodes, yet, knowledge about how the coating process affects the lithium transport inside the particle is still elusive [36]. Resolving this issue will require a technique that is applicable to both coated and uncoated samples as presented here. In this study a solution based chemical oxidant (H2O2) [37] is used to derive the critical reaction
parameters for the delithiation process, Eq. 1.
This process was chosen because H2O2 is highly miscible with water, so that a large excess of oxidant
can be used, also, solubility (40.8 g per 100 g at 20o C [38]) and diffusion coefficients (∼ 10-5 cm2/s [39])
of the lithium salt in water are remarkable. Thus, concerns of the lithium transport in the solvent are minimized as could be the case when using nitronium (NO2+) in organic solvents [40-42]. Moreover, the
extracted lithium can be directly quantified using a standard analytical technique (e.g. atomic emission) by removing aliquots at fixes intervals during the chemical oxidation reaction, which can further be correlated to the initial mass of LiFePO4 [43]. This approach is further advantageous as the entire surface
of the LiFePO4 particles are accessed by the oxidant, thus minimizing the issue of non-uniform current
distribution and shadow effects inherent to standard electrochemical techniques with composite electrodes.
2. Material and methods
2 g of LiFePO4 was added to 300 mL of water containing glacial acetic acid (10 mL, Alfa Aesar) and
hydrogen peroxide (10 mL, ACS Grade, 29.0–32.0%, EMD). The suspension was vigorously stirred and small aliquots were periodically removed through a filter to immediately separate the particles from the reaction medium. This process continued until 1800 s. The concentration of lithium in the aliquots were analyzed by atomic emission (λ= 670.8 nm) using a Varian AA-1475 and a calibration curve (0.1 to 0.8 ppm) prepared from a standard solution (Specpure®, Li 1000 µg/ml, Alfa Aesar). After completion of the reaction, the suspension was filtered and rinsed with 3 × 30 mL of water. The delithiated LiFePO4 was
subsequently dried at 60o C under vacuum before further XRD and electrochemical analysis (see
supporting information). The same procedure was used for all LiFePO4 samples. The LiFePO4 samples
were donated by Phostech Lithium, Saint-Bruno de Montarville, Canada, and consisted of, a R&D uncoated hydrothermal LiFePO4 (US Patent 7,807,121 B2), coated hydrothermal LiFePO4 (US Patent
½ H2O2(aq.) + CH3COOH (aq.) + LiFePO4 (s) →
H2O + CH3COOLi (aq.) + FePO4 (s)
6,962,666), and coated solid-state LiFePO4 (US Patent US 5,910,382 and C1 US Patent 6,514,640 C1)
and were used as received.
3. Results and discussion
The delithiation experiments were performed on suspensions of three types of LiFePO4 with different
average particle sizes (see supporting information, S3). Type A (davg = 591 nm) is carbon coated and
formed by solid state reaction, while type B (davg = 243 nm) and type C (davg = 313 nm) are formed by
hydrothermal synthesis, with and without carbon coating, respectively.
3.1 Delithiation behaviour
LiFePO4 was removed from the oxidation solution by filtration following the kinetic delithiation
experiments, and subjected to X-ray diffraction (XRD) (Figs S1 and S2), and electrochemical characterization (carbon coated types only). XRD confirmed complete transformation to heterosite FePO4, where no additional peaks were observed. Iron atomic absorption spectroscopy analysis of the
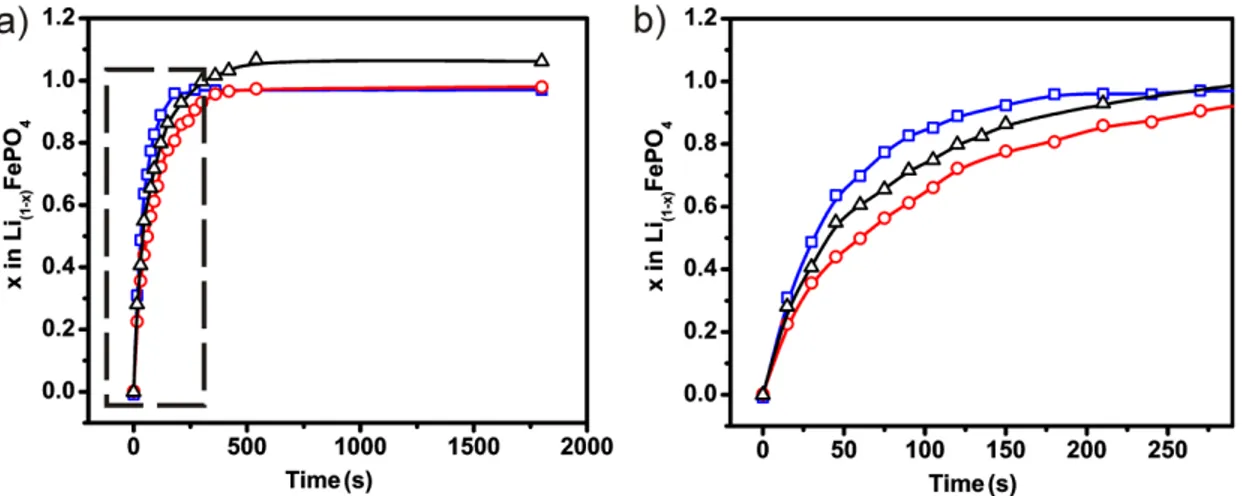
oxidation solution was used to confirm that exclusively lithium was dissolved during the oxidation process, and standard standard coin-cell tests confirmed that the chemical oxidation process had no adverse effect on the materials electrochemical insertion/deinsertion performance (Fig. S3). Preliminary analysis of the kinetic data (Fig. 1), indicate complete delithiation after 400 s, 350s, and 180 s of chemical oxidation for type A, B, and C, respectively. These values did not change when the H2O2 concentration
was increased by a factor of 10, indicating that the reaction was not limited by transport of the oxidant to the particles (see Table S2).
Figure 1. Deinsertion of lithium C-LiFePO4 solid state (red square), hydrothermal uncoated LiFePO4
(black triangle),and hydrothermal C-LiFePO4 (blue square).
3.2 Kinetic analysis of the delithation reaction
To provide a more detailed analysis, the kinetic data were fitted to a one dimensional diffusion model (see supporting information), i.e. no nucleation limitations consistent with single phase delithiation process along the diffusionally fast b-axis [44]. This follows the Delmas et al. proposed model where the chemical delithiation is initiated at multiple points throughout the crystallites, i.e. instantaneous nucleation [13], when the overpotential is much larger that the potential barrier for the formation of a single solution region. Malik et al., in a purely computational study, found this barrier to be about 30 mV [45]. Experimentally, Oyama et al., based on potential step discharge curves, found that the delithiation reaction proceeds via a one phase process when a large overpotential (~ 150 mV) was applied [46]. The overpotential for the H2O2 process used here is estimated to be ~ 1.3 V, by comparing the potential of
half-reaction at standard condition.
Using the single-phase model and solving Fick’s 2nd law in one dimension eq. 2 is obtained:
where α is the sample conversion fraction, D the diffusion coefficient, R the particle radius, and t the time. Within this framework an apparent diffusion coefficient can therefore be found from the slope of the ln(1- 𝛼𝛼) vs. t plots ( Figure 2)..
Figure 2. Linear fit (first order) of the kinetic deinsertion for C-LiFePO4 solid state (red square),
hydrothermal uncoated LiFePO4 (black triangle)and hydrothermal C-LiFePO4 (blue square).
I
In this way an apparent one dimensional diffusion coefficients of 2.9×10⁻¹², 1.2×10⁻¹², and (1.4 ±
0.6)×10-12 cm2/s (95% confidence limit) were calculated for the samples type A, B, and C, respectively.
For comparison, these values can be further converted to three dimensional radial diffusion coefficients using approximation D3D ~ 0.3 D1D, as proposed by Thorat et al. [30]. On this basis, diffusion coefficients
estimated for the types B and C, exhibited no significant difference. Since these samples are essentially carbon coated and carbon free versions of the same product, the presence of carbon coating only marginally affect kinetics of the tested samples.
Table 1. Li diffusion in LiFePO4 and the size of the particle
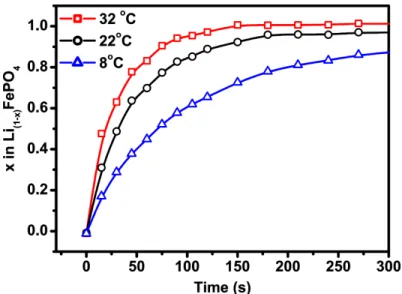
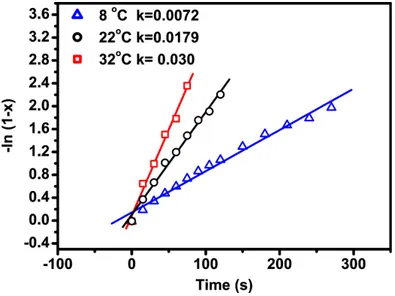
The thermal activation of the chemical delithation was also examined at various temperatures (figure 3) and the corresponding linear fit (first order) profiles are presented in Figure 4.
Figure 3: Deinsertion of lithium hydrothermal C-LiFePO4 at various temperatures
Source LiFePO4 Average Diameter (nm) Coefficient of diffusion 10-12(cm2 s-1) Solid-state 591 2.9 Hydrothermal (uncoated) 313 1.2 Hydrothermal 243 1.4 (coated)
Figure 4: Linear fit (first order) of the kinetic deinsertion for C-LiFePO4 hydrothermal, to experiments at
various temperatures
This yielded an Arrhenius diffusional activation energy (Ea) of ca. 18.4 kJ/mol (Figure 5), which is lower
than the most cited values (see table S1). For example, the activation energy (39 kJ/mol) obtained by Takahashi et al. using cyclic voltammetry [47] suggests that the thermal activation of phenomena outside the active material particles played a role in their study. These could include the conductivity of lithium into the electrolyte [48] as well as the interconnection between particle [49]. Our calculated activation energy falls within the range proposed by Maxicsh et al. who used Ab initio calculations (17-20 kJ/mol ) [50].
Figure 5: Arrhenius plot for the calculation of the activation energy.
Values of the activation energy and the diffusion coefficient can be used to calculate the product of the hopping length (a) and the v* attempt frequency (Hz), eq. 4.
For systems with slow surface reaction great care should be taken when interpreting mechanistically the experimental values of the pre-exponential and the activation energy [51-52]. Assuming hopping lengths of 3-10 Å, which ensures that all neighboring lithium sites can be reached, an attack rate of v* ~ 108 Hz
would be obtained. This value is about 5 orders of magnitude larger than expected for a diffusion limited process. Therefore, to better represent the system, a contributory factor is frequently added to the equations, which represents the role of a second phase, charge transfer, structural stresses, or a heterogeneous surface energy [51]. We therefore believe that the one dimensional diffusion model is too simplistic to describe the mechanism of the delithiation reaction. Nevertheless, we provide an apparent diffusion coefficient here for comparative purposes, showing that this numerical value is significantly higher than expected [53].
D = a2 v* exp (-E
3.3 Data analysis using the standard models frameworks
A number of previous kinetic studies have applied the classical solid-state kinetics that are based on closed form solutions to simplistic growth models[54]. As such, Allen et al. [55] used the Avrami-Johnson-Mehl-Eroofev (JMAEK) approximation, eq. 2.
where α is the sample conversion fraction (here equivalent to x), k is the rate constant, and n is the Avrami exponent [51]. On this basis, Allen et al. [55] and Oyama et al. [46] found n ~ 1, which, within the JMAEK framework, is consistent with the instantaneous nucleation combined with a parabolic (diffusional) growth law in two dimensions or one dimensional linear growth [51]. The latter case is further consistent with the moving phase boundary model as found in the domino-cascade model of Delmas and coworkers [13]. Eq. 2 with n=1 is also equal to the solution to Fick’s 2nd law in one
dimension as detailed earlier. Consequently, the kinetics data cannot be used to confirm a moving barrier or a single phase reaction mechanism without additional information.
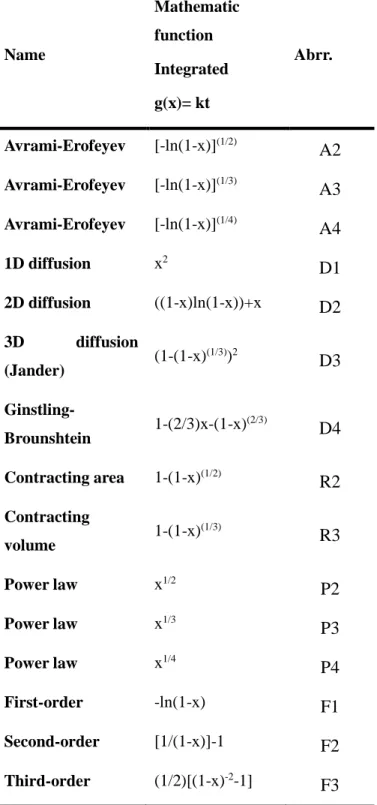
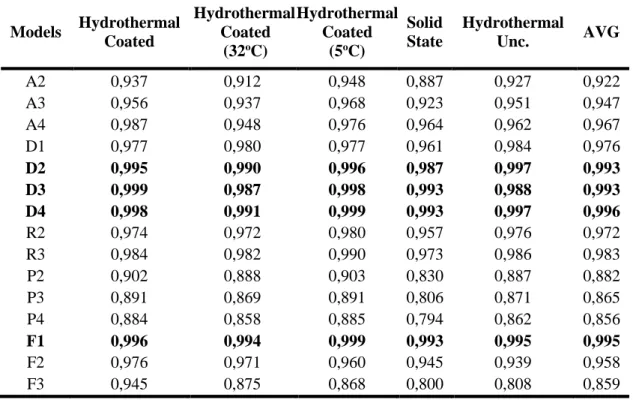
For completeness, we also tested the standard steady state diffusional growth models (Table 2; D1–D4).
Table 2. Rate equations for solid phase reactions Name Mathematic function Integrated g(x)= kt Abrr. Avrami-Erofeyev [-ln(1-x)](1/2)
A2
Avrami-Erofeyev [-ln(1-x)](1/3)A3
Avrami-Erofeyev [-ln(1-x)](1/4)A4
1D diffusion x2D1
2D diffusion ((1-x)ln(1-x))+xD2
3D diffusion (Jander) (1-(1-x) (1/3))2D3
Ginstling-Brounshtein 1-(2/3)x-(1-x) (2/3)D4
Contracting area 1-(1-x)(1/2)R2
Contracting volume 1-(1-x) (1/3)R3
Power law x1/2P2
Power law x1/3P3
Power law x1/4P4
First-order -ln(1-x)F1
Second-order [1/(1-x)]-1F2
Third-order (1/2)[(1-x)-2-1]F3
Importantly, we do not find a good fit for a 1D moving reaction front coupled with diffusion model, which would be a consequence of Li+ movement predominately along the b-axis channels after having
been released at the LiFePO4/FePO4 phase boundary. However, fitting the time resolved data to a 3D
moving reaction front with diffusion model yielded fits of similar quality as those found for eq. 2 (Table 3; D3, D4). This type of model has been successfully invoked in describing the early stages of constant current discharge curves, which was rationalized in terms of a reaction front at the agglomerate scale by Zhu et al. [23]. Further, 2D moving reaction front with diffusion model is indistinguishable from the 3D model within the presented experimental data.
Table 3. Correlation coefficients (r
2) for each rate equation solid phase reaction (best fit are
highlighted in bold) AVG = average
Models Hydrothermal Coated Hydrothermal Coated (32oC) Hydrothermal Coated (5oC) Solid State Hydrothermal Unc. AVG A2 0,937 0,912 0,948 0,887 0,927 0,922 A3 0,956 0,937 0,968 0,923 0,951 0,947 A4 0,987 0,948 0,976 0,964 0,962 0,967 D1 0,977 0,980 0,977 0,961 0,984 0,976 D2 0,995 0,990 0,996 0,987 0,997 0,993 D3 0,999 0,987 0,998 0,993 0,988 0,993 D4 0,998 0,991 0,999 0,993 0,997 0,996 R2 0,974 0,972 0,980 0,957 0,976 0,972 R3 0,984 0,982 0,990 0,973 0,986 0,983 P2 0,902 0,888 0,903 0,830 0,887 0,882 P3 0,891 0,869 0,891 0,806 0,871 0,865 P4 0,884 0,858 0,885 0,794 0,862 0,856 F1 0,996 0,994 0,999 0,993 0,995 0,995 F2 0,976 0,971 0,960 0,945 0,939 0,958 F3 0,945 0,875 0,868 0,800 0,808 0,859
4. Conclusion
The chemical oxidation for kinetic studies of delithiation presented in this report benefits from an instantaneous potential step to the entire sample while allowing unrestricted transport of lithium ions from the oxidized particles. As such, it overcomes two of the most important issues associated with the standard GITT/PITT technique, i.e. a) the potential/current is not uniform due to the electrolyte/electrode resistance and b) ionic transport is hamper due to the tortuous path of the electrolyte in the composite electrode. Consequently, the apparent diffusion coefficients found in this study are comparable to the highest values reported in literature. That is, our results were even higher than the values reported (1.9 x10⁻¹³ cm2s-1)by Yu et al. who used an NO
2+in acetonitirile oxidant flow through a packed bed of LiFePO4
to drive the delithiation reaction [40]. This suggests, surprisingly, that the liquid flow was insufficient to support unobstructed oxidant and/or lithium transport between the liquid and solid phase. Further, we provide here for the first time uncoated LiFePO4 oxidation data, where complete delithiation takes place
within ~ 400s for ~ 300 nm diameter particles. This indicates that role of state-of-the-art carbon coating as an inhibiter of lithium-ion transport should be negligible. Finally, while there is substantial indirect and theoretical evidence for a single phase delithiation mechanism at high overpotentials, a conclusive dynamic structural analysis is still missing. This is likely due to the insufficient ionic and/or electronic charge transport to and from the particles during the reaction using standard techniques. The methodology elaborated here, together with an appropriate structure analysis technique could provide a powerful tool toward understanding the intricacies of the complex LiFePO4 lithium deinsertion process.
Acknowledgement
The authors gratefully acknowledge the comments of Dr. Reza B. Moghaddam. The authors also thankfully acknowledge the Natural Sciences and Engineering Research Council of Canada (NSERC) Grant no. CRD 385812-09 for financial support.
References