O
pen
A
rchive
T
OULOUSE
A
rchive
O
uverte (
OATAO
)
OATAO is an open access repository that collects the work of Toulouse researchers and
makes it freely available over the web where possible.
This is an author-deposited version published in :
http://oatao.univ-toulouse.fr/
Eprints ID : 10572
To cite this version : Audouin, Auriane and Ern, Patricia and Charru,
François Droplet entrainment from a single wave propagating in a
stratified air-water pipe flow. (2013) In: 25th European Conference on
Liquid Atomization and Spray Systems, 01 September 2013 - 04
September 2013 (Chania, Greece)
Any correspondance concerning this service should be sent to the repository
administrator:
[email protected]
Droplet entrainment from a single wave propagating in a
stratified air-water pipe flow
A. Audouin, P. Ern and F. Charru
Institut de Mécanique des Fluides de Toulouse,
Université de Toulouse and CNRS, Allée C. Soula, 31400 Toulouse, France
Abstract
We investigate the distribution of sizes and velocities of droplets detached from a single roll wave propagating in a pipe. The wave is induced by a pulse in liquid flowrate in a stratified air-water flow. Due to the shear applied on the crest of the wave by the faster gas stream, droplets are formed and entrained by the gas. Detection and tracking of the droplets is performed by image processing. The distributions of sizes and velocities of the droplets are determined in the center of the pipe for various distances to the roll wave and compared to those measured for higher gas flowrate when droplets are produced from all the roll waves formed naturally at the gas-liquid interface without external forcing.
Introduction
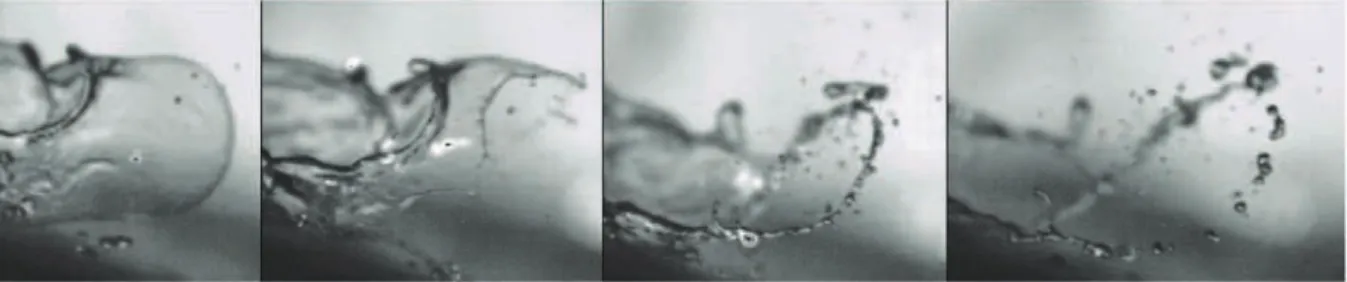
In this paper, we investigate the atomization and redeposition of droplets in a horizontal stratified air-water flow in a pipe. Due to the shear applied on the liquid layer by the faster gas flow, waves appear at the interface and propagate on the liquid surface. For sufficiently high velocities of the gas, large-amplitude waves arise and droplets detach from the crest of these waves. It has recently been shown that primary atomization mainly occurs through two mechanisms: bag- and ligament-breakup, as illustrated in Figure 1. Since the characteristic sizes of the ligaments and bags vary from a few millimeters to a few centimeters, the range of sizes of the droplets produced is large [1]. Moreover, it turns out that the droplets size distributions are more peaked and have heavier tails than the lognormal distribution usually used to account for these distributions. Notably, the distribution of droplets sizes presents a heavy tail at large drop diameters (> 0.5 mm), which gives the predominant contribution to the mass of entrained droplets. Analysis of the joint distributions of sizes and horizontal velocities also revealed that the most numerous droplets (diameters about 0.1 mm) travel at a velocity close to the gas speed, while larger drops travel at much lower velocities. Furthermore, the associated distribution of vertical velocities is non-Gaussian (displaying exponential power tail-off), large-size droplets being responsible for the larger weight of positive vertical velocities. However, most droplets present negative vertical velocities. As discussed in [1], the following sketch then emerged concerning the contributions to the dispersed phase provided by the various roll waves upstream the volume of measure: drops that are still accelerating and in particular larger drops that are still not redeposited are provided by roll waves closer to the measurement volume, while smaller drops also originate from further away waves, since they rapidly reach their terminal velocity and are carried by the gas stream over longer distances before they redeposit. A better understanding of the effect of acceleration and transport by the gas and the effect of sedimentation by gravity on the droplets detaching from a roll wave is therefore needed. The aim of this work is thus to focus on the contribution provided by a single wave and to determine the size and velocity distributions of the droplets according to the distance between the measurement volume and the isolated wave.
2
Experimental set-up
The experiments were performed for an air-water flow in a horizontal pipe of diameter 5 cm and length 5 m. The configuration considered here corresponds to the superficial gas velocity Ugs = 10 m/s and the
superficial liquid velocity Uls = 0.07 m/s. The roll wave is induced by increasing the liquid flowrate by a factor
2.4 during about 1s. The passage of the wave in a tube section is detected with a differential pressure transducer measuring the pressure loss between two sections of the pipe located 3.75 m-apart and is used as trigger for image recording. The characteristics of the droplets produced from the wave were investigated in the center of the pipe for two distances from the volume of observation to the wave. The shortest one ds is 35 cm and the
largest one dl is 80 cm. We used a high-speed camera (5000 fps) and a 20ns flash lamp to get motion-blur-free
images (especially for the smaller droplets). The field of view was set to a length of 12.47 mm, a height of 6.50 mm, along with a depth of field 1.9 mm and a resolution of 9.28 µm/pix. This enabled us to detect droplets as small as 30 µm and as large as 2 mm in diameter. Image calibration and processing were used to discriminate the droplets present in the volume of observation from those which were out-of-focus thanks to a gradient-based method [2] and to retrieve their equivalent diameter from their area in the image. Together with the droplet detection program, a tracking routine employing a multi-hypothesis method [3] was used to follow the droplets along a sequence of images and to determine their vertical and horizontal velocities. All programs were implemented using Matlab and its Image Processing Toolbox.
Celerity of the roll wave
I
t is generally assumed that roll waves propagate on the liquid surface with a constant celerity unlike the capillary-gravity ripples [4]. To confirm this, we recorded the passage of sixty isolated roll waves at two differents locations of the pipe. We used two high-speed cameras (500 fps) situated 1.1 m apart to record the position of the air-liquid interface using a field of view of length about 58 mm and height 46 mm. Image processing then provided an estimation of the liquid layer thickness as well as the celerity of the wave by cross-correlating the temporal signals of the liquid-layer thickness obtained at two points (located 5 cm apart) of an image of a given camera and between two points of each camera. The celerity of the roll wave Uw is then definedby the ratio between the distance separating the two points of reference used in the cross-correlation and the time delay corresponding to its maximum value. For a given roll wave, three different estimations were thus obtained, yielding the celerity Uw =1.5 ± 0.25 m/s. No acceleration of the roll wave was observed along the pipe, but the
differences in the measured values indicate that the wave celerity fluctuates as the wave propagates in the pipe, as do the structure and shape of the wave.
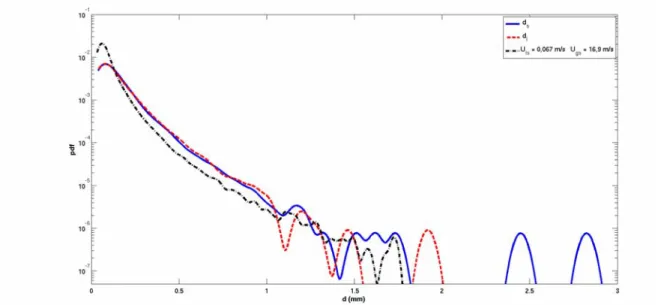
Size distributions
The probability density functions (pdf) of droplets sizes and velocities were obtained for a total number of 16.000 droplets for each distance to the wave. In order to compare the different results, all the pdf are normalized, so that their integral is equal to 1. For both distances to the waves, the measured distributions are large, with droplets diameters ranging from about 40 µm to 3 mm with a predominance of small droplets.
Figure 2. Distributions of droplets diameters for two distances from an isolated wave (with Uls = 0.07 m/s and
Nevertheless, the contribution to the liquid volume in the dispersed phase provided by larger droplets is considerable. It also appears that larger drops disappear when increasing the distance between the wave and the measurement volume as a consequence of deposition while the amount of small drops is kept almost constant (figure 2). The size and velocity distributions were investigated in a previous work [1] for a wavy-stratified regime characterized by nearly the same superficial liquid velocity Uls = 0.067 m/s and a higher superficial gas
velocity Ugs = 16.9 m/s. In this regime, roll waves are formed naturally at the gas-liquid interface without
external forcing of the liquid flow rate. Comparison of the distributions measured in the present work to those obtained in the wavy-stratified regime with natural atomization indicates that the relative weight in the distributions of smaller drops and of larger drops is stronger in the latter regime, which supports the idea of an accumulation in the dispersed phase of smaller droplets originating from a large range of roll waves.
For the wavy-stratified flow and for the isolated wave, figure 3 shows the comparison between the experimental distributions of droplets sizes and the Fréchet law (Fr) and the lognormal law (LN), which is commonly used in this context, e.g. [5]. The expressions of these laws are
€
ν
Fr(d)
=
k d
−k −1d
−ke
d d $ % & ' ( ) − k and€
ν
LN(d)
=
1
σ d 2π
e
− 1 2σ2 ln d d & ' ( ) * + 2where d is the droplet diameter,
€
d
the mean diameter of the droplets,€
σ
the standard deviation, and k an ajustable parameter. It turns out that the droplets sizes distributions for the wavy-stratified flow are clearly better fitted by the Fréchet law (figure 3.b), as shown in [1], whereas the lognormal law is more appropriate in the case of the isolated wave it for both distances ds and dl (figure 3.a).Figure 3. Comparison between the experimental pdf of droplets diameters (dotted blue) and a lognormal fit (dashed red) and a Fréchet fit (solid black), for (a) the isolated wave at the distance ds and (b) the wavy-stratified
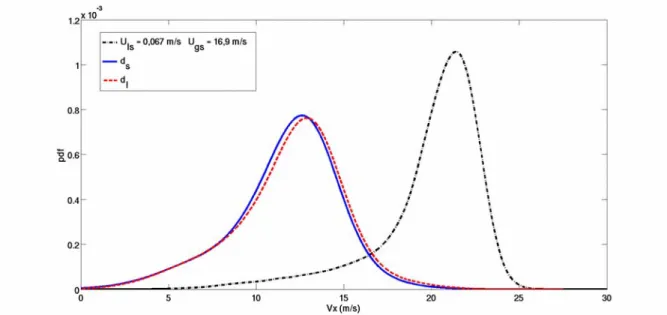
Figure 4. Horizontal velocity distribution of droplets for both distances to the isolated wave (Uls = 0.07 m/s and
Ugs =10 m/s) and for the wavy-stratified regime (with Uls = 0.067 m/s and Ugs = 16.9 m/s).
Figure 5. Horizontal velocity distribution for the short distance to the wave ds compared to a gaussian fit (dashed
red line); the dotted black line is the residual component; (Uls = 0.07 m/s and Ugs = 10 m/s).
Horizontal and vertical velocities distributions
We now consider the distributions of horizontal and vertical velocities associated to the size distributions of the droplets. Figure 4 presents the distributions of horizontal velocities Vx of the droplets for
both distances to the isolated wave and for the wavy-stratified regime investigated in [1]. The distributions display a similar shape, with a long tail for lower horizontal velocities. It also appears that the pdf for the largest distance to the wave is slightly shifted towards the higher velocities. This result is consistent with an acceleration of the droplets by the gas stream. As shown in figure 5, two different contributions can be distinguished in the distributions. The first is a gaussian contribution which includes smaller droplets whose horizontal velocities are distributed around the mean gas velocity Ug (determined by considering the mean liquid-layer thickness) because
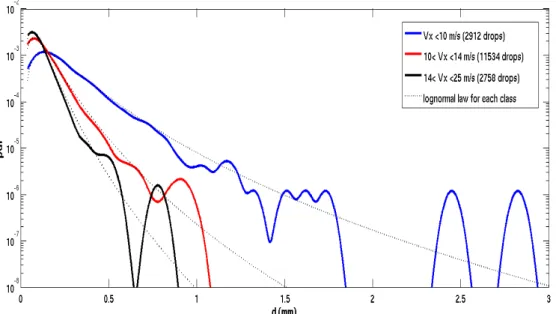
of the turbulent velocity fluctuations of the gas and of the variations in liquid layer thickness. The second component of the distribution which corresponds mainly to the lower velocities includes both large and small droplets that are still accelerating. This result is more clearly seen in Figure 6, which displays the distributions of droplets diameters by classes of horizontal velocities (for Vx < 10 m/s, 10 < Vx < 14 m/s, 14 < Vx < 25 m/s): only
small droplets reach high horizontal velocities (14 < Vx < 25 m/s), while droplets with low horizontal velocities
(Vx < 10 m/s) present a broad range of diameters. Note that the lognormal law also suits to these distributions.
The distributions of vertical velocities Vy of the droplets display a non-gaussian behavior (figure 7). Owing to
the gravity, most of the droplets are settling (around 65%) and in particular the largest ones. Comparison of the distributions measured in this work to those obtained for the wavy-stratified with natural atomization (with Uls =
0.067 m/s and Ugs = 16.9 m/s) indicates that the peak of the distributions as well as the mean vertical velocity are
negative, with a more negative peak for the wavy-stratified flow with natural atomization. Nevertheless, the distributions are asymmetric with heavier tails for the positive velocities. As can be seen in Figure 8, most Figure 6. Distributions of droplets diameters by classes of horizontal velocities, for the short distance ds and for
Uls = 0.07 m/s and Ugs = 11 m/s.
Figure 7. Vertical velocity distributions of droplets for both distances to the isolated wave (Uls = 0.07 m/s and
droplets with horizontal velocities close to the gas velocity have a negative vertical velocity while droplets with positive vertical velocities have lower horizontal velocities and can be considered to be still under the inertia of their ejection from the liquid layer.
Conclusions
Digital image processing was used to investigate the probability density functions of the sizes and velocities of the droplets detached from an isolated roll wave in a horizontal stratified air-water flow. For the two distances to the wave that were investigated, the size and velocity distributions of the droplets are large. However, we observed that larger drops are present in the vicinity of the isolated wave and disappear when increasing the distance between the measurement volume and the wave, as a consequence of redeposition. On the other hand, the amount of small drops is kept almost constant for both distances to the wave. Furthermore, it turns out that the droplets size distribution can be satisfactorily fitted by a lognormal law in both cases. Comparison of the distributions measured in this work to those obtained for a wavy-stratified regime with natural atomization [1] indicates that the relative weight in these distributions of smaller drops and of larger drops is stronger in the latter regime, which supports the idea of an accumulation in the dispersed phase of smaller droplets originating from a large range of roll waves. Analysis of the distribution of horizontal velocities also revealed that the droplets have a lower speed for the smallest distance to the wave, confirming the acceleration effect of the gas on the droplets. Our goal is now to obtain a better description of the atomization and deposition distributions that could be used in the closure models for the momentum conservation equations in the liquid and gas phases.
Acknowledgements
This work was supported by TOTAL Exploration & Production and Scientific Development Division. We would like to thank in particular D. Larrey, F. Luck and J.M. Munoz for their involvement in the project. We also thank S. Cazin, G. Ehses, H. Ayroles and M. Marchal from IMFT for the technical support.
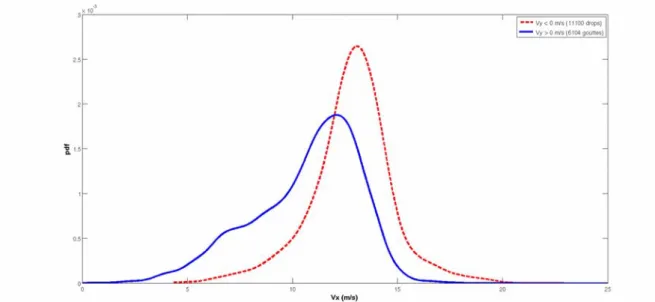
Figure 8. Distributions of droplets horizontal velocities for positive (dashed red) and negative (solid blue) vertical velocities, for the short distance ds, Uls = 0.07 m/s and Ugs = 11 m/s.
7
Nomenclature
d diameter of droplets [µm]
€
d Mean diameter of the droplets [µm] ds short distance to the wave [m]
dl long distance to the wave [m]
t delay [s]
Ug mean gas bulk velocity [m/s]
Ugs gas superficial velocity [m/s]
Uls liquid superficial velocity [m/s]
Uw roll wave celerity [m/s]
σ Standard deviation [µm]
References
[1] Boulesteix S., Ern P., Charru F. and Luck F., Size and velocity distributions of droplets in an air-water
horizontal pipe flow. ILASS, Brno, Czech Republic (2010).
[2] Marmottant P. and Villermaux E., On spray formation. J. Fluid Mech 498:73-111 (2004).
[3] Reid D., An algorithm for tracking multiple targets. IEEE Transactions on Automatic Control, AC-24:843-854 (1979).
[4] Belt R.J., On the liquid film in inclined annular flow. Technical university of Delft (2007). [5] Azzopardi B.J., Drops in annular two-phase flow. Int. J. Multiphase Flow 23:1-53 (1997).