UNIVERSITÉ DU QUÉBEC À MONTRÉAL
UTILISATION DES CONGÉNÈRES COMME STRATÉGIE DE DÉCOUVERTES DE NOURRITURE: L'EXEMPLE DE L'ÉCUREUIL ROUX D'AMÉRIQUE, Tamiasciurus hudsonicus, UN RONGEUR SOLITAIRE, TERRITORIAL ET
AGRESSIF
MÉMOIRE PRÉSENTÉ
COMME EXIGENCE PARTIELLE DE LA MAÎTRISE EN BIOLOGIE
PAR
AURÉLIE LEROY
UNIVERSITÉ DU QUÉBEC À MONTRÉAL Service des bibliothèques
Avertissement
La diffusion de ce mémoire se fait dans le respect des droits de son auteur, qui a signé le formulaire Autorisation de reproduire et de diffuser un travail de recherche de cycles supérieurs (SDU-522 - Rév.01-2006). Cette autorisation stipule que «conformément à l'article 11 du Règlement no 8 des études de cycles supérieurs, [l'auteur] concède à l'Université du Québec à Montréal une licence non exclusive d'utilisation et de publication de la totalité ou d'une partie importante de [son] travail de recherche pour des fins pédagogiques et non commerciales. Plus précisément, [l'auteur] autorise l'Université du Québec à Montréal à reproduire, diffuser, prêter, distribuer ou vendre des copies de [son] travail de recherche à des fins non commerciales sur quelque support que ce soit, y compris l'Internet. Cette licence et cette autorisation n'entraînent pas une renonciation de [la] part [de l'auteur] à [ses] droits moraux ni à [ses] droits de propriété intellectuelle. Sauf entente contraire, [l'auteur] conserve la liberté de diffuser et de commercialiser ou non ce travail dont [il] possède un exemplaire.»
AVANT-PROPOS
Ce mémoire est présenté sous la forme d'un article scientifique qui sera soumis pour publication. Les auteurs sont Aurélie Leroy et William Vickery.
REMERCIEMENTS
Je remercie en premier mon directeur de recherche William Vickery pour m'avoir donné l'opportunité de faire une maîtrise en comportement animal, et pour sa grande disponibilité et son trés bon encadrement pendant ces 2 années. Merci également à toutes les personnes qui m'ont aidée par leurs conseils ou leur présence sur le terrain.
TABLE DES MATIÈRES
AVANT-PROPOS .ii
LISTE DES FIGURES v
Discussion , _ _ _ 28
LISTE DES TABLEAUX , vi,
RÉSUMÉ vii
INTRODUCTION GENERALE 1
CHAPITRE 1: A solitary, territorial forager, the American red squirrel
Tamiasciurus hudsonicus, can use public infonnation to find food
patches 9 Abstract, . .,. , ' " , , _ __ '" _._ 9 Introduction 10 Methods _ _.. _ _ '" _ 15 Results _ _ '" 21 CONCLUSION GÉNÉRALE 35 REFERENCES 39
LISTE DES FIGURES
CHAPITRE 1
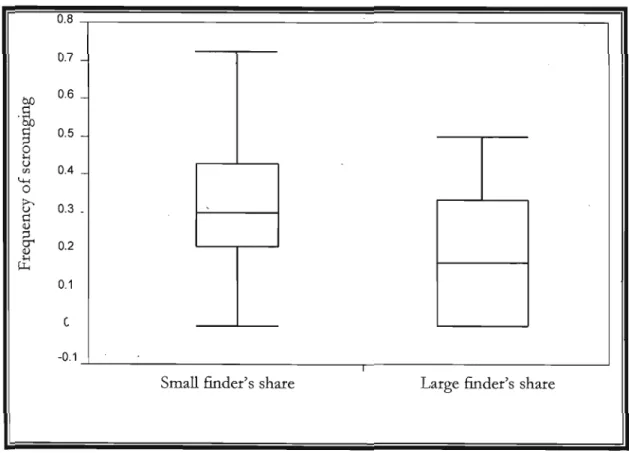
Figure 1 : Effect of finder's share on the frequency of scrounging when first condition
presented is "small finder's share" in 2008, (ANOVA F" 34=6.36; p=0.01).
p.25
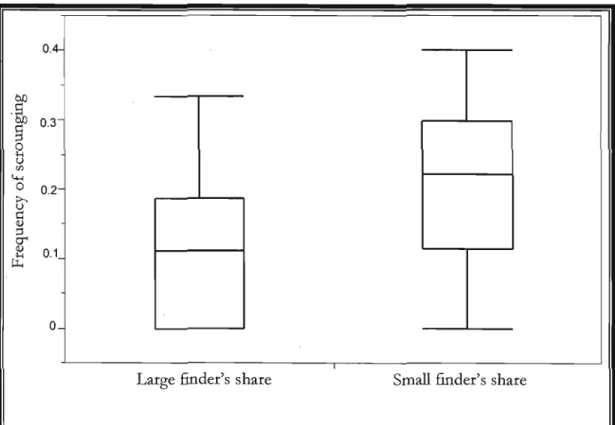
Figure 2 : Effect of finder's share on the frequency of scrounging when first condition
presented is "large finder's share" in 2009, (ANOVA F,. 33=5.9; p=0.02).
p.26
Figure 3 : Effect of producing cost on the frequency of scrounging in 2009, (ANOVA
F" 38=3.5; p=0.068).
LISTE DES TABLEAUX
CHAPITRE 1 :
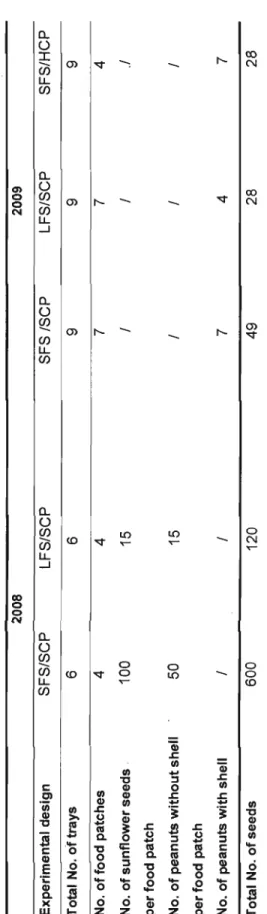
Table 1: Characteristics of the 2008 experimental design to test the effect of the finder's share on the frequency of scrounging and the 2009 design to test the effect of the finder's share and the effect of cost of producing on the scrounger's frequency; in a population of red squirrels (Tamiasciurus hudsonicus) (SFS= small finder's share; LFS= large finder's share; SCP= small cost of producing; HCP= high cost of producing)
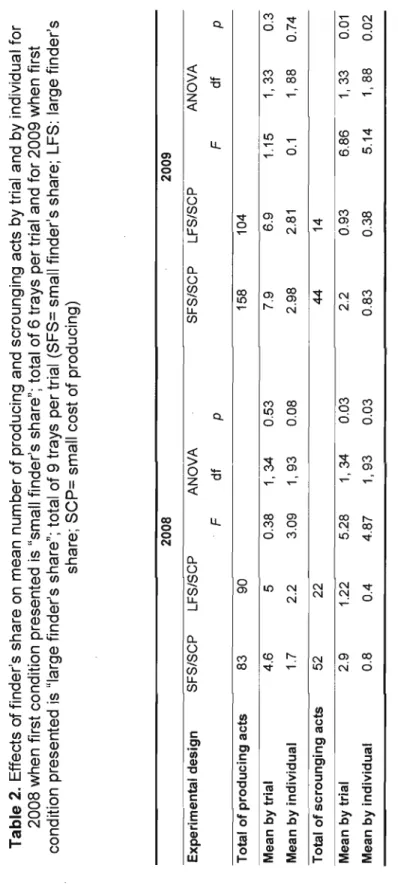
p.20 Table 2: Effects of finder's share on mean number of producing and scrounging acts by trial and by individual for 2008 when first condition presented is "small finder's share"; total of 6 trays per trial and for 2009 when first condition presented is "large finder's share"; total of 9 trays per trial (SFS= smail finder's share; LFS: large finder's share; SCP= small cost of producing)
p.23 Table 3: Effects of producing cost on mean number of producing and scrounging acts by trial and by individual; total of 9 trays by trial (SFS= small finder's share; SCP= small cost of producing; Hep= high cost of producing)
RÉSUMÉ
Les animaux utilisent différentes stratégies pour se nourrir: chercher leur nourriture seul, en groupe, la voler, la partager... Lors de l'approvisionnement en groupe, la découverte de nourriture par un individu est une information qui peut se propager au sein du groupe entier. Le modèle producteur-chapardeur prédit ainsi la propension de chaque membre à jouer le rôle de producteur, soit rechercher de la nourriture pour soi-même, ou de chapardeur, soit attendre que les autres découvrent la nourriture et se joindre à ces découvertes. Ce modèle est caractérisé par l'incompatibilité des deux tactiques. Jusqu'à maintenant, il a pu être vérifié chez plusieurs espèces d'oiseaux sociaux se nourrissant au sol et qui ne peuvent donc fouiller le sol à la recherche de nourriture et observer leurs congénères en même temps. Dans notre étude, nous avons travaillé avec l'écureuil roux d'Amérique, Tamiasciurus hudsonicus. Chez cette espèce, chaque individu délimite et défend un territoire sur lequel il entrepose ses réserves de nourriture pour l'hiver. Les territoires étant proches les uns des autres, voir contigus, nous avons voulu vérifier si les individus étaient capables d'utiliser des stratégies de groupe lors de l'approvisionnement. En disposant des mangeoires de nourriture dans le territoire d'un individu, nous avons mis en évidence que les écureuils voisins ou errants pouvaient observer les activités d'approvisionnement de l'animal propriétaire. Dans 83% des cas, l'information est utilisée par l'observateur pour tenter d'accéder à la source de nourriture. De plus, en diminuant la quantité de nourriture par mangeoire créant une part du découvreur élevée et défavorisant ainsi l'emploi de la stratégie chapardeur, nous avons observé que la fréquence de chapardage diminuait tel que prédit par le jeu producteur-chapardeur. Enfin, en diminuant la proportion de mangeoires avec nourriture, rendant celles-ci plus difficile à trouver pour les producteurs, nous avons observé une augmentation presque significative de la fréquence de chapardage. Dans notre étude, nous avons donc vérifié pour la première fois que les comportements d'approvisionnement d'une espèce territoriale et agressive, l'écureuil roux d'Amérique, étaient expliqués par un modèle d'approvisionnement social, le modèle producteur-chapardeur.
Mots-clés: écureuils roux, information publique, approvisionnement, jeu producteur chapardeur.
INTRODUCTION GÉNÉRALE
De la naissance à la mort, les animaux partagent tous une même caractéristique, ils doivent se nourrir pour vivre. L'investissement des individus en temps et en énergie lors de l'approvisionnement, c'est-à-dire pendant les activités de recherche et d'exploitation de la nourriture est donc considérable (Danchin, Giraldeau et Cézilly, 2005). Afin de maximiser son rendement énergétique et donc d'assurer de façon optimale l'ensemble de ses activités métaboliques, l'individu doit adopter les stratégies d'approvisionnement les plus profitables (Krebs et Davies, 1978). Où et quand chercher sa nourriture, quels types d'aliments intégrer à son régime alimentaire ou encore combien de temps allouer à l'exploitation d'une parcelle... ? C'est l'acquisition d'informations clés sur son environnement, comme la localisation des sources de nourriture, leur quantité ou encore leur qualité, qui permet à l'individu d'adopter telle ou telle stratégie. Ces informations vont être obtenues par l'échantillonnage du milieu dans lequel il évolue et sont appelées communément informations privées (Clark et Mangel, 1984; Valone, 1989). Cet échantillonnage a comme premier bénéfice la consommation immédiate de la nourriture découverte et le bon fonctionnement du métabolisme. De plus, à long terme, il permet l'accumulation de l'information privée, constituant ainsi une banque de données sur le milieu dont l'individu pourra se servir ultérieurement afin d'améliorer ses prochains approvisionnements (Clark et Mangel, 1984; Valone, 1991 ; Stephens, Brown et Ydenberg, 2007). Les théories d'approvisionnement optimal, avec notamment le théorème de la valeur marginale (Mac Arthur et Pianka, 1966; Charnov, 1976), sont les premiers modèles théoriques élaborés afin de mieux comprendre et expliquer les comportements d'approvisionnement d'un individu en fonction des caractéristiques du milieu (Stephens, Brown et Ydenberg, 2007). Cependant ces modèles ne s'appliquent que dans le cas où un individu s'approvisionne en solitaire et où seuls l'information privée qu'il possède et l'échantillonnage immédiat de son habitat sont utilisés pour décider quelle stratégie
2 adopter lors de la recherche de nourriture (Valone, 1991 ; Valone et Giraldeau, 1993). Or, dans la nature, de nombreuses espèces vivent et effectuent leur approvisionnement en groupe. Il est donc possible d'imaginer que la présence de congeneres peut affecter les comportements d'un individu lors de l'approvisionnement. En observant ses congénères, celui-ci peut en effet obtenir de l'information sur son environnement, par exemple si l'un d'entre eux découvre une parcelle de nourriture ou encore si un autre quitte une parcelle pour s'approvisionner ailleurs (Valone, 1989; Valone, 2007). Ces informations, étant à la disposition de tous, sont appelées informations publiques, et comme l'information privée obtenue lors de l'échantillonnage du milieu, renseignent sur la qualité de l'environnement dans lequel l'animal évolue (Valone, 1989; Valone, 2007). L'individu acquiert ainsi autant d'informations sur son milieu qu'il a de congénères à observer. À ce moment précis, il peut donc choisir de continuer de s'approvisionner seul, ou bien de s'approvisionner dans un endroit similaire à celui qu'il observe ou enfin de se joindre à la découverte de l'autre (Clark et Mangel, 1984). L'observation des congénères lui permet d'accumuler une banque d'information sur son environnement plus rapidement que s'il avait été seul. Différentes études en laboratoire ont pu ainsi montrer que l'utilisation de l'information publique était une stratégie avantageuse qui permettait d'estimer plus rapidement et plus efficacement la qualité d'une parcelle. En 1995, Templeton et Giraldeau ont mis en évidence chez des étourneaux, Sturnus vulgaris, que les individus se servant des informations émises par les congénères en plus de leur propre information privée arrivaient plus rapidement aux parcelles riches en nourriture. Dans une deuxième étude complémentaire, ils ont pu démontrer que les étourneaux identifiaient également le manque de succès d'un congénère comme une information de mauvaise qualité de la parcelle et quittaient donc plus tôt que les autres ces parcelles inintéressantes (Templeton et Giraldeau, 1996). Ces résultats ont aussi été corroborés par Smith, Benkman et Coffey dans une étude portant sur les becs croisés, Loxia curvirostra, en 1999.
Dans la nature, la propagation de l'information publique au sein d'un groupe peut se traduire par la tentative d'appropriation d'une source de nourriture découverte par un autre. Ce comportement permet une économie en temps de
3 recherche et en dépense d'énergie pour celui qui se joint mais également un coût pour celui qui est rejoint, contraint alors à partager sa découverte, à la défendre ou à l'abandonner. Une deuxième série de modèles mathématiques a donc été élaborée afin d'expliquer les comportements observés lors de l'approvisionnement en groupe, et plus particulièrement les raisons de se joindre ou non à la découverte d'un autre. Ces modèles, basés sur les théories des jeux, repose sur l'utilisation de l'information publique au sein du groupe mais diffèrent sur la façon dont celle-ci est acquise. On . distingue ainsi trois modèles d'approvisionnement social: le modèle du partage
d'info~ation, le modèle producteur-chapardeur et le modèle Dubois.
Modèle du partage d'information:
Le modèle du partage d'information est basé sur le principe que la découverte de nourriture est une infonnation partagee entre les différents membres du groupe (Clark et Mangel, 1984). En effet, tout en cherchant une parcelle de nourriture, il est possible pour chaque membre de chercher les opportunités à se joindre aux découvertes des congénères (Clark et Mangel, 1984). En se joignant mutuellement aux opportunités, chaque membre perçoit donc la même quantité de nourriture et aucun individu n'est pénalisé par ce partage. Ainsi, si l'on considère un individu
x
découvrant une parcelle et G le nombre de membres du groupe, alors on s'attend à ce que l'individux
soit rejoint par: (G-1) individus (Giraldeau et Beauchamp, 1999). La fréquence d'individus se joignant à l'individu qui découvre est donc toujours de (G-1 )/G.Ce modèle suppose que la recherche de sa nourriture n'empêche pas un individu de rechercher celle découverte par les autres, les deux peuvent s'effectuer simultanément (Giraldeau et Beauchamp, 1999). Elgar en 1986, a ainsi mis en évidence chez le moineau domestique Passer domesticus que les individus émettaient des sons pour appeler leurs congénères après avoir découvert de la nourriture. À l'inverse pour les animaux dont la nourriture est sur le sol et qui n'émettent aucun son pouvant renseigner leurs congénères de leur découverte, la seule solution pour chaque membre du groupe est de lever la tête et d'observer les alentours; ce qui arrête momentanément leur propre recherche (Giraldeau et
4
Beauchamp, 1999). Les deux types de recherche ne peuvent donc s'effectuer simultanément, soit l'individu cherche sa propre nourriture, soit il guette les découvertes des autres (Giraldeau et Beauchamp, 1999). Ce type de comportement d'approvisionnement est expliqué par un autre type de modèle: le modèle producteur-chapardeur.Modèle producteur-chapardeur:
Dans le modèle producteur-chapardeur, il existe deux stratégies pour les individus du groupe: rechercher de la nourriture par soi-même (c.f producteur) ou rechercher des individus ayant découvert de la nourriture (c.f chapardeur) (Barnard et Sibly, 1981). À l'inverse du modèle du partage d'information, on suppose ici que les deux stratégies sont incompatibles, c'est à dire qu'à un moment donné les individus sont soit producteur, soit chapardeur (Giraldeau et Beauchamp, 1999). Les individus sont toutefois capables d'alterner au cours du temps entre les deux stratégies et un groupe peut ainsi être composé soit de purs producteurs et de purs chapardeurs, soit de ces deux types d'individus plus des individus alternant les stratégies, soit uniquement d'individus alternant les deux stratégies (Giraldeau et Beauchamp, 1999).
En 1991, Vickery et al. ont proposé un modèle mathématique afin de prédire les gains obtenus selon l'utilisation de l'une ou de l'autre des stratégies. Le producteur qui découvre la nourriture F présente dans une parcelle va bénéficier d'un certain laps de temps avant l'arrivée des chapardeurs P9ur consommer une partie de son butin, on parle. de la part du découvreur a. La quantité de nourriture à partager avec les chapardeurs correspond à: A
=
F-a. La proportion par individu lors du partage correspond à AIn avec n, le nombre d'animaux partageant la parcelle. Si l'on considère que les producteurs cherchent les parcelles de façon indépendante, alors f correspond au pourcentage de parcelles trouvées, et l'on peut en déduire les gains obtenus par stratégie après un temps T :5
Gains pour la stratégie producteur: Ip = fT (a + AIn)
Gains pour la stratégie chapardeur: Is
=
fTNq (AIn)avec q la proportion de producteur et N, le nombre d'individus composant le groupe.
Le modèle producteur/chapardeur prédit donc que les gains de nourriture pour chacune des stratégies utilisèes dépendent de leur fréquence respective au sein du groupe (Vickery et al. 1991). On parle de stratégie négativement fréquence dépendant. Lorsque la proportion de chapardeurs est faible, alors cette stratégie confère plus de gains que la stratégie producteur (Barnard et Sibly, 1981 ; Vickery et al. 1991). Lorsqu'elle est élevée, il y a donc moins d'individus pour chercher la nourriture, de plus celle-ci doit être partagée en un plus grand nombre d'individus, ainsi la stratégie chapardeur confère moins de gains que la stratégie producteur, même si cette dernière diminue quand même (Barnard et Sibly, 1981 ; Vickery et al. 1991). Dans un groupe, il existe un point d'équilibre pour lequel la fréquence de chapardeur au sein du groupe est telle que les gains de l'une ou de l'autre des stratégies sont équivalents. Dans la nature, ce point d'équilibre est soumis aux variations de facteurs environnementaux tels que la disponibilité ou l'abondance de la nourriture. Selon le modèle de Vickery et al. (1991), la proportion d'utilisation des deux stratégies est liée aux facteurs influençant la quantité de nourriture à partager, notamment la part du découvreur. Le modèle prédit ainsi que si la part du découvreur est grande, il ne restera qu'une petite partie de la nourriture présente initialement à se partager lorsque les chapardeurs se joignent. Ainsi on observera une augmentation de l'utilisation de la stratégie producteur au sein du groupe et inversement lorsque la part du découvreur est petite.
Modèle Dubois:
Le modèle producteur/chapardeur explore les comportements d'approvisionnement en groupe en considérant que les individus ne font jamais preuve d'agressivité entre eux (Vickery et al. 1991). Cependant, dans la nature, l'agressivité est couramment utilisée pour s'approprier une ressource découverte par un autre (Hansen, 1986 ; Di Bitetti et Janson, 2001). Le modèle du faucon-colombe,
6
explique dans un contexte général dans quelle mesure un individu utilise l'agressivité lors d'interactions (stratégie faucon) ou ne l'utilise pas et bat en retraite (stratégie colombe) (Maynard Smith, 1982). En 2005, Dubois et Giraldeau ont décidé d'associer les caractéristiques du modèle producteur/chapardeur à celles du modèle faucon/colombe dans un contexte d'appropriation et de défense d'une source de nourriture entre congénères. Ce modèle, appelé le modèle Dubois, permet ainsi d'examiner dans quelles circonstances les interactions «appropriation-défense}} peuvent générer de l'agressivité selon que l'individu est p~oducteur ou chapardeur.Le modèle suppose qu'un individu engagé dans une stratégie faucon diminue sa vigilance envers les prédateurs et ainsi augmente le- risque de se faire attaquer. Si l'on considère G le nombre d'individus du groupe, p la proportion de producteur, a la part du découvreur, h la proportion d'animaux faisant le jeu faucon, f le pourcentage de découverte d'une parcelle par un producteur, m le risque de prédation lors de l'utilisation de la stratégie faucon, alors:
Gains des producteurs: Wp
=
fT {a + hp (1 - m) Wph + (1 - hp ) Wpd}Gains des chapardeurs: Ws
=
fT pG {hs(1 - m) Wsh + (1 - hs) Wsd}Le modèle Dubois prédit que la fréquence d'agression et le niveau d'agressivité dépendent de la stratégie d'appropriation du chapardeur plutôt que de la stratégie de défense du découvreur (Dubois et Giraldeau, 2005). En effet, ceux-ci utilisent toujours la stratégie faucon pour défendre leur ressource tandis que les chapardeurs ne l'utilisent que dans des circonstances particulières pour se l'approprier (Dubois et Giraldeau, 2005). Par exemple, la diminution de la richesse d'une parcelle entraîne une augmentation de la proportion de producteurs et diminue celle des chapardeurs (Vickery et al. 1991). En conséquence, le nombre d'interactions par mangeoire diminue et lorsqu'elles ont lieu, les chapardeurs ont donc plus intérêt à utiliser la stratégie faucon que colombe (Dubois et Giraldeau, 2005). Dans ces circonstances, on verra donc une diminution de la fréquence d'agression par mangeoire mais une augmentation de la proportion de chapardeurs agressifs (Dubois et Giraldeau, 2005).
7
Les modèles d'approvisionnement sociaux ont été très souvent utilisés chez des oiseaux grégaires, notamment les étourneaux, Stumus vulgaris, les capucins damiers Lonchura punctulata ou encore les merles quiscales, Quiscalus lugubris et très peu avec les mammifères. Dans notre étude, nous avons choisi de travailler avec l'écureuil roux d'Amérique, Tamiasciurus hudsonicus, un petit rongeur diurne territorial caractérisé par des comportements plutôt territoriaux et agressifs. Actif toute l'année, l'écureuil roux emmagasine des réserves de nourriture dans un territoire de 0.2 à 1.2ha (Flyers et Gates, 1982). Les individus de cette espèce se tolèrent peu entre eux, il est parfois possible d'observer des associations entre conjoints jùsqu'à ce que les petits soient élevés, cependant l'observation la plus fréquente correspond à un écureuil roux chassant un congénère, un écureuil gris ou n'importe quel oiseau présent sur son territoire (Banfield, 1977). Les intrus sont chassés par de nombreuses et puissantes vocalises mais également par de longues poursuites pouvant se terminer par des combats (Gurnell, 1984). Cette agressivité permet de protéger les réserves de nourritures, notamment les grosses cachettes pouvant aller jusqu'à 1m de hauteur, très importantes pour la survie de l'individu pendant l'hiver (Flyger et Gates, 1982; Banfield, 1977). La nourriture est accumulée pendant l'été et le début de l'automne, et correspond principalement à des cônes de conifères (Banfield, 1977). L'écureuil roux s'approvisionne donc plutôt en solitaire, cependant, des chercheurs ont pu observer que des cônes de pins marqués accumulés par un individu dans son territoire se retrouvaient plus tard dans le territoire d'un voisin (Gurnell, 1984). De plus, les territoires peuvent être assez proches les uns des autres lorsque la densité d'animaux est importante. Pour ces raisons, nous pensons qu'il est possible à un individu de disposer de l'information publique émise par un congénère et éventuellement de s'en servir pour localiser une source de nourriture.Dans cet esprit, nous voulons dans notre étude vérifier dans un premier temps si les individus se servent de leurs congénères et plus précisément de l'information publique que ceux-ci émettent pour découvrir une source de nourriture. Nous prédisons que lorsqu'un écureuil roux observe un congénère manger dans une
8
mangeoire, alors la probabilité qu'il aille par la suite se nourrir dans cette mangeoire sera plus élevée que celle qu'il aille se nourrir dans une autre mangeoire.Si cette première hypothèse est vérifiée, alors nous nous intéresserons par la suite aux interactions se produisant à une source de nourriture et ce afin de déterminer si les comportements de chapardage observés sont expliqués par le modèle producteur/chapardeur. Nous prédisons tout d'abord que la fréquence de chapardage augmente lorsque la proportion de nourriture consommée par le découvreur (Le la part du découvreur) diminue; tel que prédit par le modèle de Vickery et al. (1991). Ensuite, nous prédisons que la fréquence de chapardage augmente lorsque le coût de production augmente, c'est-à-dire lorsque la proportion de mangeoire avec nourriture diminue, tel que prédit par le modèle Dubois(200S).
CHAPITRE 1
A TERRITORIAL FORAGER, THE AMERICAN RED SQUIRREL, Tamiasciurus hudsonicus, CAN USE PUBLIC INFORMATION TO FIND FOOD PATCHES.
Abstract
When living in groups, animais can use public information produced by conspecitics to discover food patches. The producerlscrounger model explains the proportion of a foraging group which is searching for food (Le. producers) and the proportion which is trying to exploit the discoveries of others (Le. scroungers). The model predicts a stable equilibrium frequency of scroungers where payoffs to the two strategies are equal. However, changes in environmental factors can affect this equilibrium. The model has been tested with social birds and recently with social primates. Because the American red squirrel, Tamiasciurus hudsonicus, is a territorial, aggressive forager it is less likely to scrounge than social foragers. Here, we tirst demonstrate that red squirrels use public information produced by conspecifiCS. When an animal observed another feeding in a patch or hoarding food from it, the probability that it would next eat in that patch was greater than the probability of eating in any other patch. Secondly, we tested two predictions of the producerlscrounger model. As predicted, the frequency of scrounging was signiticantly lower when the tinder's share (the proportion of food consumed by the producer when alone) was greater. Finally, when producing costs were higher the frequency of scrounging was almost signiticantly higher than for lower producing costs. Our study is the tirst to demonstrate that a territorial species uses public information and plays the producerlscrounger game.
INTRODUCTION
To discover a food patch, an animal has to sam pie its environment. Knowledge gained from such sampling is called private information (Valone, 1989). When living in groups, information can also be obtained by observing the performance of other individuals. This is called public information (Valone, 1989). In 1995, Templeton and Giraldeau confirmed that starlings, Stumus vulgaris, observed the success of conspecifics and used this information to find hidden food. The use of public information, like private information obtained by sampling, en'ables individuals to estimate the quality of feeding sites and make behavioural decisions that help maximise the fitness such as where to live, when and where to search. However, Templeton and Giraldeau (1996) demonstrated that animais using public information estimate the quality of an empty patch faster and so depart sooner than a solitary forager who does not. In the same way, Smith, Benkman and Coffey (1999) showed that red crossbills Loxia curvirostra sampied less when they observed less success by conspecifics and so reduced their foraging time in a poorer patch.
Different experiments have shown that when public information is available, easy to use and in agreement with their prior knowledge, individuals will use it to access to resources (Templeton and Giraldeau, 1995; van Bergen, Coolen and Laland, 2004; Fernandez-Juricic, Siller and Kacelnik, 2004). Thus they may consume food which otherwise might have been eaten by the individual which discovered the food patch. In a group of foraging animais, the profitable strategy should be to join the next discovery of a companion (Clark and Mangel, 1984). Joining can be explained by information-sharing models. These models assume that it is possible to search for resources while watching for opportunities to appropriate the food found by another (Clark and Mangel, 1984). When an individual discovers a food patch, this information is available for ail group members who want to join and feed, By joining at each other's discoveries equally, on average, no one in the group is penalized (Clark and Mangel, 1984). The model predicts that in a group of G
Il
individuals, when a patch is discovered by x individuals, the founder should be joined by (G-1) individuals. The predicted frequency of joining is (G-1 )/G and every member contributes in the same way to the group searching's effort (Clark et Mangel, 1984). ln some species, such as house sparrows Passer domesticus (Elgar, 1986) the founder uses specific calls which bring companions to share the discovery.
ln some cases it is not possible to look for food and observe companions at the same time. For example, ground-feeding birds have to look up to observe conspecifics and so must stop searching for food at this moment. So, individuals have to choose between the two strategies: spend time and energy in sampling their environment to locate their own resource (the producer strategy) or monitor the foraging activities of conspecifics to feed on their discoveries (the scrounger strategy) (Barnard and Sibly, 1981). The two tactics are incompatible and at a certain point individuals are either producers or scroungers but can switch strategy at any time (Giraldeau and Beauchamp, 1999). These behaviours are explained by a .second model of game theory, the producer-scrounger game (Barnard and Sibly, 1981; Vickery et al. 1991). The model assumes that profits for each strategy depend on their respective frequency within the group and are negatively frequency dependent (Vickery et al. 1991). When producers are common, scrounge is the profitable tactic because there are many opportunities to joïn (Barnard and Sibly, 1981; Vickery et al. 1991). Conversely when scroungers are common, there are fewer individuals to find food and many individuals with whom to share. In this case, profits are higher for producers because of the "tinder's advantage", the amount of food eaten before others arrive (Barnard and Sibly, 1981; Vickery et al. 1991). Finally, a stable equilibrium frequency of scroungers and producers can be obtained, at which profits are equal for both strategy and no one can do better by switching
(Vickery et al. 1991).
However, behaviours are the results of the trade-off between costs and benefits. So changes in environmental factors that affect the costs or the benefits will affect this equilibrium. Individual flexibility in tactic use allows animais to adjust to environmental variation and as a result they maintain an equilibrium. Considering ) F indivisible food items, and a the quantity of items consumed by the finder when
12
alone, a/F is calied the finder's share (Vickery et al. 1991). Small values of a/F will favour joiners because there are more food to share. So, the model predicts that when the finder's advantage decreases, scrounge will become a profitable strategy and the frequency of scrounger will increase in the group (Vickery et al. 1991). In the same way, an incn3ase of the cost of producing decreases the use of the producer tactic as an increase of the cost of scrounging decreases the use of the scrounger strategy (Giraldeau, Soos and Beauchamp, 1994; Morrand-Ferron, Giraldeau and Lefebvre, 2007). At last, the equilibrium depends on the group size and the model predicts that increasing group size will increase the frequency of scrounging.
Until recently, most of producer-scrounger experiments were conducted with socials birds. Giraldeau, Soos and Beauchamp (1994) tested predictions about negative frequency-dependant payoffs. They found with spice finches Lonchura punclulata, that scrounger's payoffs decreased when the frequency of scrounging increased. With the same species, Beauchamp and Giraldeau (1997) investigated the effect of competition intensity. They discovered that when time searching was short and so producing was easy, producers abandoned discoveries earlier. Beauchamp (2001), with zebra finches Taeniopygia guttata, observed individual flexibility in tactics used. Ha and Ha (2003) studied the finder's share with Corvus caurinus and discovered that large prey were more often stolen as did Steele and Hockey (1995) with kelp gulls Larus dominicanus. Coolen, Giraldeau and Lavoie (2001) and Coolen (2002) provided complete studies with spice finches Lunchura punctulata. They related the finder's share and group size to searching efficiency and the frequency of scrounging. When the finder's share increased, the frequency of scrounging decreased. When group size increased, they observed that frequency of scrounging increased. Finally, they found that an increase in the frequency of scrounging decreased the efficiency of research.
But rarely experiments were conducted with socials mammals. In 2005 Bicca Marques and Garber were the first to explain social foraging behaviour by primates as a producer-scrounger game. They worked with Sanguinus imperator and S. saddleback, two species of tamarins, and found that some individuals were searching more for resource than others, in agreement with the model's predictions.
13 But do social models apply only to social species? Is it possible for a solitary individual to use con specifies to discover food patches? That is the question we address in this study. We are interested in the red squirrel Tamiasciurus hudsonicus, a territorial (thus somewhat solitary) and aggressive arboreal North American rodent. Diurnal and active throughout the year, it exhibits two daily activity peaks during spring, summer and fall, one in the early morning and the other just before sunset (Layne, 1954; Smith, 1968). During the winter, it goes out in the middle of the day when the temperature is highest but can shelter several days in its nest if the weather is bad (Layne, 1954; Smith, 1968). Red squirrels feed on a wide variety of food but prefer conifer seeds and so they occur particularly in conifer forests (Layne,
1954; Smith, 1968; Rusch and Reeder, 1978). In order to survive the winter, red squirrels accumulate food in large caches called middens (larder hoarding) or on the ground (scatter hoarding) (Rusch and Reeder, 1978; Hurly and Lourie, 1997; Wheatley, Larsen and Boutin, 2002). For this reason, individuals maintain a territory around their reserves and defend it vocally and with long chases against conspecific intruders, other rodents and birds (Rusch and Reeder, 1978; Smith, 1968). Territories do not overlap, 0.5 to 5 individuals/ha, but may be contiguous specifically in high-density populations, asin Norway spruce [3 to 9 individuals/ha] (Smith, 1968; Rusch and Reeder, 1978; Wheatley, Larsen and Boutin, 2002; Gerhardt, 2005). Despite protection of territories with aggressive behaviours, pilfering is common between neighbours. Red squirrels don't hesitate to steal cones directly from middens of conspecifics when possible (Gerhardt, 2005). In his study, Gerhardt estimated that red squirrels stole 26% of the cones they ate and lost 25% of the cones they hoarded. The proximity of territories and the occurrence of pilfering suggest that red squirrels watch their neighbours.
Thus, the objectives of this study were firstly to assess if red squirrels use public information of conspecifics to find resources. An animal feeding in a food patch will produce public information that unintentionally informs others about the location of food. We predict that when an animal observes another feeding in a patch or hoarding food from the patch, then the probability that the observer will next eat in that patch will be greater than the probability of eating in any other patch.
14
If the first prediction is confirrned, we will test the prediction of the producer/scrounger model (Vickery et al. 1991). We predict that the frequency of scrounging will increase as the amount of food in a patch (F) increases (that is reducing the finder's share). There is more food to share and so scrounging is a profitable strategy.
Finally, we will test another prediction of the producer/scrounger model about the effect of strategies' costs (Dubois and Giraldeau, 2005). If we reduce the proportion of patches which have food, costs of producing increase because producers will have to sample more patches before finding food. Thus search time and energy spent both increase. Scroungers have only to wait longer but not to spend more energy (Barrette and Giraldeau, 2006). Thus we predict that the frequency of scrounging will increase as the proportion of patches with food decreases (Dubois and Giraldeau, 2005).
MATERIAL AND METHODS
We studied a population of red squirrels in a coniferous plantation of Norway spruce, Picea abies, larch, Larix spp., cedar Thuja occidentalis and hemlock, Tsuga canadensis, in the Morgan Arboretum Québec, Canada (450 30'N latitude, 730 36'W longitude) during spring and summer of 2008 and 2009. We Iive-trapped and marked ail resident red squirrels which lived in or foraged in the study area du ring the capture period. We trapped animais, mostly residents, in the spring (1 to 18 May 2008, 9 to 28 April 2009) and early summer (14 to 29 July 2009) following the dispersal of juveniles. Sherman live traps (44 by 13 by 13cm) were used with peanut butter and sunflower as bail. A total of 11 individuals in 2008 and 15 individuals in 2009 were marked with ear tags and unique combinations of coloured pipe c1eaners (893 Jiffy sizes 3, National Band and Tag Co., Newport, KY). In addition, we cut the guard hairs on their rumps or their tai!. Sex, weight and age c1ass were determined. Individuals <150g were c1assified as juveniles. In addition, breeding status of females was assessed by observing teat size because we expected that females with offspring would be more aggressive in accessing resources (Maestripieri, 1992). Animais were released and behaviours were observed to identify the territory, specifjcally the direction of the escape and vocalizations produced. After capture, red squirrels often move quickly to their territory and make territorial vocalizations (rattle cali; Lair, 1990). Conversely, intruders are generally chased by the territory owner. We could delineate 6 territories in the study area in 2008 and 14 in 2009. The boundaries were confirmed by cache behaviours during the experiments because red squirrels usually feed and cache conifer cones on their own territory (Hurly and Lourie, 1997). Once animais were captured and territories delineated, we began experiments in two steps. First, we tested if red squirrels observing a conspecific feeding on a food patch use this public information to access food, despite the aggressive behaviour of the owner. If they do, we tested secondly if scrounger behaviour is explained by the producer-scrounger game.
16
For both experimental designs, we placed artificial food patches that consisted on aluminum feeding trays (25 by 30 by 7 cm) containing sunflowers seeds, peanuts with or without shell and sieved sand to hide the food. The density and the richness of trays differed according to the experimental design. Before testing predictions, animais were first allowed to feed on this plate by placing it in the different territàries. Trays were renewed several times a day. After one week, ail the
/
marked individuals had been observed feeding in the artificial food patches and we started experiments to assess our predictions. The assumption of a normal distribution was met. Ali statistical analyses were performed with R version 2.10.0 for PC.
Public information experiments:
This experiment involved positioning 6 aluminum trays on a 10 by 10m square on the different red squirrels' territories within the study area. Twenty trials were run randomly during spring 2008. We ran approximately 3 trials a day, and never at the same place in a day. Four trays contained 150 sunflower seeds and 50 peanuts without shell hidden in approximately 2L of sieved sand and two trays contained only sieved sand to force animais to sample the trays in order to find food (Table 1). Sunflower seeds and peanuts were used because they are usually appreciated by small rodents. In addition, red squirrels handle them easily. Once the 6 plates were placed, the experiment began. We noted which patch was discovered first and by whom. Then we noted the presence of other red squirrels untit five minutes after the first squirrel left the trays. If another animal was present, we noted if it was watching the discoverer or not. If it did, we noted in which food tray it ate. If it did not, behaviour was not noted. Vegetation density on the study area allowed us to observe animais and differentiate what they were doing: "Head down" when foraging, "head up" when observing surroundings. In addition, red squirrels make a lot of vocalizations, specifically when intruders go through their territory. Vocalizations are good indicators that animais have seen each other. However, sometimes the second animal appeared suddenly and fed on the food patch previously discovered by another. If nothing proved that this animal did have public information, either physical
17
observation or proximate vocalizations during the presence of the first animal on the food patch, data were not used. We only used foraging behaviours of the tirst animal and the second "observer" animal to test prediction 1. However behaviours of others were noted until the end of the experiment in order to test prediction 2. We calculated the frequency at which the observer ate in the tray discovered by the first animal and the frequency at which it ate in any other patch. We cor'npared it with the expected frequency of 1:6 of eating in the same tray if animais chose the tray randomly. Frequencies were compared with a Khi square.
Producer-Scrounger model experiments
ln a second part of the study, we tested two predictions of the producer/scrounger game.
Definitions of producer and scrounger strategy:
Animais that discover a tray by sampling and consume or cache food from it are called producers. Different possibilities can occur in our experiment. Firstly, when the experiment begins, the tirst animal that discovers a patch is always a producer. Secondly, during the experiment, if an animal observes another feeding in a patch but consumes or caches food from a different patch, it is also a producer because it samples to find food. Conversely, animais that observed another feeding in a patch and then consumed or cached food from this patch are called scroungers. So scroungers can use public information from producers or others scroungèrs.
A difficulty arose when an animal sam pied and found a patch previously discovered and/or scrounged by another individuaf but more than five minutes after the producer or the scrounger had departed of this food patch. If we hadn't seen the animal in the surrounding area, on the ground or on a tree, during the exploitation of the patch, we considered several factors: the time of arrivai (5min later, 30min ... ?), the occurrence of proximatevocalizes that indicated it was in the surrounding and tinally the foraging behaviour (does the second animal seem sampling with head down or does it move
18 directly toward this patch?) in order to determine whether the animal was producing or scrounging. If we were uncertain of the status of animais, data were not used.
Effect of the finder's share:
To test the effect of the finder's share, we changed the richness of food patches (F). Two sets of twenty trials each were conducted in 2008. We made approximately 2 or 3 trials a day and never twice in the same place during a day. For any trial we placed six aluminum trays randomly on the study area, four with food and two without to force animais to sample. Food patches were chosen randomly. The experimental design of the first set corresponded to prediction 1 (public information) and was called "large finder's share": four trays with 100 sunflower seeds and 50 peanut mixed with 2L of sieved sand, two trays with only sieved sand (Table 1). It took approximately 25 minutes for an animal to depIete a food patch. The second set was called "small finder's share" and consisted of: four trays with 15 sunflowers seeds and 15 peanuts without shells mixed in 2L of sieved sand, two trays with only sand (Table 1). In this case, food patches were depleted in 5 minutes.
ln ail cases, experiments began once the 6 trays were in place. Experiments ended five minutes after the first producer departed if no one joined to it, or five minutes after the last scrounger departed. According to our definitions of producer and scrounger, a tray can be produced and scrounged several times. We identified which trays were produced and scrounged and by whom. Then we could count the number of "acts of producing" (P) and the number of "acts of scrounging" (S). We determined the frequency of scrounging as: S/(P+S). We finally compared the frequency of scrounging for the set "high finder's share" and the set "smail finder's share" for 2008 with analysis or variance (R version 2.10.0 for pC).
To assess if the arder of appearance of the set had an impact on our results, we reproduced the experimental design in reverse order with first the set "small finder's share" and secondly "large finder's share". This experimental design was conducted during the spring 2009. For unknown reasons, animais were not interested in the sunflowers seeds and in the peanuts without shell. So we tested other types of food of greater interest to red squirrels. Finally, we used peanuts with
19 shells which seemed more interesting for squirrels which often cached them in their middens. We used nine aluminum trays in a 10 by 15m square, keeping the same distance between patches as in 2008. The first set presented to animais was "small finder's share". 20 trials were made. Each trial consisted of seven trays with four peanuts mixed in 2L of sieved sand, and two trays with only sieved sand (Table 1). . The second set "large tinder's share" contained seven trays of seven peanuts mixed in 2L of sieved sand and two trays with only sand (Table 1). As before, we made 20 trials by set, approximately 3 trials a day, never in the same place during a day. Ali trials, regardless of the set, were placed randomly in the study area. Food patches were chosen randomly too. The same conditions applied for starting and ending the experiment as previously. We counted acts of producing and acts of scrounging to obtain the frequency of scrounging for the two conditions. Data for 2009 were compared in an analysis of variance (R version 2.10.0 for PC).
Effect of the cost of producing:
To test the effect of the cost of producing, we manipulated the proportion of patches containing food. Two sets of 20 experiments were conducted during spring and summer 2009. The tirst set, called "Iow cost of producing", was made of seven trays with seven peanuts mixed with sieved sand and two trays with only sand (Table 1). It corresponded to the experimental design called "large tinder's share" used to test prediction 2 in 2009. The second set, called "high cost of producing" was made of four trays with seven peanuts mixed with sieved sand and tive trays with only sand (Table 1).
As for testing the previous prediction, the experiment began once trays were placed and ended five minutes after tirst producer departed if no animal joined it or tive minutes after last scrounger departed. In addition, trials were placed randomly on the study area. We counted "acts of producing" and "acts of scrounging" to determine the frequency of scrounging for the two conditions. Data were compared with analysis of variance (R version 2.10.0 for PC).
Table 1. Characteristics of the 2008 experimental design to test the effect of the finder's share on the frequency of scrounging and the 2009 design to test the effect of the finder's share and the effect of cost of producing on the scrounger's frequency; in a population of red squirrels (Tamiasciurus hudsonicus) (SFS= small finder's share; LFS= large finder's share; SCP= small cost of producing; HCP= high cost of producing) 2008 2009 Experimental design SFS/SCP LFS/SCP SFS ISCP LFS/SCP SFS/HCP Total No. of trays 6 6 9 9 9 No. of food patches 4 4 7 7 4 No. of sunflower seeds 100 15 1 1 .1 per food patch No. of peanuts without shell 50 15 1 1 1 per food patch No. of peanuts with shell 1 1 7 4 7 Total No. of seeds 600 120 49 28 28 N o
RESULTS
Public information experiment:
Red squirrels used the public information produced by conspecifics during the exploitation of a food patch. We observed interactions between 11 marked squirrels. As predicted, when an animal observed another feeding in a patch or hoarding food from it, the probability that it would next eat in that patch was greater than the probability of eating in any other patch (x21=72, p<0.001). In 83% of the 57 cases, the observer attempted to join and feed on that food patch. Because of territorial defence, it was not always able to access this resource. Indeed, in 39% of cases, the discoverer chased the joiner away from the tray. In the other 44% of cases, the joiner vocalized and rushed toward the discoverer and obtained food aggressively (22%) or accessed it later after the discoverer had departed.
Producer/Scrounger game experiments:
Ali marked individuals (N=11 for 2008 and N=15 for 2009) used both the producing and the scrounging tactic during each experiment. As experiments were conducted in the wild we did not control the number of interactions between individuals or the length of experiments. Experiments for the set "small finder's share" were longer, approximately 86 minutes, than the set "large tinder's share", approximately 42 minutes. Regardless of experiment design, we observed on average 2 or 3 individuals per experiment. Ali marked squirrels participated with at least 2 interactions per individual for each experiment. On 10 occasions in 2008 and 22 occasions in 2009, non marked individuals were present during trials. We did not use data for 2 trials in 2008 and 3 in 2009 because animais hoarded the food too far away. So we were not certain of their status as "producer" or "scrounger" of a non marked animal which came back.
22
Effects of the finder's share:
ln both years the frequency of scrounging was significantly lower when the finder's share was greater. In 2008, scrounging acts represented 34% of total acts in the "small finder's share" condition versus 24% in the "large finder's share" condition (ANOVA F1• 34=6.36; p=0.01; Figure 1). In 2009, it was respectively 20% of
,
scrounging acts versus 10% (ANOVA F1 , 33=5.9; p=0.02; Figure 2)
The lower frequency of scrounging occurred without any change in the numbér of producing events per experiment. Indeed, we observed significantly fewer scrounging acts per trial with the large finder's share in 2008 (ANOVA F1, 34=5.28;
p=0.03; Table 2) and 2009 (ANOVA F1• 33=6.86; p::::O.01; Table 3). In addition, the
mean number of scrounging acts per individual was significantly lower with the large finder's share in 2008 (ANOVA F1, 93=6.36; p=0.01; Table 2) and 2009 (ANOVA F1,
88::::5.14; p=0.02; Table 2). However, the mean number of producing acts per trial or per individual did not change (Table 2).
Effects of the cost of producing:
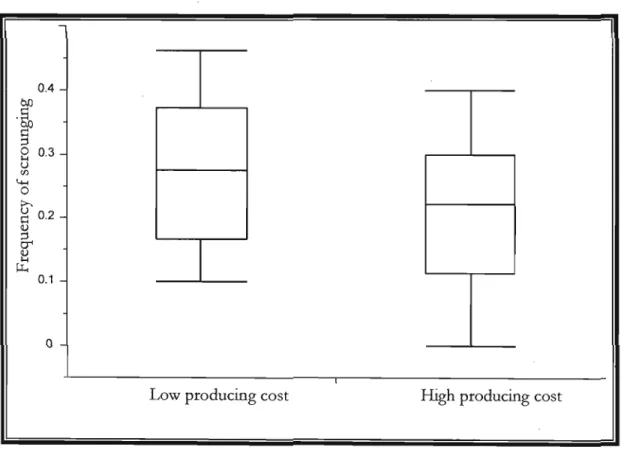
When producing costs were higher the frequency of scrounging was almost significantly higher than for lower producing costs (ANOVA F1, 38=3.5; p=0.068;
Figure 3). Howevér, the change in the cost of producing resulted in no change in the number of acts of production either per trial or per individual (Table 3). Furthermore, the number of scrounging acts per trial, but not per individual, was almost significantly greater under higher production (Table 3).
Table 2. Effects of finder's share on mean number of producing and scrounging acts by trial and by individual for 2008 when first condition presented is "small finder's share"; total of 6 trays per trial and for 2009 when first condition presented is "large finder's share"; total of 9 trays per trial (SFS= small finder's share; LFS: large finder's share;
sep=
small cost of producing) 2008 2009 Experimental design SFS/SCP LFS/SCP ANOVA SFS/SCP LFS/SCP ANOVA F dt P F dt P Total of producing acts 83 90 158 104 Mean by trial 4.6 5 0.38 1,34 0.53 7.9 6.9 1.15 1,33 0.3 Mean by individual 1.7 2.2 3.09 1,93 0.08 2.98 2.81 0.1 1,88 0.74 Total of scrounging acts 52 22 44 14 Mean by trial 2.9 1.22 5.28 1,34 0.03 2.2 0.93 6.86 1,33 0.01 Mean by individual 0.8 004 4.87 1,93 0.03 0.83 0.38 5.14 1,88 0.02 N VJTable 3. Effects of producing cost on mean number of producing and scrounging acts by trial and by individual; total of 9 trays by trial (SFS= sm ail finder's share; SCP= small cost of producing; HCP:::: high cost of producing) 2009 Experimental design SFS/SCP SFS/HCP ANOVA F df P Total of producing acts 158 159 Mean by trial 7.9 7.9 0.01 1,38 0.94 Mean by individual 2.98 2.74 0.34 1, 109 0.6 -Total of scrounging acts 44 63 Mean by trial 2.2 3.2 2.91 1,38 0.09 Mean by individual 0.83 1.1 1.59 1, 109 0.2 ~ IV
25 0.8 -.- ,...-., 0.7 0.6 0.5 04 0.3 _ 0.2 0.1
c
-0.1....J... -,- ---'Small finder's share Large finder's share
Figure 1. Effect of finder's share on the frequency of scrounging when first condition
26
0.4 bJ:J .~§
0.3 0 ~ v en 4-< 0 0.2 :>-. v Cl v ::l cr v ~ 0.1 ~ 0Large finder's share Small finder' s share
Figure 2. Effect of finder's share on the frequency of scrounging when first condition
27 00 -0.4 .~ t::
8
~ 0.3 u en 4-< oG
t:: 0.2 <l)g.
~ ~ 0.1 o
-Low producing cast High praducing cast
Figure 3. Effect of producing cost on the frequency of scrounging in 2009, (ANOVA
DISCUSSION
We studied the foraging behaviour of American red squirrels interacting with conspecifics in artificial food patches. Our study· provides the first experimental evidence for the use of public information by a territorial species. Red squirrels had to sample the different artificial patches to discover which contained food. In doing that, they generated information about the location of the resource. In addition, the successful forager provided information about the quality of the food patch by consuming peanuts or sunflower. seeds directly in the tray and/or by hoarding them in its own territory. Observing these foraging activities enabled other red squirrels to leam, without sampling, where food was available and then decide to exploit that food parch or not. As predicted, observers used public information and joined at the forager's food patch at a higher probability than any other.
Valone was the first to define the term "public information" as information about location and quality of a resource obtained by observing sampling behaviours and performance of conspecifics (Valone, 1989; Valone and Templeton, 2002; Valone, 2007). To date, different studies have supplied empirical evidence of public information use in a foraging context: Templeton and Giraldeau (1995) with starlings; Smith, Benkman and Coffey (1999) with red crossbills; and Coolen, van Bergen and Laland (2003) and van Bergen, Coolen and Laland (2004) with sticklebacks. These studies demonstrated that animais could use the success or the lack of success of conspecifics to estimate patch quality faster than by sampling patches themselves. Valone (1996) suggested that food caIls could also be used as public information to estimate patch quality and suspected that sorne mammals, specifically sorne social primates, do use them commonly. Nevertheless in ail these cases, empirical work has been conducted with social foragers. Our study is the first to report public information use with territorial foragers. Red squirrels are territorial and aggressive rodents. They defend their territory in order to protect their food stock because it is important for their winter survival (Flyger and Gates, 1982). Despite this, during our
29 experiment we saw animais visiting the territory of neighbours. When alone, they did not hesitate to sampie on the ground, in the middens or in our artificial trays until the owner returned and chased them away. In other cases, when a squirrel sampled trays in its own territory neighbours did not hesitate using this food source.
As experiments were conducted in spring and summer, various natural foods were available and abundant. The use of public information to access our artificial food patches may have given squirrels the opportunity to consume food of higher energetic quality. Public information may be more important during coId seasons when food is less abundant. At such times, public information may provide the possibility to exploit the middens or scattered caches of others or to access fortuitous discoveries. This could be an important way to survive during a period when food is hard to find. Conditions in the wild, for instance diet, proximity of territory or caching behaviours, are likely to favour the use of conspecifics to obtain public information in ·order to access food sources. It could be interesting in future work on squirrels to test the different predictions about patch quality confirmed with social birds and fishes. Indeed, in our preliminary experiments we first tested different kinds of food and we observed that animais were less interested to consume and to joïn when food trays contained conifer seeds (personal observation). As experiments were done in the wild, conifer seeds were a natural source of food available, which could explain their lack of iriterest for them in our artificial patches. For this reason we assume that observers could assess not only the location of food patches but also their quality. We thus employ the term "public information" rather than "social information".
Social information only informs about the location of a resource and to date has been suggested in a foraging context with another territorial rodent, the eastern chipmunk, Tamias striatus (Hall, Humphries and Kramer, 2007; Valone and Templeton, 2002; Valone, 2007). Hall, Humphries and Kramer (2007) noted in an experiment about resource tracking that chipmunks sampied a renewing patch more often when the number of animais visiting it increased. However, in this experiment, there was only one patch to visit and the authors did not identify the eues (visual, auditive or olfactory) used by chipmunks. So, it remains to be shown that these
30
animais are using cues obtained from conspecifics to locate for food or to estimate patch quality too as in a case of public information use.ln the second part of our study, we showed that squirrels forage in ways predicted by the producerlscrounger game. Once again, it is the first time that this has been confirmed with a territorial and aggressive species. We tested two predictions of the mode!. Firstly, in our experiments red squirrels varied their use of the scrounger tactic in response to manipulation of the finder's share, as predicted by the producerlscrounger model (Vickery et al. 1991). We observed a low frequency of scrounging when the finder's share was high. Different experiments have reported the existence of the finder's share on social foraging groups. Di Bitetti and Janson (2001), with wild tufted capuchin monkeys Cebus apella, investigated social factors that affect it, specifically spatial position and rank of dominance. They observed that the discoverer could consume more food by increasing interindividual distance and by avoiding food-association vocalizations. Thus they concluded that finder's share was a function of the total amount of food in the patch and the time until scroungers arrived. Ha and Ha (2003) studied north-western crows Corvus caurinus and the probability of prey retention by the discoverer, a measure they assumed to correspond to finder's share in a context of non divisible food. They demonstrated that large prey items with long handling times were likely to be stolen, This suggests a small finder's share. These studies produced information about factors influencing the size of the finder's share but did not relate them to producerlscrounger game predictions. This connection had only been made by Coolen, Giraldeau and Lavoie (2001) and Coolen (2002) with a ground-feeding bird, the nutmeg manikin Lonchura punctulata. In these studies, finder's share was manipulated by changing food distribution. When food was clurnped in a few rich patches the finder's share was small, conversely when food was distributed in many poor patches the finder's share was large. Their results were consistent with the model's wediction in that scrounging frequency was higher with a small finder's share, as in our experiments. These studies with nutmeg manikins were done in captivity. Our study is the first to test the effect of the finder's share in the wild.
31
As our experiments were done in the wild, we could manipulate neither the time of arrivai of squirrels nor the number of participants. So, each experiment was different, never the same individuals together, never the same order of arrivaI. Ali the squirrels in the study area used both the producer and scrounger tactics. So, despite the fact that almost ail animais participated in more than one trial, we assume that individual effects were much less important than environmental variability and were unlikely to have influenced our results.To test the first prediction, we changed the amount of food in food patches in order to change the finder's share. In the condition of "small finder's share", obtained with a high amount of food per patch, this could produce a bias if an animal arrived and scrounged a tray which was almost completely depleted. In this case, the scrounger may underestimate the quality of this patch because there is Iittle food remaining and forage as in the condition "large finder's share". However, we do not believe that this influenced our results because we observed that red squirrels frequently both produced and scrounged during the same trial. We assume that this important individual flexibility allowed them to avoid the underestimation by evaluating real patch quality in the patches which they discovered. In addition, we stopped experiments before ail the trays with food were completely depleted.
As trays in "small finder's share" contained more food, experiments of this set lasted longer than experiments in "large finder's share". We do not believe that this produced a bias by increasing the possibility of scrounging in the "small finder's share". In both experimental designs, when an observer arrived, it had the same opportunities, produce in the five others trays (for 2008) or scrounge in the tray already occupied by the conspecifics. In addition, our· results concerned the frequency of scrounging and not the intensity of scrounging. So we did not count how many times the observer scrounged in the same tray but only how many trays it scrounged. In this way, we assume that the difference in time of experiments should not produce a bias and that our results reflect the effect of the finder's share.
We secondly tested a prediction of Dubois's model (2005) and we observed
1
foraging behaviours in agreement with the model: when food patch density decreased, the frequency of scrounging increased. Reducing the number of patches