Journal of Personality and Social Psychology Copyright 2000 by the American Psychological Association, Inc.
2000, Vol. 79, No. 5, 763-775 0022-3514/00/$5.00 DOI: 10.1037//0022-3514.79.5.763
Beyond Prejudice as Simple Antipathy:
Hostile and Benevolent Sexism Across Cultures
Peter Glick, Susan T. Fiske, Antonio Mladinic, Jos6 L. Saiz, Dominic Abrams, Barbara Masser,
Bolanle Adetoun, Johnstone E. Osagie, Adebowale Akande, Amos Alao, Annetje Brunner,
Tineke M. Willemsen, Kettie Chipeta, Benoit Dardenne, Ap Dijksterhuis, Daniel Wigboldus, Thomas Eckes,
Iris Six-Materna, Francisca Exp6sito, Miguel Moya, Margaret Foddy, Hyun-Jeong Kim, Mafia Lameiras,
Mafia Jos6 Sotelo, Angelica Mucchi-Faina, Myrna Romani, Nuray Sakalh, Bola Udegbe, Mafiko Yamamoto,
Miyoko Ui, Mafia Cristina Ferreira, and Wilson L6pez L6pez
The authors argue that complementary hostile and benevolent components of sexism exist across cultures. Male dominance creates hostile sexism (HS), but men's dependence on women fosters benevolent sexism (BS)--subjectively positive attitudes that put women on a pedestal but reinforce their subordination. Research with 15,000 men and women in 19 nations showed that (a) HS and BS are coherent constructs that correlate positively across nations, but (b) HS predicts the ascription of negative and BS the ascription of positive traits to women, (c) relative to men, women are more likely to reject HS than BS, especially when overall levels of sexism in a culture are high, and (d) national averages on BS and HS predict gender inequality across nations. These results challenge prevailing notions of prejudice as an antipathy in that BS (an affectionate, patronizing ideology) reflects inequality and is a cross-culturally pervasive complement to HS.The idea that "prejudice is an antipathy" (Allport, 1954, p. 9) is the bedrock on which virtually all prejudice theories are built. This assumption has blinded social psychologists to the true nature of sexism (and perhaps other prejudices as well; see Fiske, Xu, Cuddy, & Glick, 1999; Glick & Fiske, in press; Jackman, 1994), which encompasses not just hostile sexism (HS) but also benevo-
lent sexism (BS), a subjectively positive orientation of protection,
idealization, and affection directed toward women that, like HS, serves to justify w o m e n ' s subordinate status to men (Glick &
Fiske, 1996). Whereas HS is likely to elicit w o m e n ' s outrage, BS may often obtain their acquiescence, as it works effectively and invisibly to promote gender inequality.
W e present evidence that (a) HS and BS are pervasive across cultures, supporting the contention that they originate in social and biological factors c o m m o n among h u m a n groups, (b) HS and BS are complementary ideologies, such that nations in which HS is strongly endorsed are those in which BS is strongly endorsed, (c) HS and BS predict opposing valences in attitudes toward women,
Peter Glick, Department of Psychology, Lawrence University; Susan T. Fiske, Department of Psychology, Princeton University; Antonio Mladinic, Department of Psychology, Pontificia Universidad Cat61ica de Chile, Chile; Jos4 L. Saiz, Department of Psychology, Universidad de La Fron- tera, Chile; Dominic Abrams and Barbara Masser, Department of Psychol- ogy, University of Kent at Canterbury, England; Bolanle Adetoun, Depart- ment of Counselling, Centre for Sustainable Development and Gender Issues, Nigeria; Johnstone E. Osagie, School of Business, Alcorn State University; Adebowale Akande, School of Behavioral Science, Potchef- stroom University, South Africa; Amos Alao, Department of Counselling, University of Botswana, Botswana; Annetje Brunner and Tineke M. Wil- lemsen, Depamnent of Women's Studies, Tilburg University, the Nether- lands; Kettie Chipeta, KC Consultancy, Botswana; Benoit Dardenne, De- partment of Psychology, University of Liege, Belgium; Ap Dijksterhuis and Daniel Wigboldus, Department of Social Psychology, University of Nijmegen, the Netherlands; Thomas Eckes, Department of Psychology, University of Wuppertal, Germany; Iris Six-Materna, Department of Psy- chology, University of Kiel, Germany; Francisca Exp6sito and Miguel Moya, Department of Psychology, Universidad de Granada, Spain; Mar- garet Foddy, School of Psychology, La Trobe University, Australia; Hyun- Jeong Kim, Department of Psychology, Ewha Womans University, South Korea; Mafia Lameiras and Mafia Jos6 Sotelo, Department of Psychosocial and Educational Analysis and Intervention, Universidad de Vigo, Spain; Angelica Mucchi-Falna and Myrna Romani, Institute of Pedagogy, Uni-
763
versity of Perugia, Italy; Nuray Sakalh, Department of Psychology, Middle East Technical University, Turkey; Bola Udegbe, Department of Psychol- ogy, University of Ibadan, Nigeria; Mariko Yamamoto and Miyoko Ui, Department of Psychology, University of Tsukuba, Japan; Maria Cristina Ferreira, Instituto de Psicologia, Universidade do Estado do Rio de Janeiro; Wilson L6pez L6pez, Department of Psychology, Universidad Konrad Lorenz, Bogat,-t, Colombia.
Barbara Masser is now at the School of Psychology, University of Queensland, Australia; Thomas Eckes is now at the Department of Psy- chology, University of Dresden, Germany; and Angelica Mucchi-Faina is now at the Department of Sociology, University of Rome "La Sapienza." We are grateful to Alice Eagly, Wendy Wood, and Laura Mourino-Casas (of the United Nations Development Programme) for their advice on the use of the United Nations indices of gender equality (and to Tony Man- stead for originally pointing us in this direction); Felicia Pratto for her comments on the manuscript; Paul Norris, for help retrieving previously collected ASI data; and Maggie Thomas, Dara Rakun, Kunal Saigal, Vibhuthi Hate, Tetteh Otuteye, Rob Reff, and Cindy Prochnow for their help coding data.
Correspondence concerning this article should be addressed to Peter Glick, Department of Psychology, Lawrence University, Appleton, Wis- consin 54912-0599. Electronic mail may be sent to peter.s.glick@ lawrence.edu.
(d) women, as compared with men, reject HS but often accept BS, a tendency most pronounced in more sexist cultures, where women may experience heightened needs for the protection, idealization, and affection BS promises, and (e) national HS and BS averages predict variation in gender inequality across nations.
Hostile a n d B e n e v o l e n t S e x i s m
Cross-culturally, women, relative to men, are a disadvantaged group, as indicated by, for example, differences in earnings and the low percentage of women in the most powerful roles in business and government (United Nations Development Programme, 1998). Nevertheless, Eagly and Mladinic (1994) found that women are actually stereotyped more positively than men are, with men as well as women attributing highly favorable traits (e.g., warmth and nurturance) to women. For an antipathy model of prejudice, the coexistence of women's general subordination and Eagly and Mladinic's "women are wonderful" effect is a paradox. One alter- native is that women are viewed positively on some dimensions, such as warmth, and negatively on others, such as competence (Eagly & Mladinic~ 1994; Fiske, 1998; Fiske et al., 1999; Glick & Fiske, in press). Another related alternative is that subjectively favorable attitudes toward women can themselves be a form of prejudice in that they s~erve to justify and maintain women's subordination.
Glick and Fiske (1996) hypothesized that hostile and benevolent attitudes toward women are complementary components of sexism common among past and present human societies. Apart from anecdotal evidence that polarized attitudes toward women (e.g., the virgin-whore dichotomy; Tavris & Wade, 1984) have existed since ancient times (see Pomeroy, 1975), sound theoretical reasons suggest that HS and BS are, and long have been, pervasive prej- udices. Glick and Fiske (1996) argued that HS and BS stem from social and biological conditions common to human societies: pa- triarchy, gender differentiation, and sexual reproduction. Patriar- chy (male dominance), varying considerably in degree, is wide- spread across cultures (Harris, 1991; Pratto, 1996), though not necessarily universal (see Salzman, 1999). Additionally, in most cultures, women and men are differentiated in that (to a greater or lesser extent) they often inhabit different social roles and occupa- tions (Eagly & Wood, 1999) and are attributed different traits (Williams & Best, 1982). Finally, sexual reproduction is a biolog- ical constant that is related to social roles, as women's roles are largely defined by childbearing and child rearing (Eagly, 1987), and that promotes intimate relationships between men and women. Patriarchy, gender differentiation, and sexual reproduction com- bine to create HS and BS. Dominant groups, whether based on gender or other distinctions, inevitably propagate system- justifying ideologies of their superiority, which are often accepted even by members of socially subordinate groups (Jost & Banaji, 1994; see also Jost & Burgess, 2000; Jost, Burgess, & Mosso, in press). Thus, men's dominance creates HS, hostile attitudes about women. This dominance is largely enacted in and reinforced by gender roles and stereotypes. Furthermore, men often exert their power over women within sexual relationships, and women can potentially counter men's power through sexuality (e.g., by using sexual attractiveness to control men). Therefore, concerns about power, gender differentiation, and sexuality are bound together as components of HS. In a modem context in which social move-
ments and increasing gender equality threaten traditional male dominance, HS may be directed most strongly at women who challenge men's power (e.g., feminists) and status (e.g., career women), as well as toward women who are perceived as using their sexual allure to gain power over men (e.g., temptresses).
However, sexual reproduction and men's dependence on women to fulfill domestic roles create a dependency and intimacy between the sexes that counterbalances sexist hostility with a subjectively benevolent view of women, BS. Although men dominate cross- culturally, they rely on women to produce and to nurture offspring, for domestic labor, and to fulfill sexual and intimacy needs, lending women power in intimate relationships (Guttentag & Sec- ord, 1983). This dependence, Glick and Fiske (1996) argued, precipitates subjectively benevolent but paternalistic attitudes to- ward women, as men "can't live without them." BS is sexist in that it presumes women's inferiority (it recognizes and reinforces pa- triarchy by portraying women as needing men to protect and provide for them) hut is subjectively positive (from the perspective of the sexist perceiver) in that it characterizes (at least some) women as wonderful, pure creatures whose love is required to make a man whole. Like I-IS, BS encompasses attitudes related to power, gender differentiation, and heterosexuality.
The 22-item Ambivalent Sexism Inventory (ASI; Glick & Fiske, 1996), initially developed and validated in six studies (involving both college students and older adults) in the United States (Glick & Fiske, 1996), is a self-report measure of sexist attitudes com- posed of separate 11-item I-IS and BS subscales (see Appendix). HS is evidenced by an adversarial view of gender relations in which women are perceived as seeking to control men, whether through sexuality or feminist ideology. Potential HS items that baldly asserted women's inferiority were strongly rejected by respondents in the United States and were therefore not included in the scale. Thus, the I-IS scale is a relatively subtle and contempo- rary measure of sexist hostility. Nevertheless, given that the pre- dominant theme is a hostile reaction to women challenging men's authority and power, we believe that it is an extension of, and is consistent with, traditional forms of sexist hostility; this belief is supported by moderate to strong correlations (Glick & Fiske, 1996) between HS and measures of blatant sexism such as the Attitudes Toward Women Scale (AWS; Spence & I-Ielmreich, 1972) and the Old-Fashioned Sexism Scale (Swim, Aikin, Hall, & Hunter, 1995).
In contrast, BS items suggest that women are pure creatures who ought to be adored and placed on a pedestal but are also weak and in need of protection. Although the BS scale, because it represents a subtle form of prejudice, is sometimes lumped together with measures of uniquely contemporary forms of sexism such as Modem Sexism (MS; Swim et al., 1995) or Neo-Sexism (NS; Tougas, Brown, Beaton, & Joly, 1995), BS was never hypothe- sized to be a recent development (Glick & Fiske, 1996). Indeed, BS items have a much less contemporary flavor (e.g., the notion that women are more pure than men) than I-IS items do, perhaps because BS, because of its positive tone, has not been challenged as vigorously in egalitarian societies as has sexist hostility. Unlike the BS scale, the MS and NS measures assume that sexism is an antipathy but that the antipathy is disguised as political and social egalitarianism within cultures that promote this value. The atti- tudes tapped by the BS scale are not disguised as egalitarian; rather, they seem closer to medieval ideologies of chivalry (Tavris
HOSTILE AND BENEVOLENT SEXISM 765
& Wade, 1984) than they are to contemporary "political correct- ness." BS is rooted in the structure of personal relationships between men and women, not in public politics.
The BS scale is correlated moderately strongly with HS, but once this relationship is controlled, it has strong discriminant validity, correlating weakly or not at all with fi variety of other measures of sexism based on an antipathy model, such as the AWS and the MS Scale (Glick & Fiske, 1996; Massel~ & Abrams, 1999). Three subdimensions, related to the underlying structural factors of patriarchy, gender differentiation, and sexual reproduction, consis- tently emerge as BS subfactors in factor analyses of the ASI:
protective paternalism
(e.g., women ought to be rescued first in emergencies),complementary gender differentiation
(e.g., women are more pure than men), andheterosexual intimacy
(e.g., every man ought to have a woman he adores). Although HS scale items also address power relations, gender differentiation, and sexuality, this scale has proven to be unidimensional (see Glick & Fiske,1996, for speculations as to why this is the case).
That HS and BS are complementary ideologies is suggested by their positive correlation. When this correlation is controlled sta- tistically, however, HS predicts negative and BS predicts positive attitudes toward and stereotypes about women (Glick, Diebold, Bailey-Werner, & Zhu, 1997; Glick & Fiske, 1996), supporting the contention that BS is a subjectively positive form of prejudice. Although people who score high on both scales can be character- ized as ambivalent toward women, they seem to reconcile their hostile and benevolent attitudes by classifying women into good and bad subtypes, evincing, for example, hostility toward career women and affection for homemakers (Glick et al., 1997). BS may help to legitimate HS by allowing sexist men to conceive of themselves as benefactors of women and to excuse their hostility as being directed only at women who allegedly deserve it. Fur- thermore, because BS fosters behaviors that are normally deemed prosocial, such as helping or protecting women, women tend to accept rather than challenge BS (Glick & Fiske, 1996; Kilianski & Rudman, 1998).
The claim that BS is a form of sexism relies on the putative relationship of BS to the subordination of women. Jackman (1994) illuminated the greater effectiveness of paternalistic prejudices such as BS, as compared with outfight antipathy, in gaining compliance (rather than resistance) from low-status groups. Whereas HS serves to punish women who fail to conform to (male-defined) acceptable roles, BS represents the rewards women reap when they do conform (Glick et al., 1997). Women who embrace conventional, sanctioned roles are protected and revered. As any psychologist knows, reward is far more effective than punishment is in eliciting conformity. Thus, the combination of HS and BS may be particularly effective as complementary justifica- tions or "legitimating myths" (Sidanius, Pratto, & Bobo, 1994, p. 999) that serve to maintain gender inequality.
Jost and Banaji's (1994) system-justification theory suggests that subordinate groups often accept legitimizing myths that justify the status quo but that acceptance of such ideologies is tempered because overtly hostile ideologies about one's group contradict individual and group interests (Jost et al., in press). In contrast, prejudiced ideologies that are ostensibly benevolent may be se- ductive to subordinate group members, because they do not appear to contradict self- and group interests. Women may be attracted to BS more than to HS because it not only justifies the system as a
whole but also promises rewards from the more powerful group (protection, adoration, intimacy). What may be particularly insid- ious is that women are likely to value these rewards more highly in cultures in which they perceive many men to be hostile. In highly sexist societies, men provide both the threat (HS) and the solution to the threat (BS and the protection, provision, and affec- tion it promises); women in these societies are presented with a stark choice--reject BS and face the wrath of HS, or accept BS and avoid HS. In more egalitarian societies, women may be freer to reject BS as well as HS, because they are less likely to be as dependent on men for resources and because rejecting BS is not as likely to elicit sexist hostility.
Cross-Cultural Implications and Research Questions We have hypothesized that sexist prejudice is not expressed through antipathy alone, that HS and BS are complementary sexist ideologies that are common across cultures, and that BS, as well as HS, is related to the oppression of women. These claims--which currently lack supportive evidence and, as far as BS is concerned, can be viewed as contradicting well-established views of prejudice as an antipathy--can be tested rigorously only through cross- cultural comparisons. Because the variation between countries in gender equality is measurable (United Nations Development Pro- gramme, 1998), cross-national comparisons not only afford a realistic test of the hypothesis that BS goes hand in hand with HS but also test the notion that both BS and HS are related to women's subordination (i.e., that BS is indeed a form of sexism).
Specifically, we ask the following questions: (a) Do HS and BS exist--that is, can they be reliably and validly identified--across cultures? (b) As has been found in the United States, are HS and BS positively correlated among respondents within countries, and do average HS and BS scores covary across nations, indicating that HS and BS are mutually supportive sexist ideologies? (c) As in the United States, do HS and BS predict opposing valences in stereo- types about women, confirming that HS is an antagonistic and BS a subjectively favorable orientation toward women? (d) Are women (as compared with men) relatively more accepting of BS than of HS and, across nations, does women's (as compared with men's) acceptance of BS increase when men's sexism is more pronounced? and (e) Across cultures, is BS, as well as HS, related to objective measures of women's oppression, suggesting that both forms of sexism justify and maintain gender inequality?
Overview of Research Strategy and Cross-Cultural Considerations
Researchers in 19 countries administered the ASI, translated in non-English-speaking countries. Even if HS and BS exist across cultures, the ASI scales could be culturally specific, having been developed and validated only in the United States. Cross-cultural psychologists (see Triandis & Marfn, 1983) distinguish between etics, which are universal phenomena, and emics, which are cul- turally specific (but which can be culture-specific markers for etics). In this terminology, it is possible that the constructs of HS and BS are emics, unique to the United States and possibly Europe (and related nations such as Canada and Australia). Theoretically, however, the constructs of HS and BS ought to be etics, as we have hypothesized that HS and BS originate in social and biological
factors c o m m o n to h u m a n groups. Nevertheless, the HS and BS scales might b e emics that validly tap the wider constructs only in the United States. If this were the case, culturally specific mea- sures o f HS and BS would be necessary. Alternatively, the HS and BS scales may be good indicators of the hypothesized etics in a variety of cultures.
From a pragmatic point of view, keeping the measures constant is highly desirable. Culture-specific measures would both be labor- intensive to produce and result in comparisons that, though hoped to b e appropriate at the level of the hypothesized etics, would be incommensurable at the operational level. Rather than presuming a priori that specific scale items would not generalize, we used the original items and designed our research to provide multiple tests of the validity of the scales by (a) gathering samples large enough to perform confirmatory factor analyses testing alternative models of the factor structure of the A S I - - b e c a n s e the A S I ' s structure is complex, its replication would provide significant evidence not only for the coherence of the scale but also for its construct validity; (b) including, where possible, a predictive validity task in which respondents generated their spontaneous stereotypes of women and then rated the valence of each trait they generated, to test whether HS predicts negative and BS predicts positive trait valences; and (c) correlating, across countries, national means on HS and BS with the United Nations indices of national gender equality, on the basis of objective measures (e.g., percentage of professionals who are women, educational level of men and women).
M e t h o d
National Samples
The ASI was filled out by over 15,000 respondents (both men and women) in 19 nations: Australia, Belgium, Botswana, Brazil, Chile, Co- lombia, Cuba, England, Germany, Italy, Japan, the Netherlands, Nigeria, Portugal, Spain, South Africa, South Korea, Turkey, and the United States) Sample sizes ranged from about 250 to 1,600 respondents (with most samples having over 500 respondents). In some cases, several sam- pies were collected and combined within a country. In all but one case (the Netherlands), the samples cannot be presumed to be representative of the country in which they were gathered. In some countries (Belgium, Brazil, Colombia, Cuba, England, Italy, Japan, Portugal, South Africa, Turkey, the United States) the respondents were exclusively college students, typically recruited in classes. In other countries, participants were more diverse: Almost all (90%) of the respondents in the Netherlands were from a representative national sample, and almost all (over 90%) of the male respondents and 50% of the female respondents in Spain were from community samples. Approximately 50% of the respondents in Australia and Botswana, 40% in South Korea, and a significant minority of respon- dents in Chile (25%), Germany (20%), and Nigeria (20%) were Older adults from more diverse backgrounds. Like most respondents, the countries were not randomly selected. Nevertheless, this set of nations represents consid- erable geographic, cultural, and economic diversity, as well as significant variation on the United Nations indices of national gender equality (the countries ranged from the 15th to the 95th percentile on the Gender Empowermeat Measure, or GEM, described in the following section).
Measures
ASI. Researchers in each non-English-speaking country translated and back-translated the 22-item version of the ASI. The coauthors in each nation served as cultural informants about the appropriateness of individual ASI items, and many noted that reverse-worded items from the original
ASI (which are framed as negative statements) did not typically translate well (a perception conf'n'rned by poor loadings on later factor analyses). Because some samples were collected with reversed wording and other, later samples were collected with nonreversed wording for these six items, the items were eliminated from all reported analyses, so that the measure was comparable across samples. 2 For future cross-cultural work, however, we recommend the full scale with nonreversed wording for all items, as reproduced in the Appendix.
Stereotypes of women. In 12 countries, some or all participants gen- erated, in a free-response format, up to 10 personality traits that most quickly came to mind as being characteristics the participant associates with women. Participants then indicated how negative or positive they thought each trait was by rating each trait on a 7-point Likert-type scale ranging from - 3 (extremely negative) to 3 (extremely positive). The
strength of this measure is that it assesses respondents' spontaneous ste- reotypes (rather than supplying a list of traits determined by the researcher, which might be appropriate for some cultures and not others) and allows respondents to define the subjective positivity or negativity of each trait.
United Nations indices of gender equality. The United Nations Devel- opment Programme (1998) has published two objective indices of national gender equality. The GEM assesses women's (relative to men's) actual participation in the economy (percentage of administrators, managers, and professional and technical workers who are women, women's share of earned income) and in politics (percentage of parliament seats held by women). The larger the GEM, the more gender equality there is in a country's economic and political life. The Gender-Related Development Index (GDI) is a form of the United Nations' Human Development Index (HDI), which focuses on longevity (life expectancy), knowledge (adult literacy rates, years of schooling), and standard of living (purchasing power). The GDI uses the same measures as the HDI, but the score is decreased for gender inequality (e.g., women having a lower literacy rate). The greater the gender disparity, the lower the GDI is relative to the HDI.
R e s u l t s
Factor Structure o f the A S I
If the A S I ' s complex factor structure replicates in various na- tions, this would support our contention that HS and BS are pervasive forms of sexism arising from c o m m o n aspects of the h u m a n condition. Although in U.S. samples, the HS scale has proven to be unidimensional, the BS scale has consistently dem- onstrated three predicted subcomponents--protective paternalism, complementary gender differentiation, and heterosexual intimacy (Glick & Fiske, 1996).
For each national sample, confirmatory factor analyses (using LISREL 8.0; Jtireskog & Stirbom, 1993) tested the fit of several alternative models: (a) a one-factor model (all items assess a general sexism f a c t o r - - a plausible model, as HS and BS are typically positively correlated), (b) a two-factor model (the items load on separate, though correlated, HS and BS factors, but no BS
Portions of the data from some countries are published elsewhere: Chile (Mladinic, Saiz, Diaz, Ortega, & Oyarce, 1998), Germany (Eckes & Six-Materna, 1999), South Korea (Kim, 1998), Spain (Exptsito, Moya, & Glick, 1998), and the United States (Glick & Fiske, 1996).
2 Glick and Fiske (1996) provided evidence that the relationship of the ASI to other sexism measures is similar when no items are reverse-worded, as compared with when some items are reverse-worded. Analyses in which the reverse-worded items were included for the current samples did not substantially change the ASI means, HS-BS correlations, or the ASI scales' relationships to other measures (e.g., the United Nations indices).
HOSTILE AND BENEVOLENT SEXISM 767
subfactors are distinguished), (c) a 4-factor model (HS, protective paternalism, complementary gender differentiation, and heterosex- ual intimacy; this model treats the hypothesized BS subfactors as independent factors that are not nested within an overall BS factor), and (d) a preferred model (HS, in addition to BS with three subfactors). In the preferred model, BS encompasses the three subfactors (rather than treating them as independent factors). The preferred model is a stringent one in which the BS subfactors are restricted from correlating directly with HS. Because HS and BS are thought to be complementary aspects of sexism, however, these two general factors are allowed to correlate. The fit of the various models is shown in Table 1.
The primary measure of model fit is the goodness-of-fit index (GFI), which is standardized on a 0 - 1 scale, allowing for direct comparisons across samples of differing sizes. Comparisons of the relative fit of different models within each sample, however, require the chi-square difference test (Bollen, 1989), which deter- mines whether differences in fit are statistically significant. Be- cause large samples are needed to achieve stable and accurate factor solutions (especially with the relatively complex model tested here), results for samples of fewer than 500 respondents should be considered potentially unstable.
Using the chi-square difference test, we compared the alterna- tive models (one-factor, two-factor, and four-factor) with the pre- ferred model (HS, in addition to BS with three subfactors, which past research has established as the best fit in U.S. samples). In all but three nations, the preferred model was statistically superior to all of the alternative models, with chi-squares significant at p < .01. In Cuba and Japan, although the preferred model fit signifi- cantly better than the one-factor and four-factor models, it did not exceed the fit o f the two-factor model, and in Colombia, the preferred model only exceeded the fit of the one-factor model. Overall, with few exceptions, the preferred model had the best fit (and in two of the three exceptional samples, Colombia and Cuba,
the number of participants was fewer than the recommended minimum for performing factor analysis). In general, fits of the preferred model were within the range established previously in U.S. samples of similar size (GFIs in the low .90s for large samples and high .80s for small samples).
In the United States, the fit of the preferred model has proven to be similar for both women and men. Among the current samples, there were nine of sufficient size (at least 300 participants of each gender: Brazil, Chile, Germany, the Netherlands, Nigeria, South Korea, Spain, Turkey, the United States) to test the preferred model by fitting it simultaneously but separately for men and women (J6reskog & S6rbom, 1993). The most stringent test re- quired the same parameters (i.e., identical factor loadings and factor correlations) for both genders. The GFIs for this comparison ranged from .88 (Spain) to .93 (the United States). Because H S - B S correlations have differed for men and women in some U.S. samples, we let the H S - B S factor correlations vary to achieve a better fit. These analyses yielded acceptable GFIs ranging from .90 (the Netherlands, Turkey) to .93 (Germany, the United States), indicating similar models for women and men with, in some cases, possible differences in H S - B S correlations (an issue explored in detail later in this article).
Overall, the factor analytic results support the hypothesis that HS and BS are not specific to the United States but are coherent ideologies evident across cultures and that the ASI is a valid measure of these constructs, at least in the countries tested. Fur- thermore, the general superiority of the preferred model, as com- pared with the alternatives, suggests that (a) HS and BS are separate constructs (as shown by comparisons with the one-factor model), (b) BS has separable subfactors (as shown by comparisons with the two-factor model), and (c) the BS subfactors are best conceived as being nested within an overall BS scale (as shown by comparison with the four-factor model).
Table 1
Goodness of Fit of Alternative Models and Preferred Model Across Countries
Country One-factor model Two-factor model Four-factor model Preferred model N
Spain .71 .90 .77 .93 a 1,625 The Netherlands .75 .91 .79 .92 a 1,592 South Korea .89 .89 .89 .93 a 1,555 Chile .67 .91 .87 .93 a 1,354 United States .76 .90 .83 .95" 1,257 Nigeria .85 .92 .91 .93 a 1,023 Germany .73 .90 .89 .93 a 878 Brazil .75 .88 .85 .91 a 826 England .76 .88 .82 .91 a 728 Turkey .77 .91 .89 .91 a 694 Japan .84 .91 .88 .908 550 Belgium .71 .9 t .89 .92 ~ 528 South Africa .87 .92 .77 .93 ~ 514 Australia .76 .81 .67 .89 a 454 Botswana .90 .93 .92 .94 ~ 372 Italy .72 .83 .85 .86 a 324 Portugal .76 .84 .81 .86 a 286 Cuba .71 .87 .81 .87 b 286 Colombia .71 .87 .92 .87 c 248
a Fit is significantly better than all alternative models at p < .01. b Fit is significantly better than one-factor and four-factor models at p < .01. ¢ Fit is significantly better than one-factor model at p < .01.
Table 2
Correlations Between Hostile and Benevolent Sexism
Men Country Correlation N Women Correlation Difference (z) Spain .49** 1,186 .64** 439 -4.44** The Netherlands .44** 887 .61"* 705 -4.69** South Korea .16"* 1,010 .32** 545 -3.00** Chile .36** 689 .33** 665 0.62 United States .44** 528 .44** 729 0.00 Nigeria .03 576 .11 * 437 - 1.26 Germany .25"* 383 .31"* 495 -0.97 Brazil .29** 338 .36** 488 - 1.10 England .31"* 243 .51"* 485 -3.06** Turkey .21"* 376 .35** 315 - 1.98" Japan .19"* 330 .50** 220 -4.08** Belgium .18~" 110 .15"* 418 0.29 South Africa .06 182 .10t 314 - 0.43 Australia .45** 192 .46** 262 -0.09 Botswana - . 1 4 151 .17" 219 -4.30** Italy .08 125 .31"* 199 -2.09" Portugal .16 59 .45** 227 -2.17" Cuba .20* 126 .50** 160 -2.87** Colombia .27** 60 .34** 174 -0.50 * p < .05. **p < .01. t p < .10, marginally significant.
Raw Score Reliabilities
The remaining analyses involve raw ASI scores (not factor scores). The unidimensional HS scale, with alphas ranging from .68 to .89, proved (as in prior U.S. samples) more internally consistent than the multidimensional BS subscale, for which al- phas ranged from .53 to .84. W e also examined the reliability of each BS subscale. Across countries, the m e a n alphas for each scale were .54 for protective paternalism, .61 for complementary gender differentiation, and .54 for heterosexual intimacy. Within each country, alphas for each of the BS subfactors were always lower than the alpha for the overall BS scale was.
The alphas for BS were lowest in the three African samples and the Cuban sample (ranging from .53 to .57, with all other samples at .64 or higher). Item-total correlations in these cases did not suggest that any specific BS items were to blame; rather, most of the item-total correlations were weak. W e do not believe that the low alphas are particularly worrisome, given that (a) BS is a multidimensional scale and therefore ought to show lower internal consistency (Cronbach & Meehl, 1955), and (b) the LISREL factor analyses, which are more sophisticated analyses of scale structure than alpha is and which correct for error variance, show extremely good fit for the preferred factor model for all three African coun- tries (GFIs of .93 to .94) and acceptable fit for the (relatively small) Cuban sample (GFI = .87).
Correlations Between HS and BS
In U.S. samples (with the exception of adult men in two small samples; Glick & Fiske, 1996), HS and BS are typically correlated in the .40 to .50 range, supporting the notion that although HS and BS are distinct (as factor analyses consistently show), they both are forms of sexism. Table 2 reports correlations between HS and BS scale scores within each country. The results are fairly consistent,
with significant positive correlations appearing for both men and women in most countries, with the exception of men in Belgium, Botswana, Italy, Nigeria, and Portugal and both men and women in South Africa. In some U.S. samples, H S - B S correlations were stronger for women than for men, suggesting that m e n ' s hostile and benevolent attitudes may be more differentiated than w o m e n ' s (Glick & Fiske, 1996). Significant gender differences, with wom- e n ' s correlations higher than m e n ' s , occurred in 10 countries: Botswana, Cuba, England, Italy, Japan, the Netherlands, Portugal, South Korea, Spain, and Turkey (see Table 2 for z tests). Com- paring across the 19 nations, the average H S - B S correlation among men (r = .23) was significantly smaller than the average correlation for women (r = .37), t(18) = 5.02, p < .01. Despite these gender differences, the trend was toward significantly posi- tive H S - B S correlations in most countries (13 of 19 for men, 18 of 19 for women). 3
The ASI and Stereotypes of Women
Prior research in the United States has shown that despite the positive oorrelatiorj between the scales, HS predicts negative and BS predicts positive attitudes toward and stereotypes about women. In 12 countries, some or all respondents were asked to
3 We also examined the correlations of each BS subscale with the HS scale, separately for women and men. The BS subfactors correlated weakly to moderately with HS. The correlations with HS averaged across countries were, for men and women respectively, .21 and .37 for Protective Paternalism, .14 and .28 for Complementary Gender Differentiation, and .20 and .26 for Heterosexual Intimacy. For the countries in which the HS-BS correlation was low for men, there was no discernable pattern such that any single subfactor accounted for the lack of HS-BS correlation (i.e., in these cases all BS subfactors were weakly, usually nonsignificantly, correlated with HS).
HOSTILE AND BENEVOLENT SEXISM 7 6 9
Table 3
HS (Hostile Sexism) and BS (Benevolent Sexism) Predict the Valence
of Stereotypes About Women
All Men Women
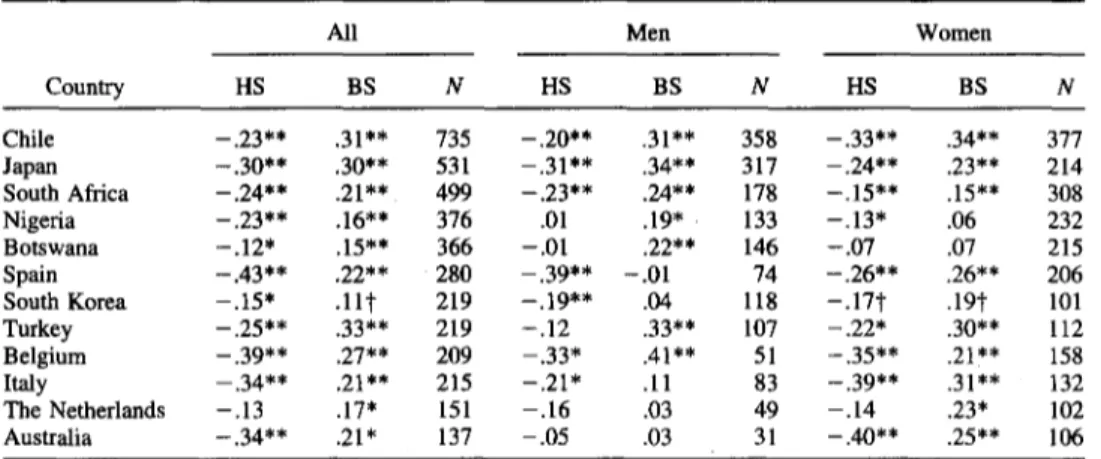
Country HS BS N HS BS N HS BS N Chile -.23** .31"* 735 -.20** .31"* 358 -.33** .34** 377
Japan
--.30** .30** 531 --.31"* .34** 317 --.24** .23** 214 South Africa -.24** .21"* 499 -.23** .24** 178 -.15"* .15"* 308 Nigeria -.23** .16"* 376 .01 .19" 133 - . 1 3 " .06 232 Botswana - . 1 2 " .15"* 366 -.01 .22** 146 - . 0 7 .07 215 Spain -.43"* .22** 280 -.39"* -.01 74 -.26"* .26** 206 South Korea - . 1 5 " .1H" 219 -.19"* .04 118 -.17~" .19t 101 Turkey -.25** .33** 219 - . 1 2 .33** 107 -.22* .30** 112 Belgium -.39** .27** 209 -.33* .41"* 51 -.35** .21~'* 158 Italy -.34** .21"* 215 - . 2 1 " .11 83 -.39** .31"* 132 The Netherlands -.13 .17" 151 - . 1 6 .03 49 - . 1 4 .23* 102 Australia -.34** .21" 137 -.05 .03 31 -.40** .25** 106Note.
All correlations are partial correlations, controlling for the (typically positive) relationship between the HS and BS subscales.* p < .05. **p < .01. t p < .10, marginally significant.
generate up to 10 traits they associate with w o m e n and then rate each trait on a 7-point Likert-type scale ranging from - 3
(ex-
tremely negative)
to 3(extremely positive).
Often, this task was given only to a subset of respondents, so sample sizes are smaller for these analyses. For each respondent, the positive-negative ratings (of the Waits that the respondent associated with women) were aver- aged. Examples of traits generated include tender, warm, sweet, and sensitive (all positively valenced) and jealous, sly, touchy, and selfish (all negatively valenced). W e expected that once the positive intelre- lationslfip was partialed out, HS would predict negative and BS would predict positive trait ascriptions to women.Table 3 shows the partial correlations (each ASI subscale par- tialed from the other) of HS and BS to the average trait ratings. W h e n male and female respondents were pooled together, the pattern of correlations was completely as we expected: HS corre- lated negatively and BS positively with trait ratings, with 22 of 24 correlations reaching statistical significance. Analyzing male and female respondents separately revealed less consistent results; although all significant correlations were in the predicted direction, only about two thirds of the correlations were statistically signif- icant. These less consistent results may be the consequence of smaller sample sizes. The higher proportion of significant corre- lations for female participants may also be a function of sample size. In the two countries in which both the HS and the BS correlations were nonsignificant for men, the sample size was fewer than 50 male respondents, whereas sample sizes for w o m e n were two to three times larger. The majority of the correlations support the predictive validity of the HS and BS scales; when correlations were significant, HS predicted subjectively negative and BS subjectively positive stereotypes about women. 4
Mean HS and BS Scores
Because the samples presented here (with the exception of the Netherlands) cannot be considered representative of the countries in which they were collected, due caution must be exercised when making cross-national comparisons of mean HS and BS scores. In
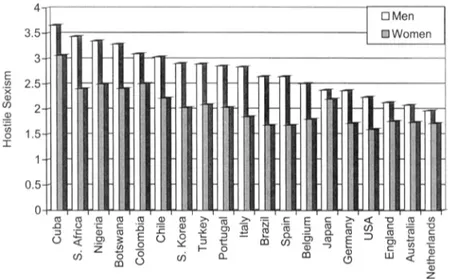
addition, variations in interpretations of items because of cultural differences (even between English-speaking countries) and the inev- itable slippage in translations no doubt make fine-grained analyses of mean differences a dubious enterprise. 5 Mean comparisons between men and women within each country, however, do not suffer from the problems just delineated. 6 In U.S. samples, men typically scored higher than women on HS, but the gender gap (though still signifi- cant) was mitigated for BS scores, presumably because HS punishes women, whereas BS potentially rewards them with protection, ideal- ization, and affection. Means for each national sample on HS and BS ale presented in Figures 1 and 2, respectively.
In all countries, men scored significantly higher than w o m e n did on HS. In the vast majority of countries, however, the gender
4 We also examined, separately for women and men, the correlations of each BS subscale with the average trait valence, partialing out HS. The partial correlations with trait valence, averaged across countries, for men and women respectively, were .18 and .17 for Protective Paternalism, .19 and .11 for Complementary Gender Differentiation, and .13 and .11 for Heterosexual Intimacy. There was no particular pattern such that any single subfactor accounted for the correlation of BS to trait valence.
Moreover, a 1 to 7 (rather than the usual 0 to 5) rating scale was used in England. For mean analyses, a formula derived from Aiken (1987) was used to approximate a 0 to 5 scale: - . 5 + 6 (score - .5)/7.
6 There was one exception to the comparability of men and women within each nation. The first sample of women gathered from Spain (n = 216) were third-year psychology students (rather than a community sam- ple, as was the case with the men) who exhibited anomalously low scores on the ASI scales, particularly on HS (M = 1.09, over half a point lower than women in any other nation). Because of their advanced work in psychology (which included a week-long seminar on gender issues in the class in which they filled out the ASI), these students may have been particularly sensitive to the intent of the scale. As a result, a more diverse sample of 223 women (to match the community sample of Spanish men) were given the ASI, and we excluded the advanced female psychology students from all analyses involving mean comparisons or correlations of national means on the ASI scales.
Figure 1. Hostile sexism across countries.
difference in BS scores was significantly less, disappeared, or even reversed itself such that in some countries women scored higher than men on BS. A 2 (gender of participant) × 2 (ASI subscale: HS, BS) analysis of variance (ANOVA) for each sample (with ASI subscale treated as a repeated measures factor) yielded a significant gender of participant main effect in all cases, all Fs > 4.28, p < .05, such that men exhibited higher scores when HS and BS were aver- aged together. In all but three countries (Australia, Japan, and the Netherlands), however, this main effect was qualified by a Gender of Participant X ASI Subscale interaction, all significant Fs > 13.05, p < .01. The nature of the interaction was of two types: (a) a large gender difference in HS scores became a smaller or nonsignificant gender difference in BS scores or (b) the gender difference was reversed for BS, such that women scored higher on BS than men did. The HS gender difference was statistically significant in all samples, all ts > 2.55, p < .01. The BS gender difference, smaller in magnitude, was nonsignificant in nine countries (Belgium, Chile, Colombia, England, Germany, Italy, Japan, Portugal, and Turkey). Furthermore, although in six countries (Australia, Brazil,
the Netherlands, Spain, South Korea, and the United States), men scored significantly higher in BS than did women, all ts > 2.25, p < .05, the Gender of Participant x ASI Scale interactions indicate that in four of the six cases--with Australia and the Netherlands being the exceptions--the BS gender difference was significantly smaller than the HS gender difference. Finally, in Cuba and in the three African nations (Botswana, Nigeria, and South Africa), women's BS scores were actually higher than men's, all ts < - 3 . 0 4 , p < .01. In summary, cross-culturally, women (in comparison with men) rejected HS but often accepted BS, even to the point, in some nations, of endorsing BS signifi- cantly more strongly than men did.
Relationship Between H S and BS Means Across Countries
We had predicted that just as HS and BS typically go together at the level of individual respondents' attitudes, they would tend to go hand in hand at the national level of analysis. National means on HS correlated extremely strongly with mean BS scores, both
HOSTILE AND BENEVOLENT SEXISM 771
among men, r = .89, p < .01, and among women, r = .89, p < .01. Thus, as we expected, in countries where the endorsement of HS was high, endorsement of BS was also high. The strength of these correlations supports the idea that HS and BS act as com- plementary forms of sexism.
If the system-justification hypothesis that subordinates tend to accept ideologies promoted by dominant groups is correct, then m e n ' s level o f sexism ought to predict w o m e n ' s agreement with sexist ideologies. M e n ' s HS scores correlated highly with wom- e n ' s m e a n scores on HS, r = .84,p < .01, and on BS, r = .92,p < .01. Similarly, m e n ' s BS scores were highly correlated with wom- e n ' s average scores both on HS, r = .84, p < .01, and on BS, r = .97, p < .01. In other words, in countries where men were more sexist, w o m e n had a greater tendency to embrace sexist ideologies, both hostile and benevolent.
Although this evidence is correlational, it is consistent with the system-justification hypothesis that members of subordinate groups adopt the system-justifying ideologies of dominant groups. It is important to keep in mind, however, that within each nation women, on average, uniformly endorsed HS to a lesser degree than men did. In contrast, even in those countries where w o m e n re- jected BS more than men did, the BS scores typically showed less of a gender gap, and in four nations there was a reversal, with w o m e n scoring significantly higher than men did.
Explaining Cross-Cultural Variation in the Gender Gap
in HS and BS Means
The strength of the gender gap in HS and BS scores varied across countries. W e had hypothesized that some of this variation would be systematic, in particular that women would be less likely, relative to men, to reject BS in cultures in which men are more highly sexist. In contrast, we hypothesized that as m e n ' s overall level of sexism increased across nations, the more likely it would be for the HS gender gap to increase, because for hostile ideolo- gies, system justification is tempered by w o m e n ' s self- and group interests. W e correlated, across nations, the gender gaps in HS and BS scores ( m e n ' s m e a n minus w o m e n ' s mean), both with m e n ' s m e a n HS scores and with their m e a n BS scores. M e n ' s HS (r =
-.75,
p < .01) and BS (r = - . 6 5 , p < .01) means were negatively correlated with the gender gap in BS (i.e., predicted a smaller or reversed difference between m e n ' s and w o m e n ' s BS scores). In contrast, the gender gap in HS was positively related to m e n ' s average HS (r = .61, p < .01) and BS (r = .41, p < .10) scores (i.e., the more HS and BS were endorsed by men, the more strongly women, relative to men, rejected HS). These opposing relationships fit our hypothesis: The more sexism pervades a culture, the more w o m e n are, relative to men, likely to embrace BS but to reject HS. 7Explaining Cross-Cultural Variation in HS-BS Correlations
W e noticed post hoc that nations in which respondents exhibited low H S - B S correlations tended to be those with higher overall sexism scores. Across nations, m e n ' s HS and BS means correlated - . 6 5 ( p < .01) and - . 4 9 ( p < .05), respectively, with m e n ' s H S - B S correlations; women's HS and BS means correlated - . 3 0 (ns) and - . 5 2 ( p < .05), respectively, with women's H S - B S correlations.
G i v e n that the H S - B S correlation is weaker among respondents in more sexist nations, perhaps it is also weaker among more sexist
individuals. This might explain why men, who tend to score higher on sexism than w o m e n do, often show lower H S - B S correlations. Within each national sample, we performed a median split (sepa- rately for men and women) on HS scores and then computed separate H S - B S correlations for high and low HS scorers (we chose HS arbitrarily; a median split on BS would presumably yield similar results). These new H S - B S correlations were then used for cross-national comparisons. W e performed a 2 (gender of respon- dent) × 2 (level of HS: high vs. low) A N O V A using the H S - B S correlations for each sample as the dependent variable. Because this A N O V A was performed with nations as the unit of analysis, both independent variables were treated as repeated measures (i.e., there were high- and low-HS-scoring men and women in each nation). There was a significant main effect such that across nations, people who scored higher on HS (average r = .07) exhibited weaker H S - B S correlations than did those who scored lower on HS (average r = .26), F(1, 18) = 37.48, p < .01. The interaction term was nonsignificant, F(1, 18) = 1.47.
In summary, at the level of individual respondents, H S - B S correlations decreased as, across nations, m e a n sexism scores increased. A similar p h e n o m e n o n occurred when, within each nation, men and women were divided into low and high scorers on sexism (using HS scores): The more sexist individuals tended to exhibit weaker H S - B S correlations. Thus, the tendency for men, as compared with women, to show weaker H S - B S correlations may occur because they are typically more sexist than women are.
ASI Means as Predictors of Gender Inequality
Sexist ideologies maintain as well as reflect societal gender inequality; therefore, across nations, HS and BS means should be negatively correlated with national indicators of gender equality. Admittedly, our data are imperfect for these cross-cultural com- parisons, given that (a) people in all but one of our samples cannot be presumed to be representative of their country and (b) we have data from only 19 nations (which, given that nation becomes the unit of analysis, means that our N is low). These factors should, however, work against t h e possibility of finding significant cross- cultural correlations between the ASI and gender inequality rather than privilege our hypothesis. 8
7 Women's mean HS and BS scores, which are correlated in the .80 to .90 range with men's HS and BS means, were also strongly related to the gender gap in BS, though not to the gender gap in HS. Women's HS and BS means, respectively, correlated -.79 and -.83 (both ps < .01) to the gender gap in BS, but only .08 (ns) and .39 (p < .10) to the gender gap in HS.
8 Some readers may wonder whether correlations of the ASI scales to the United Nations measures might be an artifact of the types of samples taken in each country. If (a) more diverse (nonstodent) community samples produced higher means and (b) diversity of sample was confounded with tradition- ality of country, the correlations between the ASI scales and United Nations indices might be inflated. This scenario is unlikely, given that type of sample and national sexism scores were not confounded in this manner. The country with the highest proportion of nonstudents was the Nether- lands (highly egalitarian), and about 50% of the sample from another of the most egalitarian nations, Australia, were older adults. Among the countries scoring highest in sexism, the samples from Botswana, Cuba, Colombia, South Africa, and Turkey were exclusively, and the samples from Nigeria and Chile were predominantly (75-80%), composed of university students. About 40% of the respondents in the South Korean sample were working adults, but their means were similar to the students' means.
We correlated men's and women's means on HS and BS with the two United Nations indices of gender equality. It is important to recall that the GEM assesses women's presence in elite, high- status jobs in business (e.g., as managers) and government (e.g., as parliament members), whereas the GDI assesses women's level of development in education, longevity, and standard of living. Be- cause nations with higher human development more generally are likely to have higher GDI scores (simply because the nation as a whole is wealthier), we controlled for national HDI scores when correlating HS and BS to the GDI. The correlations are reported in Table 4. Because men are the dominant group, their scores might be expected to be most predictive of gender inequality. Despite the limitations of our sampling, men's national means on both HS and BS tended to be negatively correlated with the GDI and the GEM. 9 Although the correlation of men's mean BS scores with the GDI and GEM were only marginally significant, the magnitude of these correlations was roughly similar to the significant correlations of men's HS scores to the United Nations statistics. Women's mean HS and BS scores were (marginally significantly) related only to the GEM, not to the GDI. Overall, the results suggest that both HS and BS are predictive of gender inequality.
D i s c u s s i o n
Prejudice is not synonymous with antipathy; the cross-cultural data presented here show that sexism encompasses subjectively benevolent as well as hostile orientations toward women. Although it is premature to claim that HS and BS are human universals, they do seem (as predicted) to be recognizable, coherent ideologies in a variety of nations, as demonstrated by the consistent replication of the complex factor structure of the ASI. The extremely strong (.80 to .90) correlations between mean levels of HS and BS across nations supports the notion that at the societal level of analysis, these are complementary forms of sexism. The H S - B S correla- tions among respondents within countries were more modest but (when significant) always in a positive direction, as well. Despite the positive correlation, BS generally predicted positive and HS
Table 4
Correlations Between ASI Averages and National Indices of Gender Equality
ASI scale GDI GEM
Men's averages HS -.47* -.53* BS -.40? - . 4 3 t Women's averages HS .03 -.38~ BS -.32 -.42#
Note, All correlations with GDI are partial correlations controlling for overall level of human development in each nation. Sample sizes are 19 countries for GDI correlations and 18 countries for GEM correlations (as the GEM is not available for Nigeria). ASI = Ambivalent Sexism Inven- tory (Glick & Fiske, 1996); GDI = Gender-Related Development Index (United Nations Development Programme, 1998); GEM = Gender Em- powerment Measure (United Nations Development Programme, 1998); HS
= hostile sexism; BS = benevolent sexism. *p < .05. t p < .10, marginally significant.
generally predicted negative trait ascriptions when participants indicated the valence of their spontaneous stereotypes of women. Finally, cross-cultural comparisons showed that HS and BS means predicted the degree of gender inequality across nations: As HS and BS means increased, gender equality, as indicated by United Nations indices of women's empowerment (representation in high- powered roles in government and industry) and development (lon- gevity, education, standard of living) decreased (although some correlations were marginally significant and the GDI was related only to men's, not to women's, mean sexism scores).
In general, a high degree of cross-cultural consistency occurred in several domains: the structure of the ASI; the tendency for women, relative to men, to reject HS more so than BS; and the association of BS with more positive and HS with more negative spontaneous stereotypes of women. Furthermore, cross-cultural variations in findings were typically systematic and predictable: The fluctuations in HS and BS means from nation to nation were related to indices of national gender equality, the size of the gender gap in BS and in HS means correlated (the former negatively and the latter positively) with the overall level of sexism across na- tions, and the strength of H S - B S correlations was negatively related to overall sexism levels across countries.
The finding that in more sexist (as compared with less sexist) countries HS and BS scores tended toward greater independence was replicated at the individual level: H S - B S correlations were lower among high-HS than among low-HS scorers. These results suggest an explanation for previous findings that HS and BS tend to be less strongly correlated for men than for w o m e n - - m e n generally have higher sexism scores. Perhaps people who are highly egalitarian are more likely to recognize BS as a form of sexism and reject it along with HS (with fewer of these individuals rejecting HS but accepting BS), creating more low-low scores that inflate the H S - B S correlation. An implication of the weaker H S - B S correlations among more sexist respondents is that many sexist individuals are more purely hostile or benevolent rather than ambivalent toward women (i.e., a sexist individual might endorse one ideology and not the other). However, it is important to keep in mind that at the societal level, HS and BS increased or decreased in tandem.
Across nations, men's mean sexism scores strongly predicted women's mean scores on both HS and BS, providing evidence consistent with the notion that disadvantaged groups adopt the system-justifying beliefs of dominant groups (Jost & Banaji, 1994); as men's sexism increased, so did women's acceptance of sexist ideologies. However, for HS, women's system-justifying tendency had its limits. Women in every country studied were (on average) significantly less accepting of HS than men were. Fur- thermore, across countries, the gender gap between women's and men's HS scores increased along with the level of men's sexism, suggesting an increasing resistance to accepting a hostile environ- ment. In contrast, the gender gap in BS scores showed the opposite relationship to men's mean sexism scores: The more sexist the
9 Although past practice has been to use partial correlations to control for the positive HS-BS relationship when using the scales as predictors, the overwhelming correlation between HS and BS means when nations are the unit of analysis (in the .80 to .90 range) makes it impossible to pull the scales apart statistically.
HOSTILE AND BENEVOLENT SEXISM 773
nation, the more women, relative to men, accepted BS, even to the point, in the four nations with the highest mean sexism scores (Botswana, Cuba, Nigeria, South Africa), of endorsing BS signif- icantly more than men did. In general, relative to men, women were more accepting of BS than of HS, suggesting that members of subordinate groups fmd ostensibly benevolent prejudice more acceptable than hostile prejudice toward their group.
The evidence is consistent with the idea that women adopt BS as a form of self-defense when overall levels of sexism in a culture are high. HS and BS work together as a particularly effective method of system maintenance: When men are high in HS, women have a strong incentive to accept BS to gain m e n ' s protection, admiration, and affection and as a means of avoiding m e n ' s hostility. Faced with hostility from a more powerful group if they choose to reject conventional female roles and rewarded with men's benevolence for conforming to those roles, it is not surpris- ing that many women choose to adopt prescribed roles and the ideology (BS) that supports them (see also Eagly, 1987; Jackman, 1994; Ridgeway, 1992). This is similar to arguments made by Smuts (1996) and Jackman (1994) that the threat of male aggres- sion leads women to seek protection by pair bonding with men. Such effects are ironic, as women are driven to seek protection from members of the very group that threatens or oppresses them, and the greater the threat (i.e., the more men endorse HS), the stronger the incentive to seek male protection (rather than independence).
Is women's relative willingness to accept BS a problem? Al- though men's mean BS scores were only marginally significantly related to the United Nations gender inequality measures, the findings were consistent across both indices of gender inequality. Furthermore, the extremely strong (.80 to .90) relationships be- tween HS and BS means (both for men and for women) across countries are striking: In this set of nations, higher BS scores were a constant companion to high HS means. That HS and BS go so strongly together is consistent with the notion that BS legitimates HS by allowing sexist men to see themselves not as hostile dominators of women but as their protectors, admirers, and inti- mates. Furthermore, BS may also be effective in undermining or preventing attempts by women to achieve equality by rewarding them for enacting conventional gender roles and by deflating the resentment they feel about men's greater power (as one is less likely to resent another's power if that power is used to protect oneself). This may explain why women's endorsement of sexist ideologies was related only to the GEM, which measures women's presence in elite occupations and roles, and not to the GDI, which measures women' s overall standard of living. In societies in which women accept sexist attitudes, many women may still be able to achieve a decent standard of living through m e n ' s provision but may be less likely to pursue male-dominated elite occupations and roles. In short, BS and HS appear together because they are the ideological expression of a complementary system of rewards and punishments that elicit women's cooperation in their own subor- dination (cf. Jackman, 1994).
BS may continue to have an important role in maintaining sexism even in increasingly egalitarian societies. Whereas HS becomes a lightning rod for criticism and eliminating HS is the goal of those aiming for social improvement, the more subtle, seemingly favorable views of women related to BS are less likely to be questioned. Virginia Woolf (1981) realized that true gender
equality will only happen when "womanhood has ceased to be a protected occupation" (p. 40), but many women, as well as men, may remain resistant to such a change. Fortunately, our data suggest that reducing men's HS may free women to reject BS as well as HS.
The cross-cultural comparisons we present are limited. Clearly, future research that replicates these findings with more represen- tative samples from a wider array of nations is desirable. Never- theless, our preliminary evidence offers substantial support for the cross-cultural prevalence of HS and BS. Furthermore, the strong relationships of BS to HS (with national means correlated in the .80 to .90 range across countries) and to women's subordination (as measured by objective indicators of gender equality) suggest that it is time to rethink the equation of prejudice with antipathy. BS is not simply patronizing but may be just as important as HS in justifying and maintaining gender inequality. Untempered by pa- ternalistic benevolence, hostility toward women would likely arouse only resistance and recalcitrance from a group on whom men are dependent in their most intimate relationships; BS disarms this resistance. The idealization of women who fulf'fll male-defined roles and needs is a crucial complement to the demonization of those who defy male power and authority, creating a particularly effective system of social control whose grip women in many societies are still struggling to break.
R e f e r e n c e s
Aiken, L. R. (1987). Formulas for equating ratings on different scales.
Educational and Psychological Measurement, 47, 51-54.
Allport, G. W. (1954). The nature of prejudice. Reading, MA: Addison- Wesley.
Bollen, K. A. (1989). Structural equations with latent variables. New York: Wiley.
Cronbach, L., & Meehl, P. E. (1955). Construct validity in psychological tests. Psychological Bulletin, 52, 281-302.
Eagly, A. H. (1987). Sex differences in social behavior: A social-role
interpretation. Hillsdale, NJ: Ertbaum.
Eagly, A. H., & Mladinic, A. (1994). Are people prejudiced against women? Some ar~swers from research on attitudes, gender stereotypes and judgments of competence. In W. Stroebe & M. Hewstone (Eds.),
European review of social psychology (Vol. 5, pp. 1-35). New York: Wiley.
Eagly, A. H., & Wood, W. (1999). The origins of sex differences in human behavior: Evolved dispositions versus social roles. American Psycholo-
gist, 54, 408-423.
Eckes, T., & Six-Matema, I. (1999). Hostili~t und Benevolenz: Eine Skala zur Erfassung des Ambivalenten Sexismus [Hostility and benevolence: A measure of ambivalent sexism]. Zeitschriftfiir Sozialpsychologie, 30, 211-228.
Exp6sito, F., Moya, M., & Glick, P. (1998). Sexismo ambivalente: Medi- ci6n y correlatos [Ambivalent sexism: Measurement and correlates].
Revista de Psicologfa Social, 13, 159-169.
Fiske, S. T. (1998). Prejudice, stereotyping, and discrimination. In D. T. Gilbert, S. T. Fiske, & G. Lindzey (Eds.), The handbook of social
psychology (4th ed., pp. 357-411). New York: McGraw-HiU. Fiske, S. T., Xu, J., Cuddy, A. J. C., & Glick, P. (1999). Respect versus
liking: Status and interdependence underlie ambivalent stereotypes.
Journal of Social Issues, 55, 473-489.
Glick, P., Diebold, J., Bailey-Werner, B., & Zhu, L. (1997). The two faces of Adam: Ambivalent sexism and polarized attitudes toward women.