ORIGINAL PAPER
Assessment of changes in soil organic matter after invasion
by exotic plant species
Lydie-Stella Koutika&Sonia Vanderhoeven&
Lydie Chapuis-Lardy&Nicolas Dassonville&
Pierre Meerts
Received: 15 January 2007 / Revised: 2 May 2007 / Accepted: 2 May 2007 / Published online: 30 May 2007 # Springer-Verlag 2007
Abstract Invasive exotic plants can modify soil organic matter (SOM) dynamics and other soil properties. We eval-uated changes in particulate organic matter (POM) and car-bon (C) mineralisation in adjacent plots invaded by Solidago gigantea, Prunus serotina, Heracleum mantegazzianum and Fallopia japonica, and non-invaded control plots on dif-ferent soils in Belgium. Litter decomposition of S. gigantea and P. serotina was compared to that of the native species Epilobium hirsutum, Betula pendula and Fagus sylvatica. Disregarding the differences in site characteristics (soil texture, parental material and plant species), we argued that the invasion by S. gigantea and P. serotina enhance SOM dynamics by increasing C mineralisation in 2 out of 3 sites invaded by S. gigantea and in 1 out of 3 sites invaded by P. serotina; C in coarse POM (cPOM, 4,000–250 μm) and fine POM (fPOM, 250–50 μm) in 1 site invaded by S. gigantea and C content in total POM (tPOM, 4,000–50 μm) and the organo-mineral fraction (OMF, 0–50 μm) in 1 site invaded by P. serotina. H. mantegazzianum and F. japonica slowed down SOM dynamics by reducing C mineralisation in three out of four sites; C and nitrogen (N) of fPOM in the invaded compared with the non-invaded plots at one site invaded by H. mantegazzianum. However, N content of cPOM (4,000–
250 μm) was higher in the invaded sites by F. japonica compared with the non-invaded plots. Our results indicated that the effects of invasion by exotic plant species were not species-specific but site-specific.
Keywords Biological invasion . Soil C mineralisation . Exotic invasive plants . Litter decomposition . Native plants . Particulate organic matter
Introduction
Invasions by exotic plant species are amongst the most important threats to natural ecosystems. Over the last few decades, several exotic invasive plant species have become established and spread in different areas and ecosystems in Belgium and surrounding countries (Verloove 2002; Saintenoy-Simon 2003). Amongst them, Solidago gigantea (Asteraceae) originating from North America, spreading on waste lands and abandoned arable lands; Prunus serotina (Amygdalaceae) commonly found in forests on acid sandy soils; Heracleum manteggazzianum (giant hogweed) (Apia-ceae) originating from the Caucasus and Fallopia japonica (Japanese knotweed) (Polygonaceae) originating from Asia, colonising a wide range of disturbed sites.
Alien plant invasions may affect soil organic matter (SOM) dynamics (Knicker et al. 2000). Particulate organic matter (POM) and specific respiration are considered as early indicators when evaluating SOM changes in natural or managed ecosystems (Cambardella and Elliot1992; Sikora et al. 1996). POM status may be determined by physico-chemical (Vanlauwe et al. 1999; Koutika et al. 2001a) or physical procedures (Koutika et al. 2001b), the latter was preferred in the current study for practical reasons. POM became an increasingly popular parameter of labile SOM DOI 10.1007/s00374-007-0210-1
S. Vanderhoeven
:
N. Dassonville:
P. MeertsLaboratory of Plants and Ecology, Université Libre de Bruxelles, 1160 Brussels, Belgium L.-S. Koutika (*) B.P. 4895, Pointe-Noire, Congo e-mail: ls_koutika@yahoo.com L. Chapuis-Lardy
Institut de Recherche pour le Développement (IRD), B.P. 64501,
because it responds readily to soil management (Wander 2004) and the relationship between its fractions and crop have been identified (Koutika et al. 2002). Carbon (C) mineralisation is an appropriate method to evaluate C bio-degradability and SOM status in natural or managed eco-systems. Koutika et al. (1999) used mineralised C of whole soils and its fractions to assess SOM under pasture and forest soils. Litter decomposition rates also serve to determine and compare the litter quality of different plant or tree species in managed or natural ecosystems (Gallardo and Merino1993; Giardina et al. 2001). The decomposition rates of litter are determined by differences in the quality of residues, such as carbon/nitrogen (C/N) ratio or lignin content (Ehrenfeld2003). Litter of many exotic plants was often found to decompose faster than litter of native plants; however, the contrary may also be due to the presence of secondary plant substances in high concentrations (Levine et al.2003; Ehrenfeld2003).
Our objective was to evaluate changes in SOM dynamics as a result of invasion by exotic plant species, by comparing POM content and C respiration under soil patches invaded by the four selected exotic invasive plants and the surround-ing native vegetation. We hypothesised that invasive exotic plants have effects on belowground processes such as SOM dynamics, but that the magnitude of the effects depends on site characteristics and plant species. Therefore, we tested the following hypotheses: (1) litter decomposition rate of S. gigantea and P. serotina differs from that of the dominant native plant species, i.e. Epilobium hirsutum, Betula pendula and Fagus sylvatica, and also differs between the invaded compared with the non-invaded soils and (2) POM and soil C respiration differs between soils invaded and non-invaded by the four selected exotic plant species.
Materials and methods
Site location, vegetation cover and soil sampling
Three locations for S. gigantea (SG1, SG2, SG3) and for P. serotina (PS1, PS2, PS3) and two locations for H. mantegazzianum (HM1, HM2) and for F. japonica (FJ1, FJ2), were selected in the central part of Belgium (Tables1 and 2). As described by Chapuis-Lardy et al. (2006), the study locations were selected based on three main criteria: (1) a well-established and still increasing population of the invasive target species clearly distinct from the surrounding vegetation; (2) adjacent areas of non-invaded vegetation (herbaceous native species) located a few metres apart; (3) a relatively homogenous soil cover in the whole area based on no apparent topsoil difference investigated by a soil auger between invaded and non-invaded sites. At each location, six 1 m2 plots in invaded and adjacent non-invaded sites were chosen. At the end of autumn 2003, soil samples were
taken with a soil core sampler (4 cm diameter, 0–10 cm depth) in each plot. Each soil sample was a composite of 10 independent cores within each 1 m2 plot area. Soils were air-dried, ground and passed through a 4-mm sieve for POM fractionation and a 2-mm sieve for other analyses. Standard soil analyses
Particle size distribution was determined using the pipette method after H2O2pre-treatment and Na-citrate dispersion.
Soil pH was determined in water and 1 M KCl (pHH2Oand
pHKCl, respectively) using a 1:5 soil:solution ratio. Total
soil C was determined by volumetric method (Ströhlein, pol François, Chatêlet, Belgique) (Nelson and Sommers1982). Total nitrogen (N) content was determined using the Kjeldahl method (Büchi 435 Digestion Unit and Büchi 315 Distillation Unit) and titration (TIM 900 Titration Manger and ABU 901 Autoburette Radiometer, Copenhagen) (Bremner and Mulvaney1982).
Litter decomposition
The nylon mesh bag technique was used to monitor litter decomposition at SG1, PS1 and PS2. Nylon bags (14.5× 14.5 cm) with 1 mm mesh were used for S. gigantea site because the 1-mm mesh would be small enough to prevent major losses of the smallest leaves, yet large enough to permit aerobic microbial activity and free entry of small soil animals (Gallardo and Merino 1993). For P. serotina sites, because the leaves were larger, the bag was built with 2 types of nylon mesh: the lower part of the bag in contact with the soil surface had a mesh size of 1 mm, whilst the upper part consisted of 7-mm mesh size material to allow the entry of larger soil animals. Mean C, N, C/N ratio, lignin and lignocellulose values of S. gigantea were 39.4%, 1.36%, 29.0, 10.7%, and 19.7%, respectively, whilst those of E. hirsutum were 37.7%, 1.30%, 29.1%, 13.3% and 27.6%, respectively (Vanderhoeven et al. unpublished data 2007). Mean C, N, C/N ratio, lignin and lignocellulose values of P. serotina at PS1 were 40.1%, 1.03%, 38.9%, 14.4% and 26.0%, respectively, and those of P. serotina at PS2 were 36.8%, 1.59%, 23.1, 8.7% and 27.5%, whilst those of B. pendula were 39.4%, 1.36%, 29.0, 19.5% and 29.7%, respectively, and those of F. sylvatica were 39.7%, 1.48%, 26.8, 14.7% and 39.8%, respectively (Vanderhoeven et al. unpublished data 2007).
Litterbags were filled with one of the three following materials: (1) cellulose paper as a standard; (2) litter of the invasive species (S. gigantea [SG1] and P. serotina [ PS1 and PS2]); (3) litter of one representative species selected from the non-invaded site (E. hirsutum [SG1]; B. pendula [PS1] and F. sylvatica [PS2]). The fresh litter material was collected at the end of October 2003 and dried at 60°C for
48 h before being placed in the bags (2.5 g for SG1 and 5 g for PS1 and PS2). Three sets of 3 litterbags were placed in situ at 3 randomly selected points in the invaded and non-invaded sites; 1 set being harvested at each point 3, 6 and 9 months after placement (i.e. 9 replicates per material type and per date of harvest). Litterbags were carefully placed on the ground and under the surface litter to allow contact with the topsoil layer. At each sampling, the surface litter covering litterbags was carefully removed and litterbags
lifted off the ground. The remaining litter material in bags was then dried at 60°C for 48 h and weighted.
SOM analysis
SOM was fractionated into POM according to the method elaborated by Cambardella and Elliot (1992) with modifica-tions by Vanlauwe et al. (1999) and Koutika et al. (2001a). Ten grams of air-dried soil (sieved <4 mm) and 50 ml of Table 2 Site localisation and characterisation (H. mantegazzianum and F. japonica)
Place Code Situation Non-invaded/invaded Plant cover
Ganshoren HM1 Waste land on alluvium
bottom valley
Non-invaded Urtica dioica (50–70%), Petasites hybridus, Cirsium arvense, Cirsium oleraceum
Ganshoren HM1 Waste land on alluvium
bottom valley
Invaded H. mantegazzianum (75–85%),
Urtica dioica (5–20%)
Watermael-Boitsfort HM2 Willow on bottom valley Non-invaded Glechoma hederacea, Circaea lutetiana Watermael-Boitsfort HM2 Willow on bottom valley Invaded H. mantegazzianum (60–80%)
Watermael-Boitsfort FJ1 Forest pond bank Non-invaded Petasites hybridus (>75%), Glechoma hederacea, Carex hirta
Watermael-Boitsfort FJ1 Forest pond bank Invaded F. japonica (>75%)
Saint-Ghislain FJ2 Rough grassland in nature conservation
Non-invaded Eupatorium cannabinum, Achillea millefolium, Festuca rubra, Calamagrostis epigejos, Carex hirta Saint-Ghislain FJ2 Rough grassland in
nature conservation
Invaded F. japonica (>85%)
Table 1 Site location and characterisation (S. gigantea and P. serotina)
Place Site Situation Non-invaded/
invaded
Main plant cover
Kraainem SG1 Rough mesotrophic
grassland
Non-invaded Epilobium hirsutum, Cirsium arvense, Leucanthemum vulgare, Festuca rubra, Holcus lanatus, Pulicaria dysenteretica, Agrostis stolonifera, Achillea millefolium
Kraainem SG1 Rough mesotrophic
grassland
Invaded S. gigantea (80–95%), Cirsium arvense, Juncus effusus Woluwé
–Saint-Lambert (Gulledelle)
SG2 Waste ground in urban area
Non-invaded Heracleum sphondylium, Arrhennatherum elatius, Rubus sp., Dactylis glomerata, Festuca rubra, Pastinaca sativa, Carex hirta, Agrostis stolonifera
Woluwé–Saint-Lambert (Gulledelle)
SG2 Waste ground in urban area
Invaded S. gigantea (>95%) Saint-Ghislain SG3 Rough grassland on
waste ground
Non-invaded Calamagrostis epigejos, Epilobium angustifolium, Phragmites australis, Rubus sp., Potentilla reptans, Cirsium arvense
Saint-Ghislain SG3 Rough grassland on waste ground
Invaded S. gigantea (80–90%), Phragmites australis,
Cirsium arvense, Carex hirta, Epilobium angustifolium Uccle (Kauwberg) PS1 Grassland Non-invaded Agrostis sp., Holcus lanatus, Dactylis glomerata,
Achillea millefolium
Uccle (Kauwberg) PS1 Grassland Invaded P. serotina, Arrhenatherum elatius, Agrostis sp., Ranunculus repens, Achillea millefolium Louvain-la-Neuve PS2–
PS3
Mixed forest on acidic soil
Non-invaded Fagus sylvatica, Betula pendula, Quercus robur Louvain-la-Neuve PS2 Mixed forest on acidic
soil
Invaded P. serotina, Betula pendula, Pinus sylvestris Louvain-la-Neuve PS3 Pinus sylvestris forest
on acidic soil
distilled water were shaken for 16 h in an end-over-end shaker at 40 rpm. The suspension was wet-sieved to separate the 4,000–250 μm, 250–50 μm and 0–50 μm fractions. In the two larger fractions, the organic components were separated from the mineral fraction by decantation. The following fractions were collected: coarse POM (cPOM, 4,000–250 μm) and fine POM (fPOM, 250–50 μm, mineral fraction (MF, 4,000–50 μm) and organo-mineral fraction (OMF, <50 μm). All fractions were dried at 45°C and weighted. At one site for each species, C and N concen-trations were determined in cPOM, fPOM and the OMF using an elemental Autoanalyser (Carlo Erba CN 1600).
C mineralisation
Ten grams of soil (sieved <2 mm), pre-incubated for 1 week at 28°C and moistened with 2 ml of distilled water were placed in a 150-ml plastic bottle with plastic dishes containing 10 ml 0.1 M of NaOH placed inside the plastic bottles (to capture CO2). The bottles were incubated at
28°C. After 1, 2, 4 and 6 weeks, the incubated soil was destructively sampled and the residual NaOH was deter-mined by titration with 0.1 M H2SO4 on the Radiometer
TIM 900 Titration Manager pH metre using a ABU 901 Autoburette Radiometer (Copenhagen, Denmark).
Table 3 Soil texture and pH in non-invaded (native plant species) and invaded (S. gigantea) situations
Sites and situations Sand (%) Silt (%) Clay (%) pHH2O pHKCl ΔpH
SG1 Non-invaded mean±SD 45.2±1.71 52.3±1.41 2.5±0.45 6.76±0.16 6.07±0.21 0.69±0.22 Invaded mean±SD 43.0±2.23 54.6±2.11 2.4±1.24 6.25±0.21 5.30±0.27 0.95±0.11 t-value 1.91 −2.17 0.09 4.55* 5.46* −2.59** SG2 Non-invaded mean±SD 47.4±24.5 39.7±22.1 12.9±3.16 6.52±1.09 5.79±1.30 0.73±0.30 Invaded mean±SD 28.4±14.48 57.9±12.83 13.7±2.48 7.49±0.39 7.10±0.35 0.38±0.23 t-value 1.62 −1.73 −0.49 −2.02 −2.38** 2.12 SG3 Non-invaded mean±SD 44.0±14.90 38.9±10.70 17.0±7.78 7.61±0.22 7.20±0.17 0.41±0.12 Invaded mean±SD 46.2±7.67 39.7±10.70 14.1±4.91 7.57±0.14 7.14±0.12 0.43±0.07 t-value −0.31 −0.12 0.76 0.43 0.66 −0.19 ΔpH=pHH2O−pHKCl *P<0.001 (P level in t-tests) **P<0.05 (P level in t-tests)
Table 4 Soil texture and pH in the non-invaded (native plant species) and invaded (P. serotina) situations
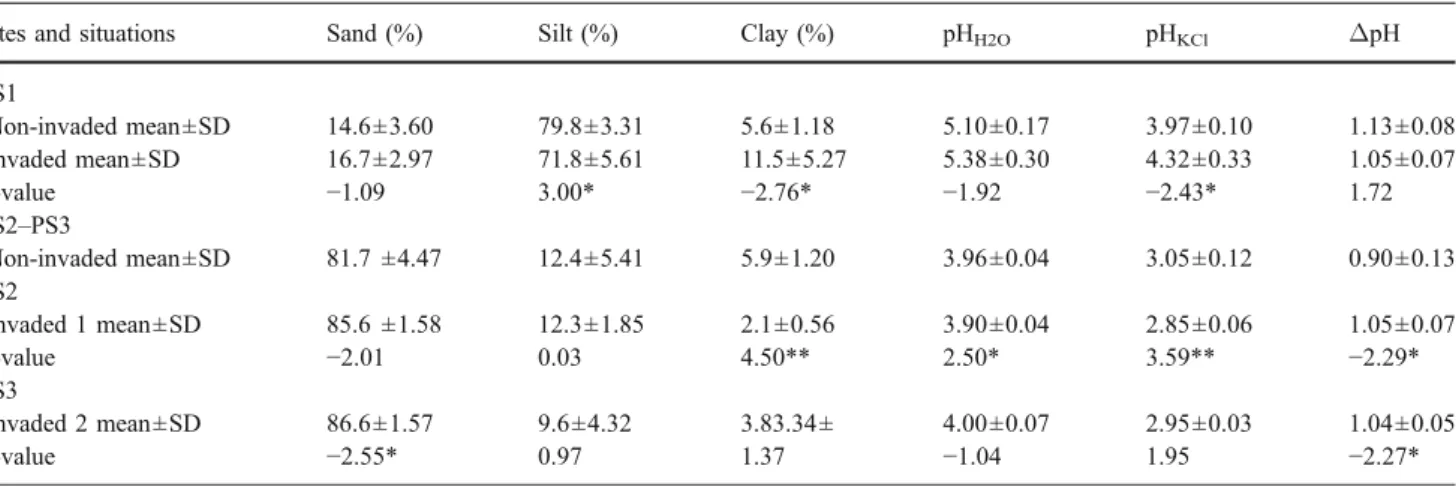
Sites and situations Sand (%) Silt (%) Clay (%) pHH2O pHKCl ΔpH
PS1 Non-invaded mean±SD 14.6±3.60 79.8±3.31 5.6±1.18 5.10±0.17 3.97±0.10 1.13±0.08 Invaded mean±SD 16.7±2.97 71.8±5.61 11.5±5.27 5.38±0.30 4.32±0.33 1.05±0.07 t-value −1.09 3.00* −2.76* −1.92 −2.43* 1.72 PS2–PS3 Non-invaded mean±SD 81.7 ±4.47 12.4±5.41 5.9±1.20 3.96±0.04 3.05±0.12 0.90±0.13 PS2 Invaded 1 mean±SD 85.6 ±1.58 12.3±1.85 2.1±0.56 3.90±0.04 2.85±0.06 1.05±0.07 t-value −2.01 0.03 4.50** 2.50* 3.59** −2.29* PS3 Invaded 2 mean±SD 86.6±1.57 9.6±4.32 3.83.34± 4.00±0.07 2.95±0.03 1.04±0.05 t-value −2.55* 0.97 1.37 −1.04 1.95 −2.27* ΔpH=pHH2O−pHKCl
Invaded 1: heterogeneous forest, invaded 2: Pinus forest *P<0.05 (P level in t-tests)
Statistical analyses
Litter decomposition data were analysed by comparing litterbags in non-invaded and invaded sites (t-test with 9 replicates for each date). At each date, soil sample data of non-invaded sites were compared to those of invaded sites (t-test with 6 replicates). All data were analysed using the STATISTICA Software package (StatSoft Inc.2003).
Results
Soil physicochemical properties
Soil texture was not different between invaded and non-invaded sites at SG1, SG2 and SG3 (Table3). However, at SG1, the soil contained less clay than at SG2 and SG3. At SG1, soil pHH2O and pHKCl were lower in invaded sites.
The contrary was found at SG2, whilst no differences were found at SG3 (Table3).ΔpH was higher in invaded sites. There was no difference in sand content at PS1 and PS3 (Table 4). However, the sand content was higher in the invaded sites at PS3. Clay content was higher in the invaded site at PS1, whilst the contrary was found at PS2 and PS3. Soil pHKClwas slightly higher in invaded sites at
PS1. Soil pHH2Owas higher in the non-invaded site.
Soil texture was different between non-invaded and invaded sites at HM1 (Table 5). However, there were no differences in soil pH at that site. No difference in soil texture was found at HM2 but pHH2Owas higher in invaded
sites andΔpH values were not significantly different in the
invaded plots compared to the non-invaded plots, whilst at HM2, pHH2O and ΔpH were higher in the invaded sites
(Table 5).
Soil texture was not different between non-invaded and invaded sites at FJ1 and FJ2 (Table 5). Soil pHH2O was
lower in invaded than non-invaded sites at FJ1 (Table5). Percentage of remaining material in litterbags
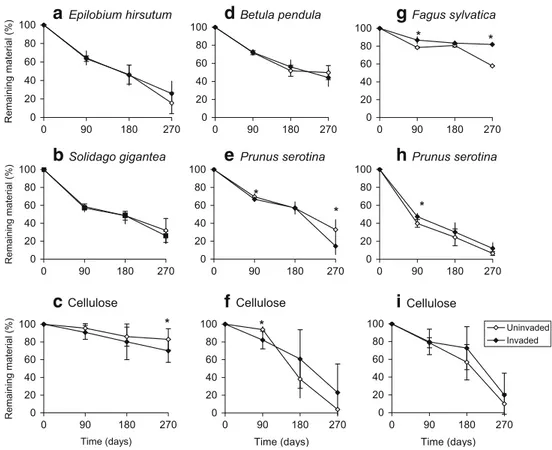
At the SG1 site, the percentage of remaining material (PRM) of cellulose was significantly lower (P=0.057) in the invaded sites after 270 days of installation in situ (Fig.1c). At PS1, the PRM of P. serotina was significantly lower (P=0.042 and P=0.002) in the invaded sites at 90 and 270 days, respectively (Fig. 1e). At 90 days, the PRM of cellulose was also significantly lower (P=0.006) in invaded sites (Fig.1f). At PS2, the PRM of F. sylvatica was significantly higher (P<0.001) at 90 and 270 days in the invaded (Fig. 1g) than in the non-invaded sites. After 90 days in situ, the PRM of P. serotina was significantly higher (P=0.001) in the invaded sites, but the difference was no more significant afterwards (Fig.1h).
C mineralisation in vitro
At SG1, the soil C mineralisation rate was significantly higher (P=0.005, P=0.017, P=0.002 and P=0.05) in the invaded than in the non-invaded site after 1, 2, 4, and 6 weeks of incubation, respectively (Fig. 2a). At SG2, cumulated mineralised C was significantly higher (P=0.013 and P=0.018) in invaded sites only after 1 and 2 weeks Table 5 Soil texture and pH in non-invaded (native plant species) and invaded (H. mantegazzianum and F. japonica) situations
Sites and situations Sand (%) Silt (%) Clay (%) pHH2O pHKCl ΔpH
HM1 Non-invaded mean±SD 8.8±2.05 64.3±6.81 26.9±7.61 7.8±0.15 7.2±0.04 0.59±0.13 Invaded mean±SD 30.7±12.24 51.9±7.98 17.4±4.76 7.9±0.30 7.4±0.23 0.55±0.08 t-value −4.28** 2.88* 2.61* 0.71 −1.38 0.55 HM2 Non-invaded mean±SD 9.3±2.56 73.6±5.85 17.1±6.11 7.4±0.18 7.0±0.13 0.38±0.09 Invaded mean±SD 13.4±5.92 66.3±5.98 20.3±2.40 7.7±0.12 7.1±0.04 0.60±0.08 t-value −1.55 2.12 −1.18 −3.37* −1.47 −4.12* FJ1 Non-invaded mean±SD 49.7±14.40 32.6±10.37 17.7±6.15 7.8±0.07 7.3±0.07 0.48±0.07 Invaded mean±SD 50.1±16.61 35.3±11.91 14.6±4.89 7.4±0.44 7.0±0.47 0.40±0.08 t-value −0.04 −0.42 0.98 2.20* 1.69 1.70 FJ2 Non-invaded mean±SD 42.3±4.05 36.6±2.62 21.1±2.52 8.0±0.14 7.4±0.04 0.63±0.11 Invaded mean±SD 47.5±4.59 32.8±4.71 19.7±4.70 7.9±0.12 7.4±0.03 0.57±0.11 t-value −2.06 1.74 0.61 0.83 0.21 0.91 *P<0.01 (P level in t-tests) **P<0.05 (P level in t-tests)
(Fig. 2b). At PS1, soil C mineralisation was significantly higher (P=0.044, P=0.005 and P=0.044) in the invaded site than in the non-invaded site after 1, 2 and 4 weeks of incubation, respectively (Fig.2d).
At HM1 and HM2, soil C respiration was lower in the invaded sites compared with the non-invaded sites after 1 and 2 weeks of incubation (Fig. 3a and b); there was no difference anymore in cumulative mineralised C afterwards. Soil C respiration was lower in invaded sites after 1, 2 and 4 weeks of incubation at FJ2 (Fig. 3d); no difference was found after 6 weeks of incubation.
Weight, C and N in cPOM, fPOM and OMF fractions Weight of the different POM fractions and the organo-mineral fraction were determined in all soil samples of the 10 selected sites. However, C and N concentrations were only determined in one site for each exotic plant species, i.e. SG1 for S. gigantea; PS1 for P. serotina; HM2 for H. mantegazzianum and FJ2 for F. japonica.
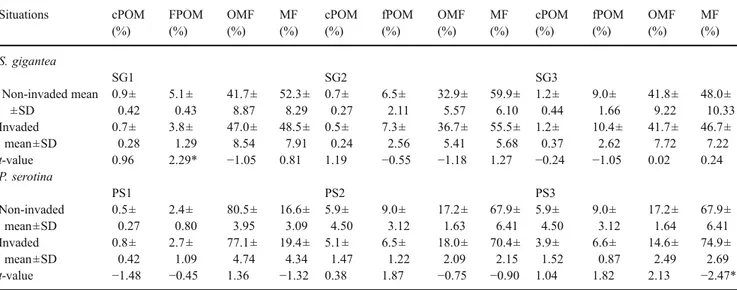
At SG1, the weight (%) of fPOM was significantly lower (P<0.004) in invaded than in non-invaded sites (Table6). C contents in cPOM and fPOM were significantly higher (P= 0.051 and P=0.047) in invaded than in non-invaded sites, respectively (Table7). At PS1, total soil C was significantly higher (P=0.006) in invaded than in non-invaded sites (Table7) and the C/N ratio of the cPOM was significantly
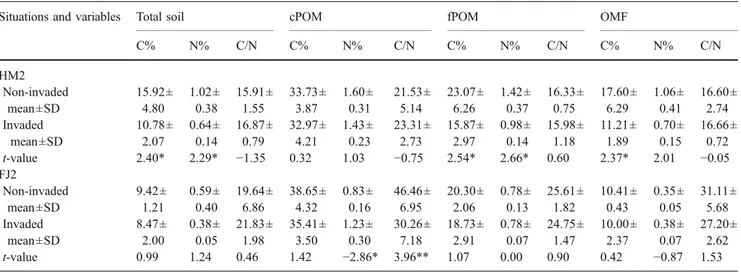
lower (P=0.012) in invaded than in non-invaded sites. C and N concentrations in OMF were significantly higher (P= 0.039 and P= 0.017, respectively) in soil collected in invaded sites, whilst the C/N ratio was not affected (Table7). At HM1, the weight (%) of fPOM and OMF were lower in invaded than in non-invaded sites (Table8). The MF, on the contrary, was higher in invaded than in non-invaded sites, probably due to the difference in soil texture (see Table 5). At HM2, the weight (%) of cPOM and fPOM were lower in invaded sites, whilst the contrary was found for the OMF (Table 8). At HM2, total soil C and N concentrations were lower in invaded than in non-invaded sites (Table9). C and N concentrations in fPOM were lower in invaded than in non-invaded sites. Similarly, C concen-tration in OMF was lower in invaded than in non-invaded sites (Table9). At FJ1, the weight (%) of cPOM was lower in invaded than in non-invaded sites (Table 8). At FJ2, N concentration in cPOM was higher in invaded compared with non-invaded sites (Table 9). The C/N ratio of cPOM was lower in invaded plots than in non-invaded sites.
Discussion
In some sites (i.e. SG1, SG2, SG3, HM2, FJ1 and FJ2), differences observed in soil pH, C mineralisation and POM status between non-invaded and invaded sites may be
g
Fagus sylvatica 0 90 180 270 0 20 40 60 80 100 * *h
Prunus serotina 0 20 40 60 80 100 0 90 180 270 * 0 90 180 270 Time (days) 0 20 40 60 80 100 Uninvaded Invaded Remaining mater ial (%)b
Solidago gigantea 0 20 40 60 80 100 0 90 180 270 Remai ni ng materia l ( % )c
Cellulosei
Cellulose 0 20 40 60 80 100 0 90 180 270 Time (days) Remaining material (% ) *a
Epilobium hirsutum 0 20 40 60 80 100 0 90 180 270d
Betula pendula 0 20 40 60 80 100 0 90 180 270e
Prunus serotina 0 90 180 270 0 20 40 60 80 100 * * Cellulosef
0 90 180 270 Time (days) 0 20 40 60 80 100 *Fig. 1 Litter breakdown under the canopy. At SG1: a E. hirsutum, b S. gigantea and c cellulose. At PS2: d B. pendula, e P. serotina and f cellulose. At PS2: g F. sylvatica, h P. serotina and i cellulose. *P<0.05
ascribed to the presence of invasive exotic plant species because the soil texture was similar in invaded and non-invaded sites. The differences found at the four other sites (PS1, PS2, PS3 and HM1) are more problematic to ascribe to the presence of invasive exotic plant species. However, because the sum of the clay and silt fractions of the non-invaded sites was not different from that of the non-invaded sites at PS1, we assume that we could discuss the results of this site and those of HM2 because there was no difference in soil texture between invaded and non-invaded sites. Therefore, disregarding the differences in site character-istics (soil texture, parental material and plant species) and according to our findings, we could argue that the invasion by S. gigantea and P. serotina enhance SOM dynamics, whilst that of H. mantegazzianum and F. japonica slowed it down.
Exotic invasive plant species enhancing SOM dynamics, i.e. S. gigantea and P. serotina
Soil C mineralisation was more intense in two out of three sites invaded by S. gigantea, probably because S. gigantea delivered more litter, which finally increased organic C, as indicated by the increased C in active SOM fractions, cPOM and fPOM. At SG1, an increase of C in cPOM (4,000– 250 μm) and fPOM (250–50 μm) was observed in sites invaded by S. gigantea, probably due to high C contents of S. gigantea compared with the native E. hirsutum (39.4% vs 37.7%, respectively) and the higher aboveground phytomass of invasive patches compared to the native vegetation as shown by Chapuis-Lardy et al. (2006). In addition, because S. gigantea residues contain less lignin and lignocellulose than the native plant species (E. hirsutum), the exotic plant
Solidago gigantea
a
SG1 0 1 2 3 4 5 0 2 4 6 8 0 2 4 6 8 0 2 4 6 8 0 2 4 6 8 0 2 4 6 8 0 2 4 6 8 C-C02 (mg/g of soil)**
*
**
*
Prunus serotina
d
PS1 0 1 2 3 4 5 ** * *e
PS2 0 1 2 3 4 5f
PS3 0 1 2 3 4 5 Time (weeks) Invaded Uninvadedb
SG2 0 1 2 3 4 5 C-C02 (mg/g of soil)*
*
c
SG3 0 1 2 3 4 5 Time (weeks) C-C02 (mg/g of soil) Uninvaded Invaded Fig. 2 C mineralisation (in vitroincubation) of soil under the canopy of exotic plants and of adjacent non-invaded (uninvaded) soil at SG1, SG2 and SG3 (S. gigantea) and at PS1, PS2 and PS3 (P. serotina). *P<0.05;
species might have created the more active and reactive SOM. Thus, the aboveground and belowground inputs of S. gigantea apparently actively fractionate and incorporate into the soil and create the more active and reactive SOM as confirmed by an increase of C in cPOM and fPOM fractions. Ehrenfeld (2003) showed that invasive exotic plant species tend to produce litter that decays more rapidly than that of the co-occurring native species, thus modifying C and N cycling. Knicker et al. (2000) showed Hieracium pilosella-induced variations in SOM composition as a result of different amounts and quality of plant residue inputs. The higher C mineralisation in vitro and high C concentration in cPOM and fPOM fractions at SG1 in our study resemble the findings of Chapuis-Lardy et al. (2006) who found an increase in labile P in sites invaded by S. gigantea. At SG1, S. gigantea is spreading easily and patches are still growing. Our results show differences in C mineralisation and POM status between sites invaded by P. serotina and non-invaded sites. However, because the soil texture was different between the non-invaded and invaded sites, differences may not exclusively be caused by the invading species. At site PS1 where litter decomposed faster in the plots invaded by P. serotina, in vitro C mineralisation in soil from invaded sites was also enhanced. P. serotina litter contains less lignin and lignocellulose than the native B. pendula. Therefore, P. serotina invasion may have gener-ated the more active and reactive SOM as confirmed by the increase in total soil C, and C and N of OMF. Comparing
pine and aspen soils, Giardina et al. (2001) showed that low quality litter resulted in high quality SOM with high mineralisation rates. In accordance with these authors’ findings, at our invaded PS1, P. serotina litter had lower N and higher C/N ratio than the native B. pendula. Alternatively, it is possible that N may not be limiting. However, our invaded soil had higher total soil C content and mineralisation compared to that in native plant species. Exotic invasive plant species slowing SOM dynamics, i.e. H. mantegazzianum and F. japonica
A reduction in soil C mineralisation and a decrease in C and N concentrations in some POM fractions were found after H. mantegazzianum invasion (HM1 and HM2) probably due to the creation of less active SOM, which reduced SOM dynamics. It is important to underline that at HM2 similar texture was present in the non-invaded and invaded sites. These results indicate that the invasive plant species litter might decompose more slowly than that of the native species, and thereby reduce SOM dynamics. Changes in SOM status might also reduce microbial biomass or alter microbial diversity and activity, which might reduce SOM dynamics. Kourtev et al. (2002, 2003) found that exotic invasive species could have profound effects on the composition of microbial communities.
The reduction in C mineralisation in sites invaded by F. japonica was observed only at FJ2. The lower soil C
Heracleum mantegazzianum
a
HM1 0 1 2 3 4 5 0 2 4 6 8 C-C02 (mg/g of soil) Uninvaded Invaded**
*
Fallopia japonicac
FJ1 0 1 2 3 4 5 0 2 4 6 8 Uninvaded Invaded 9.5 0 1 2 3 4 5 0 2 4 6 8 Time (weeks) Uninvaded Invaded**
**
**
b
HM2 0 1 2 3 4 5 0 2 4 6 8 Time (weeks) C-C02 (mg/g of soil) Uninvaded Invaded*
*
FJ2d
Fig. 3 C mineralisation (in vitroincubation) of soil under the canopy of exotic plants and of adjacent non-invaded (unin-vaded) soil at HM1 and HM2 (H. mantegazzianum) and at FJ1 and FJ2 (F. japonica). *P<0.05; **P<0.01
mineralisation observed in invaded sites at that site might indicate a lower F. japonica litter decomposition and incorporation into soil than the native species counterpart. However, F. japonica invasion at the FJ2 site induced an increase of N content in cPOM, but C mineralisation remained lower in invaded compared to non-invaded soils. This site, invaded by F. japonica, and non-invaded sites have similar soil characteristics (texture, soil acidity and POM quantity), so the observed lower C respiration and higher N of cPOM are most likely due to F. japonica
invasion. However, it appears that the impact of invasion by F. japonica might depend on parent material because there are no differences in C respiration between non-invaded and invaded plots at FJ1.
Conclusions
By studying POM status and C mineralisation, we have shown that SOM dynamics do change after invasion by exotic Table 6 Weight (%) of different soil fractions in non-invaded and invaded situations at different sites (S. gigantea and P. serotina)
Situations cPOM (%) FPOM (%) OMF (%) MF (%) cPOM (%) fPOM (%) OMF (%) MF (%) cPOM (%) fPOM (%) OMF (%) MF (%) S. gigantea SG1 SG2 SG3 Non-invaded mean ±SD 0.9± 0.42 5.1± 0.43 41.7± 8.87 52.3± 8.29 0.7± 0.27 6.5± 2.11 32.9± 5.57 59.9± 6.10 1.2± 0.44 9.0± 1.66 41.8± 9.22 48.0± 10.33 Invaded mean±SD 0.7± 0.28 3.8± 1.29 47.0± 8.54 48.5± 7.91 0.5± 0.24 7.3± 2.56 36.7± 5.41 55.5± 5.68 1.2± 0.37 10.4± 2.62 41.7± 7.72 46.7± 7.22 t-value 0.96 2.29* −1.05 0.81 1.19 −0.55 −1.18 1.27 −0.24 −1.05 0.02 0.24 P. serotina PS1 PS2 PS3 Non-invaded mean±SD 0.5± 0.27 2.4± 0.80 80.5± 3.95 16.6± 3.09 5.9± 4.50 9.0± 3.12 17.2± 1.63 67.9± 6.41 5.9± 4.50 9.0± 3.12 17.2± 1.64 67.9± 6.41 Invaded mean±SD 0.8± 0.42 2.7± 1.09 77.1± 4.74 19.4± 4.34 5.1± 1.47 6.5± 1.22 18.0± 2.09 70.4± 2.15 3.9± 1.52 6.6± 0.87 14.6± 2.49 74.9± 2.69 t-value −1.48 −0.45 1.36 −1.32 0.38 1.87 −0.75 −0.90 1.04 1.82 2.13 −2.47*
cPOM: coarse POM (4,000–250 μm), fPOM: fine POM (250–50 μm), OMF: organo-mineral fraction (0–50 μm), MF: all mineral size fractions together (50–4,000 μm).
*P<0.05 (P level in t-tests)
Table 7 C and N contents, and C/N ratio of total soil, cPOM, fPOM and OMF at SG1 and PS1
Situations and variables Total soil cPOM fPOM OMF
C% N% C/N C% N% C/N C% N% C/N C% N% C/N SG1 Non-invaded mean±SD 1.64± 0.18 0.20± 0.07 9.07± 3.06 26.45± 6.17 0.67± 0.36 43.90± 14.56 10.82± 2.04 0.52± 0.11 20.82± 1.71 1.93± 0.24 0.10± 0.00 15.71± 0.78 Invaded mean±SD 1.80± 0.30 0.17± 0.01 10.48± 0.86 33.17± 4.17 0.58± 0.13 57.98± 8.04 15.02± 4.07 0.72± 0.27 22.17± 2.80 2.08± 0.28 0.13± 0.05 15.42± 2.96 t-value −1.11 0.96 −1.08 −2.20* 0.52 −2.07 −2.25* −1.65 −1.00 −0.99 −1.58 0.23 PS1 Non-invaded mean±SD 1.91± 0.20 0.27± 0.13 7.95± 2.02 33.42± 3.53 1.07± 0.10 31.67± 5.11 15.10± 3.39 1.08± 0.20 13.88± 0.71 1.45± 0.33 0.12± 0.04 11.02± 0.31 Invaded mean±SD 2.45± 0.32 0.44± 0.20 8.18± 3.20 31.92± 9.71 1.48± 0.71 22.98± 4.85 16.45± 3.26 1.18± 0.27 13.85± 0.56 1.83± 0.20 0.18± 0.04 11.02± 0.24 t-value −3.44** −0.89 −0.14 0.35 −1.41 3.01* −0.70 −0.72 0.08 −2.36* −2.83* 0.00
cPOM: coarse POM (4,000–250 μm), fPOM: fine POM (250–50 μm), OMF: organo-mineral fraction (0–50 μm) *P<0.05 (P level in t-tests)
plants. Thus, after S. gigantea and P. serotina invasions, an enhancement of SOM dynamics occurs (high C contents of POM fractions and high soil C mineralisation). However, changes after P. serotina invasion is not clearly due to exotic plant invasion because soil texture was different at non-invaded and non-invaded sites.
After H. mantegazianum and F. japonica invasions, SOM dynamics slows (lower POM weight and C and N contents and lower C mineralisation). Thus, our methodol-ogy allowed us to assess SOM status after invasion by the selected exotic plant species. However, the difference in soil texture at 4 of 10 sites and the lack of litter decomposition of H. mantegazzianum and F. japonica do not allow us to generalise changes that occurred in SOM
status after exotic plant invasion. Thus, changes observed in the study mainly depended on local site characteristics (soil properties, parental material and plant cover), which determined the magnitude and direction of impact of the invasion by the four selected exotic plant species, i.e. S. gigantea, P. serotina, H. mantegazzianum and F. japonica on ecosystems. Selection of more sites with similar soil texture is crucial for assessing changes that occur after exotic plant invasion. This requirement is difficult to fill because the selected site were not created, but found naturally. In addition, further research on microbial activity after the invasion of the four identified exotic invasive plant species would be of great interest in the evaluation of their impacts on SOM dynamics.
Table 8 Weight (%) of different soil fractions in non-invaded and invaded situations (H. mantegazzianum and F. japonica)
Situations cPOM (%) fPOM (%) OMF (%) MF (%) cPOM (%) fPOM (%) OMF (%) MF (%)
H. mantegazzianum HM1 HM2 Non-invaded mean±SD 0.4±0.19 12.8±3.50 57.0±7.77 29.8±4.46 3.4±2.29 37.3±5.85 28.9±5.26 25.0±12.13 Invaded mean±SD 0.3±0.14 6.3±2.89 44.6±8.47 48.8±10.31 0.8±0.43 26.4±8.21 35.9±4.04 36.9±8.16 t-value 0.69 3.48* 2.64** −4.13* 2.69** 2.65** −2.57** −1.99 F. japonica FJ1 FJ2 Non-invaded mean±SD 0.9±0.35 10.2±2.12 35.7±10.26 53.2±11.47 0.5±0.26 8.6±1.8 51.2±4.48 39.7±6.28 Invaded mean±SD 0.5±0.11 9.36±4.04 34.8±8.31 55.3±11.40 0.5±0.38 8.9±1.50 45.5±5.24 45.1±6.05 t-value 2.51** 0.46 0.16 −0.32 0.15 −0.31 2.03 −1.53
cPOM: coarse POM (4,000–250 μm), fPOM: fine POM (250–50 μm), OMF: organo-mineral fraction (0–50 μm), MF: all mineral size fractions together (50–4,000 μm).
*P<0.01 (P level in t-tests) **P<0.05 (P level in t-tests)
Table 9 C and N contents, and C/N ratio of total soil, cPOM, fPOM and OMF at HM2 and FJ2
Situations and variables Total soil cPOM fPOM OMF
C% N% C/N C% N% C/N C% N% C/N C% N% C/N HM2 Non-invaded mean±SD 15.92± 4.80 1.02± 0.38 15.91± 1.55 33.73± 3.87 1.60± 0.31 21.53± 5.14 23.07± 6.26 1.42± 0.37 16.33± 0.75 17.60± 6.29 1.06± 0.41 16.60± 2.74 Invaded mean±SD 10.78± 2.07 0.64± 0.14 16.87± 0.79 32.97± 4.21 1.43± 0.23 23.31± 2.73 15.87± 2.97 0.98± 0.14 15.98± 1.18 11.21± 1.89 0.70± 0.15 16.66± 0.72 t-value 2.40* 2.29* −1.35 0.32 1.03 −0.75 2.54* 2.66* 0.60 2.37* 2.01 −0.05 FJ2 Non-invaded mean±SD 9.42± 1.21 0.59± 0.40 19.64± 6.86 38.65± 4.32 0.83± 0.16 46.46± 6.95 20.30± 2.06 0.78± 0.13 25.61± 1.82 10.41± 0.43 0.35± 0.05 31.11± 5.68 Invaded mean±SD 8.47± 2.00 0.38± 0.05 21.83± 1.98 35.41± 3.50 1.23± 0.30 30.26± 7.18 18.73± 2.91 0.78± 0.07 24.75± 1.47 10.00± 2.37 0.38± 0.07 27.20± 2.62 t-value 0.99 1.24 0.46 1.42 −2.86* 3.96** 1.07 0.00 0.90 0.42 −0.87 1.53
cPOM: coarse POM (4,000–250 μm), fPOM: fine POM (250–50 μm), OMF: organo-mineral fraction (0–50 μm) *P<0.05 (P level in t-tests)
Acknowledgements The authors thank Prof. J. Herbauts (ULB, Belgium) for his comments and suggestions and Mrs. M.J. Milloux (Géosol, CST Université de Bourgogne, France) for the C and N analyses. Thanks to Dr. Hugo Rainey (WCS, Congo-Brazzaville) for reviewing the English. The research was supported by Brussels-Capital Government—“Research in Brussels” RIB-2003-013.
References
Bremner JM, Mulvaney CS (1982) Nitrogen—total. In: Page AL, Miller RH, Keeney DR (eds) Methods of soil analysis part 2— chemical and microbiological properties, 2nd edn. American Society of Agronomy, SSSA, Madison, pp 595–623
Cambardella CA, Elliot ET (1992) Particulate soil organic matter changes across a grassland cultivation sequence. Soil Sci Soc Am J 56:777–783
Chapuis-Lardy L, Vanderhoeven S, Dassonville N, Koutika LS, Meerts P (2006) The effects of the exotic invasive plant Solidago gigantea on soil phosphorus. Biol Fertil Soils 42:481–489 Ehrenfeld JG (2003) Effects of exotic plant invasions on soil nutrient
cycling processes. Ecosystems 6:503–523
Gallardo A, Merino J (1993) Leaf decomposition in two Mediterra-nean ecosystems of Southwest Spain: influence of substrate quality. Ecology 74:152–161
Giardina CP, Ryan MG, Hubbard RM, Binkley D (2001) Tree species and soil textural controls on carbon and nitrogen mineralization rates. Soil Sci Soc Am J 65:1272–1279
Knicker H, Saggar S, Bäumler R, McIntosh PD, Kögel-Knabner I (2000) Soil organic matter transformations induced by Hieracium pilosella L. in tussock grassland of New Zealand. Biol Fertil Soils 32:194–201
Koutika LS, Andreux F, Hassink J, Choné Th, Cerri CC (1999) Characterization of organic matter in topsoils under rain forest and pasture in the eastern Brazilian Amazon basin. Biol Fertil Soils 29:309–313
Koutika LS, Hauser S, Henrot J (2001a) Soil organic matter in natural regrowth, Pueraria phaseoloides and Mucuna pruriens fallow. Soil Biol Biochem 33:1095–1101
Koutika LS, Didden WAM, Marinissen JCY (2001b) Soil organic matter distribution as influenced by enchytraeid and earthworm activity. Biol Fertil Soils 33:294–300
Koutika LS, Sanginga N, Vanlauwe B, Weise S (2002) Chemical properties and soil organic matter assessment in fallow systems in the forest margins benchmark. Soil Biol Biochem 34:757–765 Kourtev PS, Ehrenfeld JG, Häggblom M (2002) Exotic plant species alter the microbial community structure and function in the soil. Ecology 83:3152–3166
Kourtev PS, Ehrenfeld JG, Häggblom M (2003) Experimental analysis of the effect of exotic and native plant species on the structure and function of soil microbial communities. Soil Biol Biochem 35:895–905
Levine JM, Montserrat Vila M, D’Antonio CM, Dukes JS, Grigulis K, Lavorel S (2003) Mechanisms underlying the impacts of exotic plant invasions. Proc R Soc Lond B 270:775–781
Nelson DW, Sommers LE (1982) Total carbon, organic carbon, and organic matter. In: Page AL, Miller RH, Keeney DR (eds) Methods of soil analysis part 2—chemical and microbiological properties, 2nd edn. American Society of Agronomy, SSSA, Madison, pp 539–579
Saintenoy-Simon J (2003) Les plantes exotiques naturalisées et les espèces invasives en Wallonie. Parcs et Réserves 58:23–39 Sikora LJ, Yakovchenko V, Cambardella CA, Doran JW (1996)
Assessing soil quality by testing organic matter. In: Magdoff FR, Hanlon EA, Tabatabai MA (eds) Soil organic matter analysis and interpretation. SSSA Special Publication No. 46, Madison, WI, pp 41–50
StatSoft, Inc. (2003) STATISTICA (data analysis software system). Version 6.1
Vanlauwe B, Nwokoe OC, Sanginga N, Merckx R (1999) Evaluation of methods for measuring microbial biomass C and N and their relationship with soil organic matter particle size classes for soils from the West-African moist savanna zone. Soil Biol Biochem 31:1071–1082
Verloove F (2002) Ingeburgerde plantensoorten in Vlaanderen. Mededeling van het Instituut voor Natuurbehoud nr. 20, Brussels
Wander M (2004) Soil organic matter fractions and their relevance to soil function. In: Magdoff F, Weil R (eds) Advances in agroecology, CRC, Boca Raton, FL, pp 67–102