Three years experiment with the same tin oxide sensor arrays for the
identification of malodorous sources in the environment
A.-C. Romain, Ph. André, J. Nicolas
Department of Environmental Monitoring, Fondation Universitaire Luxembourgeoise (FUL), Avenue de Longwy 185B, 6700 Arlon, Belgium Abstract: The paper discusses the ability of recognition models to classify malodours in the environment 3 years after their calibration, with the same sources releasing odours. Two methodologies applicable either in the lab or in the field are used. The effect of the long term drift of the sensors is highlighted on the results of principal component analysis (PCA) and of discriminant function analysis (DFA).
The paper examines also the applicability of some drift counteraction methods proposed in the literature.
Handled with some care, a correction based on the drift direction in the principal components subspace should be applicable to the classification of real odorous sources in the field.
Keywords: Sensor array; Drift; Field monitoring
1. Introduction
The performance of electronic noses equipped with SnO2 sensor arrays is strongly dependent of several other
factors than the odorous mixture under investigation [1,2]. Particularly, the identification of malodours in the environment in dynamic conditions is concerned with changes of the sensor properties due to the ageing and the gradual poisoning of the sensor material.
The short-and long-term drift of the instrument, associated with the irreversible degradation of the sensor, have been studied [3-7].
Many exchange programmes within scientific groups deal with sensor drift problems and many works aim at counteracting the parameter drift [8-11].
To track the long-term drift, the change of the sensors responses with time is usually checked systematically, using pure substances or synthetic odorous mixtures. Frank et al. [7] investigate the sensor drift effects on classification results by simulating a linear decay in the sensors sensitivity.
Now, the problem, well known in the scientific community, is crucial for final users of electronic noses, such as those working in the environment with real malodorous samples.
The present paper presents how a SnO2 sensor array and its recognition models behave 3 years after the first
measurements with the same sources in the environment and with the same methodologies.
It focuses on the requirements of environmental applications which make the use of reference gases or of some compensation techniques difficult. It deals with real odours, measured in uncontrollable conditions, so that the concept of reproducibility hasn't the same meaning as the one applicable for rigorous and controlled experiments with stable samples.
2. Experimental
Four odorous sources [12] covering a range of typical environmental odours are analysed.
Those are a paint shop in a coachbuilding, a waste water treatment plant (near the fresh sludge aerobic treatment work), urban waste composting facilities (near the compost deposit area, which is under a shelter) and printing houses (there were two different printing houses for that study).
Two methodologies are used for the odour source identification, one in the lab and the second one in the field. The first is based on the malodours sampling in Tedlar® bags. The bag is filled by a passive sampling method without direct pumping of the air into the bag. The bag is placed in a stiff container in which the pressure is lower than the ambient pressure. The decreasing of pressure in the container is realised by a vacuum pump with a constant flow-rate of 3 Nl/min during 20 min. The Tedlar® bag is in contact with the sampling air only by a
PTFE tube. The volume of the collected gas is about 50 dm3.
Samples are taken at various distances from the source in various atmospheric and operational conditions. All samples are analysed in the lab, by an array consisting of 12 individual commercial tin oxide gas sensors (Figaro Engineering Inc.), placed in a cubic chamber. A constant voltage is supplied to the sensor heaters, continuously during 3 years. The sensor resistance, the temperature and the humidity of the chamber are recorded by a computer controlled acquisition board.
A complete measurement cycle is applied. First odourless air is drawn across the sensor chamber (baseline phase) then the sampled odour is pumped (analysis phase).
The humidity value for the baseline air is similar to that of the sampled odour with the maximum variation of 30%. The reference air is bubbled into saturated solution (KC1 in melting ice). The relative humidity measured in the chamber varies from 15 to 25% RH.
The useful signal in this methodology is the stabilised resistance value.
The second methodology consists in simply placing 8 tin oxide sensors soldered on an electronic board in static contact with the ambient odorous air. The signal is continuously recorded in the field, at various locations, either next to the source or far from it, but without any reference air. The qualitative evaluation of the odour is made in real time by the operator who is the one and only panellist. Afterwards, data are off-line processed by
commercial software packages (Statistica and Matlab).
For the data analysis, the sensor parameter used is the resistance of each sensor, normalised by the square root of the sum of all the sensor resistance values squared. Such normalisation reduces the dependency of the array response to the odour concentration, and also reduces slightly the effect of sensors' drift. For the lab tests, the best classification is always obtained with the raw resistance, and not with the difference between the signal and the base line. This is probably due to the small fluctuations in the chemical quality of the reference air [13]. Three classical pattern recognition techniques are used: principal component analysis (PCA), discriminant function analysis (DFA) and artificial neural network (ANN) with backpropagation (BP) learning algorithm. Unsupervised methods, such as PCA, provide basically a performance evaluation of the whole measurement system during the development phase. Supervised method, such as DFA or BP are used to assign, after the training process, an unknown odour to one of the five classes (compost, printing, paint shop, waste water or odourless air).
Tests are performed during three periods in 1998, in 1999 and in 2001 (field monitoring only in 1999 and in 2001).
3. Results
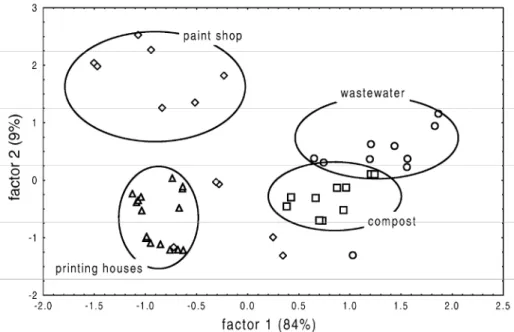
After the first measurement campaign, in 1998, the results were quite promising [12-15], in spite of the
environmental constraints (temperature and humidity influence [14], wind speed effect, odour variation in nature and in concentration, ever changing background air, chemical interference, difficulties of the maintenance). Fig. 1 shows the scores of 48 observations in the plane of the two first factors of a PCA for the lab tests with the 12 sensor array in 1998 (for a 7 months period between March and October). The scatterplot shows a quite good clustering of the observations among the four sources. Only some observations from the paint shop in the coachbuilding and one observation around the waste water treatment plant are far from their main clusters. Similar results are obtained with the observations made with the field instrument in 1999, notably around the compost area. The resistance from the eight sensors is continuously recorded during about 2 h with a 30 s storage interval. A total of 388 such data are recorded for the malodours around the four sources and for odourless air far from any source. The total data set concerns 10 different days for a 2 months period, during June and July 1999.
Fig. 1: Scatterplot in the plane of the two first principal components of the scores of the 48 observations made in
1998 with the lab instrument from the four odorous sources.
Fig. 2: Scatterplot in the plane of the two first principal components of the scores of the 388 observations made
with the field instrument in 1999.
Fig. 2 shows the scatterplot of the scores in the plane of the two first principal components. It concerns 127 observations made around the compost area, 112 observations with odourless air and 149 observations in the vicinity of the three other odorous sources.
Three groups can be distinguished. The overlapping of the clusters "compost" and "odourless air" is normal since some measurements around the compost area are made relatively far from the source.
The supervised methods provide also rather good classification model. Out of the 48, 40 lab measurements are used to calibrate a model with DFA and the 8 remaining samples are tested for validation: results exhibit 100% of correct classification.
A discriminant function model is also trained with field data and the so calibrated classification functions are further used for validation purpose around the compost area [15]. Five classification functions (one for each
source and one for the odourless air) are provided by DFA to assign a new case into one of the known groups: a case is classified into the group for which it has the highest classification score. In Fig. 3, two of those functions are used to identify the odour in the field. The mobile detector is moved to various spots around the compost area and, at each sampling time of the data logger, the data from the sensor signals are inserted into each previously calibrated function. The figure shows the graphical evolution of the two functions: "compost" and "background" or odourless air.
The function corresponding to the compost has the highest value when the detector is near the source, and the function characterising the background air is maximum when the detector is far from the source. Such classification functions can thus be used as "odour indexes" to identify a global odour in the field.
These first results are thus very encouraging, but they are not sufficient. Spot validation during such a short period, even if data extends over 7 months, is not enough. In order to examine more deeply the ability of the electronic nose principle to identify and to monitor malodours in the environment, the final user needs to have some information about the time behaviour of the sensors.
The same sources are, thus, investigated with the same instruments 2 or 3 years after the first measurements in order to evaluate the effect of the sensor drift on the recognition. The question is: the sensor array and the classification techniques are they able to perform long term prediction, i.e. is the recognition model calibrated in 1998 still applicable to classify observations of 2001?
Concerning the hardware, only 6 out of the 12 sensors from the lab instrument are still operational. The other 6 are either damaged or they reveal an important signal variation which should not be considered as a simple drift. In addition, more than 30% of the base line variation is recorded. For the measurements of 1999 and 2001, only the six remaining sensors are then used. Besides the 48 observations of 1998, 44 additional measurements are made in 1999 and 5 more in 2001 near the same sources.
Fig. 3: Evolution of the classification functions relative to the compost and to the background air when moving
the detector around the compost area.
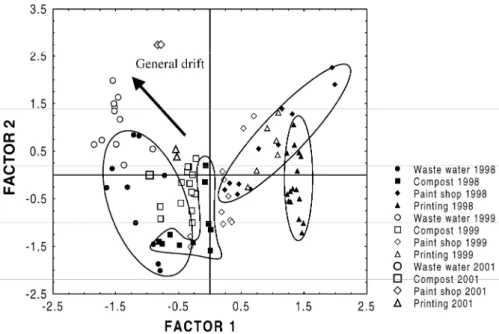
PCA is carried out with the whole data set of 97 observations made during the 3 years. Fig. 4 shows the scatterplot of the scores in the plane of the two first principal components.
For the 48 observations of 1998, the data clustering remains rather good (filled black symbols, surrounded by closed curves, drawn for a clearer visual impression), even with only the six sensors. However the other data points (open symbols of two different sizes), corresponding to more recent observations, does not show interpretable clusters. This is due to the sensor drift, which induces a spread of the scatter of points in a general direction indicated by the arrow on the drawing.
Additionally, the classification model calibrated by DFA in 1998 with 12 sensors is no longer applicable for validation of more recent observations. A new training with the same 48 observations of 1998 must be performed with the six remaining sensors.
The DFA results obtained from those data are then used in order to classify the 49 new observations. Fig. 5 shows the scatter diagram of data points in the plane of the two first discriminant functions.
The figure shows obviously a long time drift effect which excludes the possibility of accurate recognition of the sources.
The total percentage of correct classification decreases from year to year: 97.9% for the observations of 1998 which were used for the model calibration, 81.8% for the observations of 1999, used for validation purpose, and only 20% for the observations of 2001.
Better results are obtained with the methodology used in the field: the eight sensors of the detector are still functioning and the classification results are quite good, even 2 years after the first measurements. Fig. 4: PCA results for 97 observations around four odorous sources from 1998 until 2001.
Fig. 5: DFA results for 97 observations around four odorous sources: model calibrated with data of 1998 and
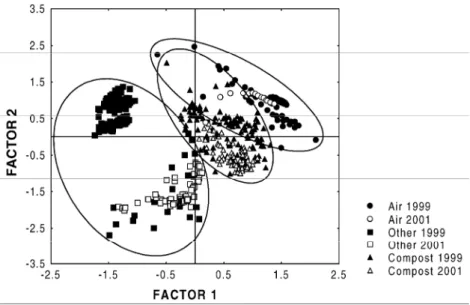
Fig. 6: PCA results for 497 observations with the field detector around odorous sources, in 1999 and 2001.
The Fig. 6 shows the scatter diagram of scores for 497 observations for 1999 and 2001 in the plane of the two first principal components: the three clusters are still well distinguished, and the drift effect is not as apparent as on Fig. 4.
A classification model is calibrated by DFA with 150 observations made with the field detector in 1999: it still provides good predictions for 88 observations from the 2001 measurement period.
The percentage of classification of the data of 1999, used for the model calibration (a total of 97% of
observations correctly classified), is sufficient. In spite of the sensor drift, in the phase of validation, the 2001 data are correctly classified (95.7%).
4. Discussion
The classification of field measurements is better than the one obtained with the lab instrument. However, the application is easier: there are only three classes of odour sources in place of five, the possible drift effect should concern only 2 years of measurements in place of three and finally, as the instrument is very simple (the sensor array is directly in contact with the ambient air, without any sampling apparatus and any pumps), there are less disturbing factors in the system.
Anyway, the long term drift has actually a negative effect on the classification performances of recognition models: clusters overlap each other and have irregular shapes. Therefore the drift must be counteract if the tin oxide sensor array is to be used for real malodours monitoring for more than 2 years.
Using standard gases to calibrate the instrument is not easy for environmental applications of electronic noses. Indeed, it will never be possible to extrapolate the behaviour of the sensor array in the presence of a pure substance to its response when it is placed in the real environmental ambience. The olfactory pollution is the result of a complex mixture of gases, and the nature, the number and the concentration of each compound can change from day to day. Therefore selecting the "all-purpose" standard gas, typical of all environmental odours is more than a challenge. The response of the instruments used in the present study periodically tested with ethanol, in order to evaluate the drift importance for that specific compound, but it is difficult to deduce from it a general law valid for any gaseous mixture.
Calibrating a classification model with a supervised method, like DFA or BP, does not perform well if clusters overlap.
In order to assess the importance of the drift, unsupervised methods, like PCA, should be applied since they highlight the underlying general structure of the data. A drift counteraction method has been proposed by Martin Holmberg [16]. The drift direction is estimated from general trends underlined by the scores scatter diagram in the subspace of first principal components. The projection of the points on the drift direction is then removed
from the data before the pattern recognition stage. The original method assumes that the drift direction
highlighted by PCA is obtained from measurements on a reference gas. In our case, such a method should be still applicable if the general spread of the scatter of points could be extracted from the measurements on real
environmental sources over a long time period.
However, it must be pointed out that such main directions are not always obviously shown up in the plane of the two first principal components. Many other factor than the sensor drift can indeed influence the data structure (climate, operational conditions, gas concentration, ...). Sometimes, the time drift is shown by the third or the fourth principal component. Very often, the direction is an oblique line in the PC subspace. Moreover, the drift directions are not always identical for all sources. Then, it could be suggested to calculate a different algorithm of drift compensation for each individual source. Such an approach could not however be applied for further recognition of unknown source in the environment: which algorithm should be selected when the source is unknown?
When the spread due to the time drift presents a common general direction for every source, such a method can nevertheless be applicable for the recognition of odorous sources in the environment.
In this case, it must be always applied in two steps. In the first step, the PCA (or other unsupervised method) is used to highlight the main drift direction and to calculate the correction to apply to the scores. In the second step, the new score values or the original data, recalculated by taking the drift correction into account, are used to calibrate a classification model (with DA, ANN, ...). The latter can be then used for further on line validation on unknown data.
Such recognition model should be regularly updated as the drift effect increases. 5. Conclusion
It is possible to use tin oxide sensor arrays for the monitoring of real malodours in the field during more than 2 years. However, since the life time of sensors is limited, some spare sensors must be added in the array. Moreover, the long term drift must be taken into account in data processing. As the correction algorithms calculated with standard gases cannot be generalised for the complex gas mixtures in the environment, adaptive drift compensation models must be calibrated. Models using the general trends highlighted by unsupervised techniques, like PCA or SOM, can be applied, but with care. Further studies will be devoted to the development of counteraction methods. They may be relevant for the recognition of odorous sources in the environment.
References
[1] D. Hodgins, The development of an electronic nose for industrial and environmental applications, Sens. Actuators B 26/27 (1995) 255-258.
[2] R.M. Stuetz, R.A. Fenner, G. Engin, Characterisation of wastewater using an electronic nose, Water Res. 33 (1999) 442-452. [3] J.W. Gardner, P.N. Bertlett, Electronic Noses—Principles and Applications, Oxford University Press, Oxford, 1999, pp. 126-128 and 178-179.
[4] M. Holmberg, F. Winquist, I. Lundstrom, F. Davide, C. DiNatale, A. D'Amico, Drift counteraction for an electronic nose, Sens. Actuators B 35/36 (1996) 28-535.
[5] M. Holmberg, F. Davide, C. DiNatale, A. D'Amico, F. Winquist, I. Lundstrom, Drift counteraction in odour recognition applications: lifelong calibration method, Sens. Actuators B 42 (1997) 185-194.
[6] R. Ionescu, A. Vancu, A. Tomescu, Time-dependent humidity calibration for drift corrections in electronic noses equipped with SnO2 gas
sensors, Sens. Actuators B 69 (2000) 283-286.
[7] M. Frank, T Hermle, H. Ulmer, J. Mitrovics, U. Weimar, W. Göpel, Quality tests of electronic noses: the influence of sample dilution and sensor drifts on the pattern recognition for selected case studies, Sens. Actuators B 65 (2000) 88-90.
[8] T Artursson, M. Sjöström, M. Holmberg, A comparison between different drift counteraction methods, in: Proceedings of ISOEN'99, Tubingen, Germany, 20-22 September 1999, pp. 241-242.
[9] M. Pardo, G. Niederjaufner, G. Benussi, E. Comoni, G. Faglia, G. Sberveglieri, M. Holmberg, I. Lundstrom, Data preprocessing enhances the classification of different brands of Expresso coffee with an electronic nose, Sens. Actuators B 69 (2000) 397-403.
[10] R. Menzel, S. Ehrmann, J. Goschnick, Dynamic classification models to be used for fast air quality assessment with gradient gas sensor micro arrays in on-line process control, in: Proceedings of Eurosensors XIII, The Hague, The Netherlands, 12-15 September 1999, pp. 983-986.
[11] C. Distante, P. Siciliano, L. Vasanelli, Odor discrimination using adaptive resonance theory, Sens. Actuators B 69 (2000) 248-252. [12] A.-C. Romain, J. Nicolas, V. Wiertz, J. Maternova, P. André, Use of a simple tin oxide sensor array to identify five malodours collected in the field, Sens. Actuators B 62 (2000) 73-79.
[13] J. Nicolas, A.-C. Romain, V. Wiertz, J. Maternova, P. André, First trends towards a field odour detector for environmental applications, in: Proceedings of ISOEN'99, Tübingen, Germany, 20-22 September 1999, pp. 368-371
[14] A.-C. Romain, J. Nicolas, P. André, In situ measurement of olfactive pollution with inorganic semiconductors: Limitations due to humidity and temperature influence, Seminars Food Anal. 2 (1997) 283-296.
[15] J. Nicolas, A.-C. Romain, V. Wiertz, J. Maternova, P. André, Using the classification model of an electronic nose to assign unknown malodours to environmental sources and to monitor them continuously, Sens. Actuators B 69 (2000) 366-371.
[16] M. Holmberg, Data Evaluation for an Electronic Nose, Ph.D. Thesis, Department of Physics and Measurement Technology Linköping University, Linköping, Sweden, 1997.
Biographies
Anne-Claude Romain graduated in chemical sciences from the University of Liège (Ulg, Belgium) in 1992.
She received the master in Environmental Sciences from the Fondation Universitaire Luxembourgeoise of Arlon (FUL, Belgium) in 1993. Since 1995, she is a researcher at the same university (FUL) and has been working on the development of a malodour detector. She currently applies the electronic nose concept to the monitoring of odours in the environment in the frame of a PhD thesis.
Philippe André graduated in work engineering from the University of Louvain (UCL, Belgium), in 1983. He
received his PhD degree in Environmental Sciences from FUL in 1993. He has been involved with research projects in the field of Energy Management of Buildings (included Solar Energy) for more than 10 years. His main research interest is currently concerning the development and application of innovative control algorithms applied to the use of Renewable Energies with some applications to landfill management.
Jacques Nicolas is Engineer in Physics. He received his PhD degree in 1977 in Surface Physics in University of
Louvain, Belgium. He joined Fondation Universitaire Luxembourgeoise (FUL, Arlon, Belgium) in 1979, where he worked first on Solar Energy. He is currently the leader of the department "Environmental Monitoring" at FUL and he gives lectures in the field of environmental parameter measurement. His main research interest is the development of odour and indoor air pollution detectors usable in the field.