Time-dependent convection study of the driving mechanism in the DBV white dwarfs
This article has been downloaded from IOPscience. Please scroll down to see the full text article.
2008 J. Phys.: Conf. Ser. 118 012051
(http://iopscience.iop.org/1742-6596/118/1/012051)
Download details:
IP Address: 139.165.20.29
The article was downloaded on 12/11/2010 at 11:09
Please note that terms and conditions apply.
Time-dependent convection study of the driving
mechanism in the DBV white dwarfs
M A Dupret1, P O Quirion2, G Fontaine3, P Brassard3 and A Grigahc`ene4
1
Observatoire de Paris, LESIA, CNRS UMR 8109, 5 place J. Janssen, 92195 Meudon, France
2
Institut for Fysic og Astronomi, Aarhus, Denmark
3
Universit´e de Montr´eal, Qu´ebec, Canada
4
CRAAG - Algiers Observatory BP 63 Bouzareah 16340, Algiers, Algeria E-mail: [email protected]
Abstract. We apply for the first time time-dependent convection (TDC) models to the study
of the driving mechanism of the Pulsating DB (V777 Herculis) white dwarfs. From the blue to the red edge of the instability strip of these stars, TDC appears to play a central role in the driving. Around the blue edge, the convection adapts quasi-instantaneously to the oscillations, so that TDC must be included in the models. For the first time, we show that the red edge of the DB instability strip is successfully obtained with a TDC treatment, especially thanks to the terms due to the turbulent pressure variations, while it is not reproduced with frozen convection models.
1. Introduction
The variable DB white dwarfs are the helium-rich analogs of the better known ZZ Ceti stars. They show multiperiodic non-radial g-mode oscillations with typical periods between 400 and 800 seconds. Their effective temperatures are subject to uncertainties caused by the possible presence of undetectable Hydrogen in their atmosphere (see fig. 4). Studies of the driving mechanism of these stars using Frozen Convection (FC) have been performed by different authors, the most recent being [4]. A very efficient convective envelope is present in the driving region (figs. 1-3), but none of the previous non-adiabatic studies take the time-dependent character of convection into account. We show here that convection adapts quickly to the oscillations in these stars so that TDC models must be used to understand the driving of their g-modes.
2. The convection envelope
In this study, we use full evolutionary models calculated with the white dwarf stellar code introduced in [2]. In these models, the Mixing-Length Theory of convection is used with the parameters defined in [2] being l = Hp, a = 1, b = 2 and c = 16, generally refered to as ML2.
As shown in Fig. 1 where we give the degree of ionization and log κ of two DB models, the 1st and 2nd partial ionization zones of He lead to a large opacity bump in the superficial layers of these stars. This leads to the presence of a convective envelope whose extension is given in yellow. We are going to show that this convection zone plays a major role in the driving mechanism of the DBVs.
Figure 1. Degree of ionization Z (blue) and the log of opacity κ (black) as a function of log q = log(1 − m(r)/M ) , for two 0.54 M⊙models on the blue side (left, Teff = 26790 K) and
red side (right panel, Teff = 19830 K) of the DBV instability strip. The left and right vertical
dashed lines are respectively placed at optical depth of τ = 100 and τ = 1. In white dwarfs, the degree of ionization depends of T and P in a complex way. For exemple, in these two models, pressure leads to recombination above the photosphere and at log q ∼ −7.
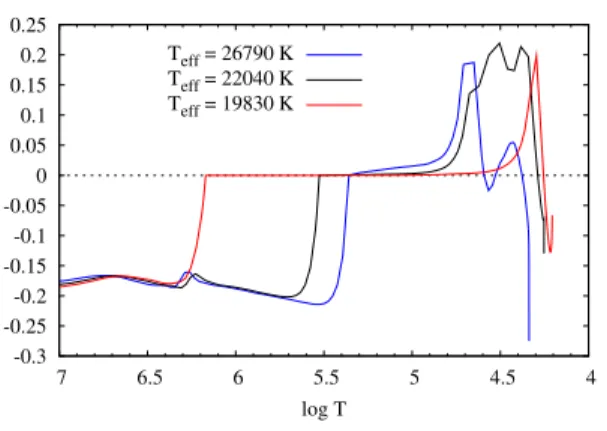
-0.3 -0.25 -0.2 -0.15 -0.1 -0.05 0 0.05 0.1 0.15 0.2 0.25 4 4.5 5 5.5 6 6.5 7 log T Teff = 26790 K Teff = 22040 K Teff = 19830 K
Figure 2. ∇ − ∇ad for three 0.54 M⊙models
with different Teff.
0.01 0.1 1 10 100 1000 10000 4 4.5 5 5.5 6 6.5 7 log T τconv Teff = 26790 K Teff = 22040 K Teff = 19830 K
Figure 3. Convective life-time τconv for three
0.54 M⊙ models with different Teff.
The size of the DB’s convective envelope increases quickly as Teff decreases. As shown
in Fig. 2, the high efficiency of convection leads to a nearly adiabatic stratification in the deep layers. In Fig. 3, we give the life-time of convective elements for the same models. The horizontal green lines give the period interval of typical observed modes in DBV stars. The life-times of convective elements are much smaller than the pulsation periods so that convection is expected to adapt quasi-instantaneously to the pulsations. In this limit case, a time-dependent convection (TDC) treatment is required. The Frozen Convection (FC) treatment is valid only when the life-time of convective elements is much larger than the pulsation periods.
3. Time-dependent convection models
We use here the TDC theory of [3], with the last improvements of [5]. This theory gives expressions for the variations of the convective flux and turbulent pressure that we have implemented in our non-radial non-adiabatic pulsation code MAD. The TDC treatment was
adapted here so that it reduces, in the stationary case, to the Mixing-Length treatment adopted in our models. The treatment is local for consistency with these models. A free parameter β was introduced in the perturbed closure equation of our TDC treatment [5]. In the models presented here, we take the value β = 1 which allows us to obtain the correct red edge of the instability strip. Only the models on the cooler side of the instability strip are sensitive to this parameter.
4. Theoretical instability strip
7.5
7.6
7.7
7.8
7.9
8
8.1
8.2
8.3
8.4
18000
20000
22000
24000
26000
28000
30000
Log g
T
eff(K)
Figure 4. Theoretical instability strips obtained with our TDC treatment including δPturb; the
bullets give the location of 8 known variable DB stars obtained using atmosphere models with (grey) and without (violet) Hydrogen ([1]).
0 200 400 600 800 1000 1200 1400 1600 1800 2000 18000 20000 22000 24000 26000 28000 30000 Period (seconds) Teff (K)
Figure 5. Periods (seconds) of the unstable ℓ = 1 g-modes predicted by our TDC models as a function of Teff along the
evolutionary sequence of 0.6 M⊙.
The horizontal green lines give the interval of typical observed periods of DBV stars.
We performed non-adiabatic computations for a grid of DB white dwarfs models of 0.54 M⊙
and 0.60 M⊙. We present in Fig. 4 the blue and red borders of the theoretical instability
strip obtained with our TDC treatment, including the modeling of turbulent pressure variation. It appears that δPturb must be enhanced by a factor 4 to obtain the correct red edge. We
neglected in the present study the perturbation of the non-diagonal components of the Reynolds stress tensor, this explains maybe why we had to enhance δPturb. FC models and TDC models
neglecting δPturb do not give the red edge. The bullets give the location of 8 known variable
DB stars. Two different determinations of their Teff and log g were obtained by [1]: in violet
the atmosphere models have no H, in grey they contain H traces at the detection threshold. As shown in Fig. 5, the period interval of the unstable g-modes predicted by our models is broader than what has been observed up to now.
5. Interpretation of the results
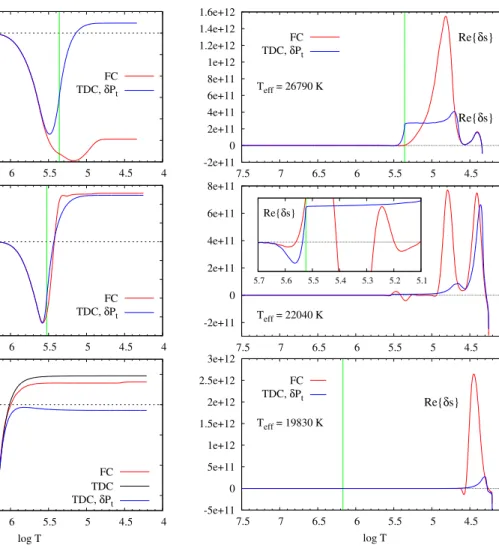
We compare and interpret in Figs. 6,7 and 8 the eigenfunctions obtained with our TDC models including the variation of turbulent pressure (blue) and with frozen convection (red). From top to bottom, three models of 0.54 M⊙ from the blue to the red side of the instability strip are
considered. The mode considered here is ℓ = 1, g15.
-6e-06 -5e-06 -4e-06 -3e-06 -2e-06 -1e-06 0 1e-06 4 4.5 5 5.5 6 6.5 7 7.5 Work integral Teff = 26790 K FC TDC, δPt -2.5e-06 -2e-06 -1.5e-06 -1e-06 -5e-07 0 5e-07 1e-06 1.5e-06 4 4.5 5 5.5 6 6.5 7 7.5 Work integral Teff = 22040 K FC TDC, δPt -3e-09 -2e-09 -1e-09 0 1e-09 4 4.5 5 5.5 6 6.5 7 7.5 log T Work integral Teff = 19830 K FC TDC TDC, δPt
Figure 6. Work integrals for three 0.54 M⊙
models with different Teff.
-2e+11 0 2e+11 4e+11 6e+11 8e+11 1e+12 1.2e+12 1.4e+12 1.6e+12 4 4.5 5 5.5 6 6.5 7 7.5 Re{δs} Teff = 26790 K FC TDC, δPt -2e+11 0 2e+11 4e+11 6e+11 8e+11 4 4.5 5 5.5 6 6.5 7 7.5 Re{δs} Teff = 22040 K 5.1 5.2 5.3 5.4 5.5 5.6 5.7 Re{δs} -5e+11 0 5e+11 1e+12 1.5e+12 2e+12 2.5e+12 3e+12 4 4.5 5 5.5 6 6.5 7 7.5 log T Re{δs} Teff = 19830 K FC TDC, δPt
Figure 7. Re{δs} for three 0.54 M⊙ models
with different Teff.
The work integrals presented in Fig. 6 are normalized so that the surface value gives the growth-rate of the mode multiplied by the dynamical time. Regions where it increases outwards have a driving effect. We see that the main driving always occurs near the convective envelope bottom (green vertical lines). Significant differences between TDC and FC results are found at both the blue side (top panel) and red side (bottom panel) of the instability strip. For the cool model (bottom), the Lagrangian perturbation of turbulent pressure must be included to stabilize the modes (blue); without this term, the mode remains unstable (black).
In TDC models, convection adapts quasi-instantaneously to the oscillations because of the small life-time of the convective elements. But convection is very efficient in the deep regions and a very small entropy gradient is able to transport energy (see Fig. 2). Hence TDC models do not allow significant entropy gradient to occur and a plateau of δs is predicted (Fig. 7). This plateau leads to a gain of heat (ρT δs) near the bottom of the convective envelope which is much larger than in FC models. This large energy input is transformed in mechanical work driving the oscillations more efficiently in TDC models than in FC models. Toward the red side of the instability strip, this effect is counterbalanced by the significant damping due to the turbulent pressure variations (see above). In FC models, the entropy gradient takes unrealistic high values in the upper part of the convective zone as there is no control of it by the energy equation throughout the convective flux variations.
-3000 -2000 -1000 0 1000 2000 3000 4000 4.8 5 5.2 5.4 5.6 5.8 6 6.2 6.4 log T Teff = 26790 K δL/L FC δL/L TDC δLR/L TDC δLc/L TDC -2000 -1000 0 1000 2000 3000 4000 5000 6000 7000 4.8 5 5.2 5.4 5.6 5.8 6 6.2 6.4 log T Teff = 22040 K δL/L FC δL/L TDC δLR/L TDC δLc/L TDC
Figure 8. Total luminosity variation (red and black) and contribution due to radiation (blue) and convection (grey) for two models with different Teff; red for FC results, others for TDC.
The TDC models must find a way to obtain a constant δs in the deep part of the convection zone. This in turn determines δL throughout the energy equation. The values of δs imposed by the boundary conditions lead to huge variations of the radiative luminosity near the bottom of the convection zone of the hot model (Fig. 8, left, blue curve); but they are easily counter-balanced by δLc/L because convection is very efficient (grey curve), leading to reasonable values
of the total luminosity variations (black). As Teff decreases (right panel of Fig. 8), δs becomes
smaller in the deep part of the convection zone (see Fig. 7, middle panel), this leads to smaller radiative luminosity variation and less convective luminosity variation is required to counter-balance it. Hence, TDC and FC results differ less for the model with Teff = 22040 K.
6. Conclusion
Our study clearly shows that Frozen Convection (FC) is not suitable for the study of any region of the DB instability strip. Our time-dependent convection (TDC) treatment provides the position of the blue edge around Teff ≈ 28000 K and of the Red edge at Teff ≈ 20000 K. For a
given choice of the ML parameters, the blue edge is displaced towards higher Teff with our TDC
treatment compared to the FC case. But more important, we provide the first determination of the red edge of the instability strip. These new results, summarized in Fig. 4, are consistent with spectroscopic determination of effective temperature and surface gravity of known variable DB white dwarfs.
References
[1] Beauchamp A, Wesemael F, Bergeron P, Fontaine G, et al. 1999 ApJ 516 887 [2] Fontaine G, Brassard P and Bergeron P 2001 PASP 113 409
[3] Gabriel M 1996 Bull. Astron. Soc. Of India 24 223 [4] Gautschy A and Althaus L 2002 A&A 382 141
[5] Grigahc`ene A, Dupret M A, Gabriel M, et al. 2005 A&A 434 1055
![Figure 4. Theoretical instability strips obtained with our TDC treatment including δP turb ; the bullets give the location of 8 known variable DB stars obtained using atmosphere models with (grey) and without (violet) Hydrogen ([1]).](https://thumb-eu.123doks.com/thumbv2/123doknet/5880040.143498/4.893.131.761.347.692/theoretical-instability-obtained-treatment-including-obtained-atmosphere-hydrogen.webp)